Gold rising wedge pattern before CPIThe rising (ascending) wedge pattern is a bearish chart pattern that signals an imminent breakout to the downside.
It's the opposite of the falling (descending) wedge pattern (bullish), as these two constitute a popular wedge pattern.
A rising wedge is a technical indicator, suggesting a reversal pattern frequently seen in bear markets.
This pattern shows up in charts when the price moves upward with pivot highs and lows converging toward a single point known as the apex.
When it is accompanied by declining volume, it can signal a trend reversal and a continuation of the bear market
upside target if it fakeout 1765
downside target 1650
Wedgepatterns

Learn How to Trade Wedge Patter | Full Strategy Explained 📚
Hey traders,
In this video, you will learn how to trade wedge pattern.
We will discuss the theoretical basics of this pattern.
Then, on a real market example, I will show you how to spot and trade it.
❤️Please, support this video with like and comment!❤️

EURUSDHello dear friends
The price is currently within a 20-year range, from this range, a reaction can be expected.
According to the descending wedge pattern at the end of the downward trend and the positive divergence of the RSI , if the $1.00133 range is completely consumed in the current trend, there is a high possibility of forming an upward trend similar to the drawn scenario.

Btc analysis - 4HMany Rising and Falling wedges can be seen in the Bitcoin chart,
and according to the support and resistance, the following price trend for Bitcoin can be analyzed.
1- Rising wedge
2- Falling wedge
3- Support & Resistance
4- Fib Retracement
low price : 13530
@MOYA70
insta : Moya.btc
web : Moya.ir
thank you for like me

Trading opportunity for AVAXUSDT AvalancheBased on technical factors there is a Long position in :
📊 AVAXUSDT Avalanche
🔵 Long Now or by Breakout
🧯 Stop loss 16.91
🏹 Target 1 23.50
🏹 Target 2 27.20
💸Capital : 1%
We hope it is profitable for you ❤️
Please support our activity with your likes👍 and comments📝

WHAT TO EXPECT ETHEREUM MERGE SEPTEMBER 10 (CHART)Wedge pattern and merge in mid September, actively strong against btc.
ETH?BTC review at 4q of video


Bitcoin wedge formation?Looks like a wedge formation on the bitcoin 5 minute chart. Will it break up or break down ? the trend is down so it is more likley to bream down although there has been some really large whales playing the trend lets see what will happen and if it meets either target?

$ANPC Next Target PT .55 and higherAnPac Bio-Medical Science Co., Ltd., a biotechnology company, researches, develops, markets, and sells multi-cancer screening and detection tests using cancer differentiation analysis technology and device to corporations and life insurance companies in the People's Republic of China. It also offers physical checkup package services. The company was incorporated in 2010 and is headquartered in Lishui, the People's Republic of China.

EURCHF ready for a massive breakout-on the 4h timeframe , we have a falling wedge and a divergence between price and RSI
-so we expect market to breakout this pattern
-for more ideas , PLZ
"LIKE" and "FOLLOW"

NEOUSDTHello Dear friends
The price range of $10.6 has nicely maintained the trend. If the upward channel is maintained and the trend does not fall below the price range of $10.23, the possibility of forming an upward trend up to the price range of $12.1 is not out of mind.
Currently, a bearish wedge has formed in the 30-minute time frame. If the upward trend is above the price range of $11.19, the mentality of forming an upward trend up to the specified range will be strengthened for us.
We would be happy to hear your comments.

GJ counter-trend LONG?-Weekly candle closed
with a nice rejection.
-Weekly is forming a channel
to continue up.
-Daily has h&s in play,
momentum has slowed down
giving us 2 dojis which indicate
reversal.
-4hr is on a wedge pattern which
has high success rate.
What is your guys views on this?

BTCUSDTHello my dear friends
In your opinion, how valid is the drawn pattern?!?!?
We will not have the mindset to form a bearish trend until the corrective trend is below the $22,671.97 price range.
Don't forget the marked white and yellow ranges ($24,319 & $24,626) are valid after the $22,671.97 price range is fully consumed!
We would be happy to hear your comments.

SOL: Wedge Pattern!SOL/USDT is making a rising wedge pattern on 1 day chart.
There can be 2 scenarios:
1. If SOL breakout through the lower trend line below 40 then the targets are on next support areas marked on the chart (Green)
2. If SOL holds the area in the wedge then the targets are on next resistance areas marked on the chart (Red)
Share your views in the comment section.
Like & follow for more easy and simple trading ideas.
Thank You!

STAR - Wait for the confirmation Expecting a breakout at the level of 357-360
These are my thoughts am not recommended advisor.. Do your own analysis , when you enter , please be prepared with minimum 3-4 good reasons why you enter.
* Giving confirmation but failing to breakout
* Lets wait for confirmation and make conclusions from MA and VOL
* Falling Wedge followed by good consolidatory support zone
PS: This is for educational purpose. Feel free to give your own thoughts and I am happy to learn from you.

falling wedge wedge NASDAQ first six months of the year has been bad for nasdaq. it has made more than 30% correction after coronavirus boom.
this series of lower low and lower high has made falling wedge pattern
in this downward correction because fed QT beginners investor made loss while big investor were waiting from sideline for 30% correction.
new quarter and new half of the year and recession in usa has been started
✅will Nasdaq benefit form portfolio rebalancing in H2 2022 ?
✅will nasdaq make new all time high in stagflation (because it will take several years to send inflation back to 2%)
✅will fed pause rate hike in September fomc ?

Ethereum ETH at critical support border of rising wedge !!!Ethereum at critical support border of rising wedge !!!
As many other cryptocurrencies ETH is in a rising wedge that is typically a bearish pattern
Right now we are at critical levels on price chart and RSI again - exciting hours are imminent dear Crypto Nation
Will keep you updated
*not financial advice
do your own research before investing

FTMUSDTHello my dear friends
I hope we will have a profitable week together (:
Considering the specified ranges and the ascending wedge pattern at the end of the upward trend and the negative divergence of RSI, it seems that the possibility of correction to the blue range of $0.2657 is not out of mind.
Please keep in mind that if you want to trade with this analysis, you must place the loss limit above the blue range, for us the priority is the range, not the technical pattern.
We would be happy to hear your comments

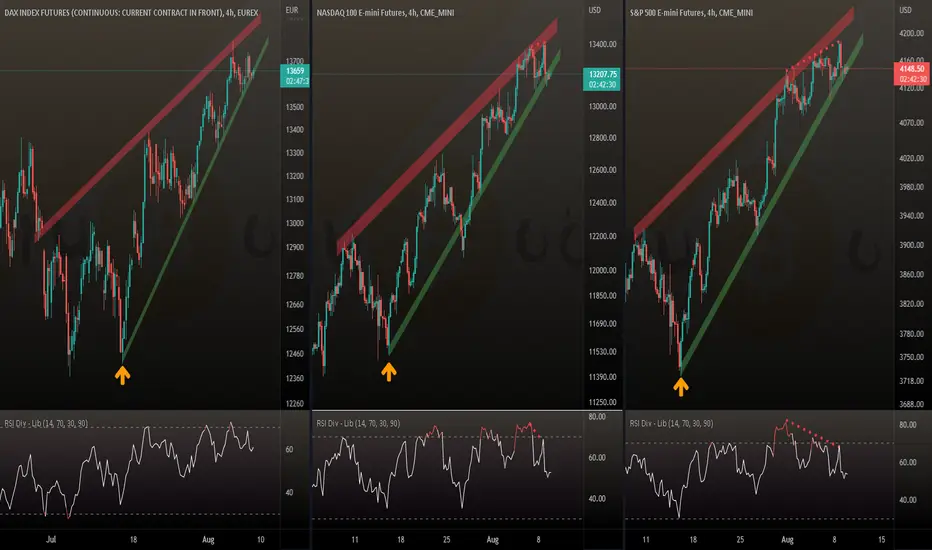
DAX SPX Nasdaq - some rising wedges - some bearish divergencesDAX SPX Nasdaq - some rising wedges - some bearish divergences
Not a really bullish cocktail at all - all indices at the critical support line a the moment
Some hours of trues dear Crypto Nation? But I can't imagine a real direction decision before tomorrows CPI announcement
Will keep you updated - still nothing happened yet
*not financial advice
do your own research before investing
falling wedge enter at bottom or after breakoutfalling wedge enter at bottom or after breakout..The Leading E-commerce Platform in Africa

BNB rising wedge #BNB/USDT
$BNB is above lower line of rising wedge.
The same scenario of #BTC!
🐻 break down from lower line will drop price to support zone.
🐮 rejection from lower line of this pattern will increase price to upper line and maybe resistance zone.

ENJUSDTHello my dear friends
According to the negative divergence of RSA, if the price range of $0.573 is completely consumed, then the probability of reaction to the yellow area ($0.697) is high.
From the yellow area, we expect the formation of a corrective trend up to the range of $0.515 and $0.418.
We would be happy to hear your comments.

META "Triple Bottom" Inside "Falling Wedge" Pattern
Patterns Identified- "Triple Bottom" inside "Falling Wedge" pattern
Bottom to neckline measurement is approx. 17.89! The measurement for the wedge from its lowest low and highest high is approx. 198.46.
My entry will be just above the break of the neckline at 172. I will use a stop loss which I won't disclose on this forum. Profit taking areas will also be set prior to placing the trade.
Follow my channel for more trading ideas and to share your trade ideas with me.
*This is not financial advice.
Loved & Blessed,
MrALtrades00
