CVCUSDT is trying to breakout from the weekly resistance 🦐CVCUSDT is trying to breakout from the weekly resistance after had a nice breakout from the falling wedge.
The price could test 0.382 Fibonacci retracement of Weekly impulse, retest weekly support, and restart with a new bullish impulse. According to Plancton's strategy, we can set a nice order
–––––
Follow the Shrimp 🦐
Keep in mind.
🟣 Purple structure -> Monthly structure.
🔴 Red structure -> Weekly structure.
🔵 Blue structure -> Daily structure.
🟡 Yellow structure -> 4h structure.
⚫️ Black structure -> <4h structure.
Here is the Plancton0618 technical analysis, please comment below if you have any question.
The ENTRY in the market will be taken only if the condition of the Plancton0618 strategy will trigger.
Wedgepatterns

LINKUSDT is inside falling wedge 🦐LINKUSDT is inside a falling wedge after the price broke daily ascending channel. If the price will have a breakout upwards and retest the previous daily resistance as new support, we can look for a long, otherwise, if the price will break the wedge downside, According to Plancton's strategy (check our Academy), we can set a nice order
–––––
Follow the Shrimp 🦐
Keep in mind.
🟣 Purple structure -> Monthly structure.
🔴 Red structure -> Weekly structure.
🔵 Blue structure -> Daily structure.
🟡 Yellow structure -> 4h structure.
⚫️ Black structure -> <4h structure.
Here is the Plancton0618 technical analysis, please comment below if you have any question.
The ENTRY in the market will be taken only if the condition of the Plancton0618 strategy will trigger.

QKCBTC is inside a huge descending wedge 🦐QKCBTC is inside a huge descending wedge and the price is trying to have a breakout. IF the price will have a breakout upwards and turn the current resistance into new support, According to Plancton's strategy (check our Academy), we can set a nice order
–––––
Follow the Shrimp 🦐
Keep in mind.
🟣 Purple structure -> Monthly structure.
🔴 Red structure -> Weekly structure.
🔵 Blue structure -> Daily structure.
🟡 Yellow structure -> 4h structure.
⚫️ Black structure -> <4h structure.
Here is the Plancton0618 technical analysis, please comment below if you have any question.
The ENTRY in the market will be taken only if the condition of the Plancton0618 strategy will trigger.

MAXR short term levels To watchI see a short term wedge forming. Hoping we have a break to the upside soon. I drew a support line to watch if it starts going down.

DESCENDING WEDGE ON EURNZD 4HR price is currently holding off the 1.69800 institutional price level after making three touches on the level. i'm anticipating price to break through that level and surge upwards to end the week. price is currently printing indecisive candlesticks. i'll be monitoring for a BUY setup next week.

GBPUSD is inside a rising wedgeGBPUSD is inside a rising wedge, and the price is testing the monthly structure.
We can expect a breakout downwards, and we can looking for a short position ONLY IF the price will break the rising wedge.
–––––
Follow the Shrimp 🦐
Keep in mind.
🟣 Purple structure -> Monthly structure.
🔴 Red structure -> Weekly structure.
🔵 Blue structure -> Daily structure.
🟡 Yellow structure -> 4h structure.
⚫️ Black structure -> <4h structure.
Here is the Plancton0618 technical analysis, please comment below if you have any question.
The ENTRY in the market will be taken only if the condition of the Plancton0618 strategy will trigger.

BALBTC nice breakout the from falling wedge 🦐BALBTC nice breakout from the falling wedge, and now the price is trying to have a breakout from daily resistance.
IF the price will have a breakout and flip the previous resistance into new support, According to Plancton's strategy (check our Academy), we can set a nice order
–––––
Follow the Shrimp 🦐
Keep in mind.
🟣 Purple structure -> Monthly structure.
🔴 Red structure -> Weekly structure.
🔵 Blue structure -> Daily structure.
🟡 Yellow structure -> 4h structure.
⚫️ Black structure -> <4h structure.
Here is the Plancton0618 technical analysis, please comment below if you have any question.
The ENTRY in the market will be taken only if the condition of the Plancton0618 strategy will trigger.

QTUMUSDT Is trying to have a breakout 🦐QTUMUSDT Is trying to have a breakout from the falling wedge and daily resistance.
Be careful with ascending weekly trendline.
IF the price will have a breakout from the weekly trendline and flips into support, According to Plancton's strategy, we can set a nice order
Weekly
–––––
Follow the Shrimp 🦐
Keep in mind.
🟣 Purple structure -> Monthly structure.
🔴 Red structure -> Weekly structure.
🔵 Blue structure -> Daily structure.
🟡 Yellow structure -> 4h structure.
⚫️ Black structure -> <4h structure.
Here is the Plancton0618 technical analysis, please comment below if you have any question.
The ENTRY in the market will be taken only if the condition of the Plancton0618 strategy will trigger.

BTC/USD In Falling Wedge !!Hi every one
chart is speaking it self!!
As you can see, falling wedge is forming, which is not a good thing and could be a sign that the price is falling.
RSI also shows Bearish divergence well.
If the line above falling wedge is breaks, it is as if falling wedge does not exist and the price continues to grow.
Support level : 16200 to 15900
Things can change...
The markets are always changing and even with all these signals, the market changes tend to be strong and fast
Traders, if you liked this idea or have your opinion on it, write in the comments,We will be glad.
Thank you for seeing idea .
Have a nice day and Good luck.

PPTBTC is trying to have a breakout 🦐PPTBTC is trying to have a breakout From the weekly falling wedge. The price created an inverse head and shoulder on the daily chart and is trying to have a breakout from the neckline. IF the price will have a breakout and flips the neckline into daily support According to Plancton's strategy, we can set a nice order
–––––
Follow the Shrimp 🦐
Keep in mind.
🟣 Purple structure -> Monthly structure.
🔴 Red structure -> Weekly structure.
🔵 Blue structure -> Daily structure.
🟡 Yellow structure -> 4h structure.
⚫️ Black structure -> <4h structure.
Here is the Plancton0618 technical analysis, please comment below if you have any question.
The ENTRY in the market will be taken only if the condition of the Plancton0618 strategy will trigger.

ENJUSDT breakouts from the Falling wedge 🦐ENJUSDT breakouts from the Falling wedge and now the price is testing daily resistance.
IF the price closes above daily resistance, and flips into daily support, According to Plancton's strategy, we can set a nice order
–––––
Follow the Shrimp 🦐
Keep in mind.
🟣 Purple structure -> Monthly structure.
🔴 Red structure -> Weekly structure.
🔵 Blue structure -> Daily structure.
🟡 Yellow structure -> 4h structure.
⚫️ Black structure -> <4h structure.
Here is the Plancton0618 technical analysis, please comment below if you have any question.
The ENTRY in the market will be taken only if the condition of the Plancton0618 strategy will trigger.

REPUSDT is creating a falling wedge 🦐REPUSDT is creating a falling wedge, and now is testing the upper trendline and daily resistance, after the price bounced on weekly support.
IF the price will have a breakout upward, and flip daily resistance into support, According to Plancton's strategy, we can set a nice order
–––––
Follow the Shrimp 🦐
Keep in mind.
🟣 Purple structure -> Monthly structure.
🔴 Red structure -> Weekly structure.
🔵 Blue structure -> Daily structure.
🟡 Yellow structure -> 4h structure.
⚫️ Black structure -> <4h structure.
Here is the Plancton0618 technical analysis, please comment below if you have any question.
The ENTRY in the market will be taken only if the condition of the Plancton0618 strategy will trigger.

COCOSUSDT bounced on weekly structure 🦐COCOSUSDT bounced on the weekly structure and now the price is trying to have a breakout from the falling wedge.
IF the price will break the daily resistance and flips into support, According to Plancton's strategy, we can set a nice order
–––––
Follow the Shrimp 🦐
Keep in mind.
🟣 Purple structure -> Monthly structure.
🔴 Red structure -> Weekly structure.
🔵 Blue structure -> Daily structure.
🟡 Yellow structure -> 4h structure.
⚫️ Black structure -> <4h structure.
Here is the Plancton0618 technical analysis, please comment below if you have any question.
The ENTRY in the market will be taken only if the condition of the Plancton0618 strategy will trigger.

FET +40% Wedge Breakout Swing Opportunity on Daily ChartWe are now at the apex of a large wedge forming on FET since June '20. Breakout spot is over 0.62. Wait for high relative volume + confirmation of breakout.
Target 1: daily resistance at 0.72
Target 2: 200 ema on daily chart
Target 3: $1.00 major resistance

ADAUSDT created a rising wedge 🦐ADAUSDT created a rising wedge, and now the price is testing weekly resistance.
IF the price will lose the daily support and turns it into resistance, According to Plancton's strategy, we can set a nice order
–––––
Follow the Shrimp 🦐
Keep in mind.
🟣 Purple structure -> Monthly structure.
🔴 Red structure -> Weekly structure.
🔵 Blue structure -> Daily structure.
🟡 Yellow structure -> 4h structure.
⚫️ Black structure -> <4h structure.
Here is the Plancton0618 technical analysis, please comment below if you have any question.
The ENTRY in the market will be taken only if the condition of the Plancton0618 strategy will trigger.

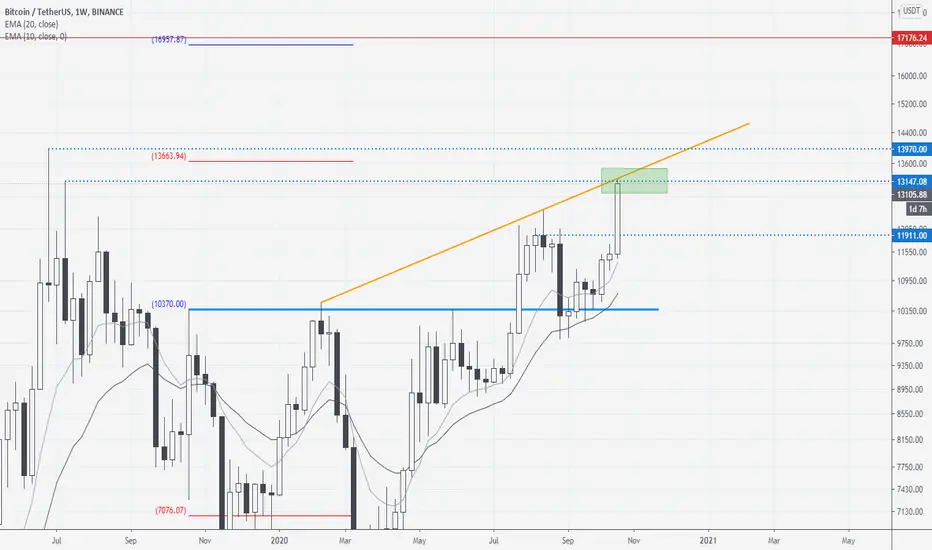
BTCUSDT bulls testing a confluence resistance level: 13,150Current rally is at a confluence of resistance represented by the intersection of July 2019 high (horizontal resistance) and wedge trend line resistance from the February 2020 high.
There may be enough momentum to break above this level but caution is advised given there are always risks of false breaks. Let's see how the markets navigate these levels in the coming sessions.
BATUSDT bounce on weekly support 🦐BATUSDT bounce on weekly support and now the price is trying to have a breakout from the falling wedge.
IF the price will break the current daily resistance and turn it into support, According to Plancton's strategy, we can set a nice order
–––––
Follow the Shrimp 🦐
Keep in mind.
🟣 Purple structure -> Monthly structure.
🔴 Red structure -> Weekly structure.
🔵 Blue structure -> Daily structure.
🟡 Yellow structure -> 4h structure.
⚫️ Black structure -> <4h structure.
Here is the Plancton0618 technical analysis, please comment below if you have any question.
The ENTRY in the market will be taken only if the condition of the Plancton0618 strategy will trigger.

RSRBTC nice breakout from descending wedge! 🦐RSRBTC nice breakout from descending wedge, and now the price is testing daily resistance.
IF the price will break the resistance and flip it as support According to Plancton's strategy, we can set a nice order
–––––
Follow the Shrimp 🦐
Keep in mind.
🟣 Purple structure -> Monthly structure.
🔴 Red structure -> Weekly structure.
🔵 Blue structure -> Daily structure.
🟡 Yellow structure -> 4h structure.
⚫️ Black structure -> >4h structure.
Here is the Plancton0618 technical analysis, please comment below if you have any question.
The ENTRY in the market will be taken only if the condition of the Plancton0618 strategy will trigger.

MATICUSDT is inside a descending channel and falling wedge 🦐MATICUSDT is inside a descending channel and falling wedge. The price is testing again weekly (and very important) structure.
IF the price will lose weekly support we can see a new bearish impulse.
IF the price will break the falling wedge and turns the daily resistance as support According to Plancton's strategy, we can set a nice order
Weekly
Monthly
–––––
Follow the Shrimp 🦐
Keep in mind.
🟣 Purple structure -> Monthly structure.
🔴 Red structure -> Weekly structure.
🔵 Blue structure -> Daily structure.
🟡 Yellow structure -> 4h structure.
⚫️ Black structure -> >4h structure.
Here is the Plancton0618 technical analysis, please comment below if you have any question.
The ENTRY in the market will be taken only if the condition of the Plancton0618 strategy will trigger.

OAXBTC Nice breakout from the falling wedge 🦐OAXBTC Nice breakout from the falling wedge, and now the price is testing daily resistance.
IF the price will break the resistance and turns it into new support According to Plancton's strategy, we can set a nice order
–––––
Follow the Shrimp 🦐
Keep in mind.
🟣 Purple structure -> Monthly structure.
🔴 Red structure -> Weekly structure.
🔵 Blue structure -> Daily structure.
🟡 Yellow structure -> 4h structure.
⚫️ Black structure -> <4h structure.
Here is the Plancton0618 technical analysis, please comment below if you have any question.
The ENTRY in the market will be taken only if the condition of the Plancton0618 strategy will trigger.

QKCBTC is inside a huge descending wedge 🦐QKCBTC is inside a huge descending wedge and the price created a double bottom on daily support.
IF and only IF the price gains bullish momentum and will break recent daily resistance and the wedge, According to Plancton's strategy, we can set a nice order
–––––
Follow the Shrimp 🦐
Keep in mind.
🟣 Purple structure -> Monthly structure.
🔴 Red structure -> Weekly structure.
🔵 Blue structure -> Daily structure.
🟡 Yellow structure -> 4h structure.
⚫️ Black structure -> >4h structure.
Here is the Plancton0618 technical analysis, please comment below if you have any question.
The ENTRY in the market will be taken only if the condition of the Plancton0618 strategy will trigger.

CLSK +18% Wedge Breakout Swing Opportunity on Daily ChartCLSK swing trade setting up. First target just below $15. Over $15 room to ~$17.50-18 on daily chart. Wait for break of $12.50 with high relative volume to trigger entry.

BTC | which way we are going...?11 October seems to be an important date to decide if we go further up... or down....
