$PLUG - Long Term Swing Trade - Falling Wedge SetupNASDAQ:PLUG
Wedging since 2021!!!
TPs at each fib level but ultimately swing to ~$48
Push Play Enjoy -- This is charted not in LOG scale
Wedgepatterns

Bullish Falling Wedge Pattern Forming on $UPWKHey Traders! Today, I want to share an exciting technical analysis discovery I made on the stock of Upwork Inc. ( NASDAQ:UPWK ). It seems that a bullish falling wedge pattern is forming, indicating a potential reversal in the near future. Let's dive into the details!
📈 Ticker: NASDAQ:UPWK
📅 Timeframe: Daily Chart
📊 Pattern: Falling Wedge
📉 What is a Falling Wedge?
A falling wedge is a bullish chart pattern characterized by a contracting range between two downward sloping trendlines. It typically forms during a downtrend and signifies a potential bullish reversal. This pattern suggests that the selling pressure is diminishing, and buyers may soon regain control, driving the price higher.
🔍 Identifying the Falling Wedge on NASDAQ:UPWK :
By analyzing the daily chart of NASDAQ:UPWK , we can observe the following:
1️⃣ A clear downtrend in the stock's price over the past few weeks.
2️⃣ Two converging trendlines: The upper trendline connects the lower highs, while the lower trendline connects the lower lows.
3️⃣ Decreasing trading volume as the pattern develops, indicating a decline in selling pressure.
📈 Price Targets and Trading Strategy:
If the falling wedge pattern plays out as anticipated, we can expect a potential bullish breakout above the upper trendline. This breakout could trigger a bullish rally, possibly reaching the following price targets:
1️⃣ Target 1: Resistance level near $40.00
2️⃣ Target 2: Psychological resistance level near $45.00
🛡️ Risk Management:
As with any trading strategy, it is essential to manage risk effectively. Consider implementing the following risk management techniques:
1️⃣ Set a stop-loss order below the lower trendline to protect against unexpected price movements.
2️⃣ Adjust position size according to your risk tolerance and overall portfolio management strategy.
🔔 Conclusion:
Keep an eye on Upwork Inc. ( NASDAQ:UPWK ) as it develops this falling wedge pattern. The formation suggests a potential bullish reversal in the near future. However, remember that technical analysis is not foolproof, and market conditions can change rapidly. Combine this analysis with other relevant factors before making any trading decisions.
Disclaimer: This post is for informational purposes only and should not be considered as financial advice. Always do your own research and consult with a qualified financial professional before making any investment decisions.
Happy Trading! 📈💰
#TechnicalAnalysis #FallingWedgePattern #UPWK #BullishReversal #TradingView

Ready to add $NKENYSE:NKE is ready to rebound (20%), if you want to add to your portafolio, this is the time!
ok NYSE:NKE , just do it!
Previous Pattern Targets vs. Possible Path Back to Top or BottomHBAR made two major wedge patterns that hit pattern targets with incredible accuracy.
First - a bullish wedge exit that led to a 3x measured move up and a final wick up that ultimately stopped approx. halfway between 3.5x and 4x.
Second - a bearish wedge exit that has so far reached a 2x measured move down from where it exited.
Let's see if it makes a 3rd wedge that, when exited in either direction, may revisit weekly top or hit all-time low on a 2x measured move in either scenario; potentially creating a double-top or a double-bottom at its completion.

Power Finance CorporationHello & Welcome to this analysis
It is now approaching a bearish Harmonic ABCD and it that process also forming a rising wedge suggesting some profit taking might come in.
In the short term stock has support at 175-165 and below that near 150 where medium to long term investors would come in. It has resistance around 184-187, if it manages to breach above it then next resistance is near 210.
Overall medium to long term has strong upside potential and could be a strong SIP candidate.
Happy Investing

CAT idea long wedgeWedge formed, looking for some retest of previous levels.
Especially if overall market strength continues to go as it has currently been going.
If it breaks down, I don't see CAT going much lower.

Oil is shaping to a bearish wedge pattern.Hi, I can see a wedge in the Oil 4H time frame. The entry level is between 74.20-74.8. You can set your stop loss at 75.1 and your target for this pattern should be at 71, 70.1 and 69. It's better to wait and watch for price consolidation at the entry point before entering the trade.

AMD WedgeNASDAQ:AMD creating a wedge on the one hour time frame. This indicates that NASDAQ:AMD is going to have a small pull back. When it hits the bottom of the wedge, then that may be another great entry point to enter. From the bottom of the wedge, if it doesn't break out downwards, then it may be the last element needed to push up to the 2 price targets.

ABFRL POSSIBLE WAVE COUNTS - ADITYA BIRLA FASHION AND RETAILHello Friends,
Today I am sharing my view on Aditya Birla Fashion And Retail Limited.
ABFRL is now ready for new long positions as per Elliot Wave structure.
It is suppose to complete WAVE ABC as Expanded Flat Correction which usually comes in 3-3-5 waves.
Now price is in 5th wave of corrective wave ABC which any time get reversal from downtrend to uptrend.
MACD showing strength as price is making lower low but macd makiing higher low
similar Scenario with RSI
confirmation of reversal
One can make new long positions in ABFRL after the breakout of wedge pattern.
Disclaimer
I am not SEBI registered analyst.
all the studies are for educational purposes.
I am not responsible for any kind of your profits and losses.

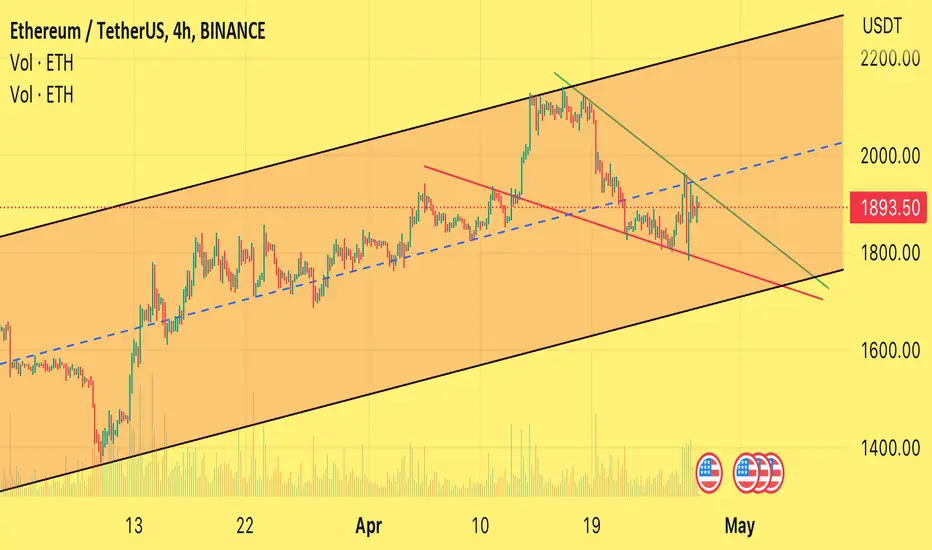
📈Ethereum fake bullish scenario📉BINANCE:ETHUSDT
COINBASE:ETHUSD
Hey everyone, first take a look at my previous analysis and positions.
Along with the analysis of Bitcoin, Ethereum can also continue its upward trend up to the stop-hunt range if the price stays above the 1854 level.
Consider the impact of the ADP Employment Change & ISM Services PMI & Fed Interest Rate Decision.
5.25% or even lower can pump Btc and Eth.
Please share ideas and leave a comment,1
let me know what's your idea.
CrazyS✌

FINAL WEDGE PATTERN/CADCHFTECHNICAL : as we can see, CADCHF reach a new demand zone and bounce from that level . in my opinion CADCHF makes a final wedge structure !
FUNDAMENTAL : According to financial reports Bot , Unemployment Rate and Inflation Rate of CANADA are improving.
so wait for breakout and then open a long position .

$3K DROP: WAVE V of (V) of ((a)) to target area 27558 - 27330!!!BITCOIN is going down in a corrective (X) wave of sub-millennium degree, and is being divided into waves ((a)),((b)), and ((c)). This WAVE 4 (divided into a WXYXZ correction and please notice the rising wedge) retraced almost 100% of WAVE 3, and now BITCOIN is about to DROP $3k again into a WAVE 5. BITCOIN is heading to a very significant PIVOT POINT which is the end of WAVE 5 of V of (V) of ((a)). Then is UP in a WAVE ((b)) of (X)!!!

Rising Wedge and a double top following earningsApple is up by more than 4% today following its earning report.
The stock is testing previous highs and also the top of a rising wedge pattern.
This could be an interesting resistance zone to monitor if you are looking for a contrarian bearish trade

BTC/USD Monthly Chart - Volume POC AnalysisBTC/USD Volume Analysis - Bitstamp 1 month chart.
BTC is still in a massive Ichimoku Y-Wave Pattern, which is like a western Broadening Wedge Pattern.
BTC is also in a massive Ichimoku P-Wave Pattern, which is like a western Symmetrical Triangle or Pennant.
BTC is also in a massive Rising Wedge Pattern.
I have also added in various Support and Resistance lines on this chart as highlighted by the thin dotted straight white lines.
Here is a closer look at this Bitstamp monthly chart:
At the moment of typing this, BTC is still being hampered by its Key Resistance Area located with the dotted straight white lines with yellow shading.
Note that on the month of 1st Feb 2023, BTC broke out of its Falling Wedge Pattern and successfully re-tested it as support, 1st on the month staring 1st Feb 2023 and 2nd on the month starting 1st Mar 2023.
Looking at the Bollinger Bands we can see that the price is still under its Bollinger Bands Middle Band Basis 20 Period SMA on this month chart. Note that the Lower Band has started to curve back around straight.
I have added a few FRVP (Fixed Range Volume Profile) indicators to every group of 3 one month candles on this visible chart, you can clearly see the various Points of Control (POC) for all those 3x one month candles which are indicated by the straight white line on each 3 month FRVP indicators. Looking at the month starting 1st Feb 2021, we can see that our Point of Control (POC) for those 3x one month candles is located at our UPPER Resistance/Support line of our Key Area of Resistance. If we look at the month starting 1st May 2022, we can see that our Point of Control (POC) for those 3x one month candles is located at out LOWER Resistance/Support line of our Key Area of Resistance.
Looking at the Visible Range Volume Profile (VRVP), we can see where the Point of Control (POC) is for this charts Visible Range as highlighted by the Dashed straight white line.
Looking at the Volume on this Bitstamp 1 month chart, we can see that this month’s Volume Bar ended above its 20 Period Moving Average.
If we take a look at the Moving Average Convergence Divergence (MACD) we can see that the Red Histograms have consistently degreased in size since Sept 2022. The MACD Line (Blue Line) is indicating momentum is upwards and the MACD Line looks very likely to cross back ABOVE the Signal Line (Orange Line) on this monthly chart. If/when the MACD Line (Blue Line) crosses back above the Signal Line (Orange Line) it will create a new Green Histograms and a buy signal on this monthly chart for this indicator. When that happens it will be the first new Green Histogram since the month of 1st Dec 2021.
Looking at the Up/Down Volume Indicator for this Bitstamp chart, we can see the difference between the buyers and sellers as indicated by the Delta Line in the Volume Bars. Note that this useful indicator takes into account the whole Candle Wick so the full Open and Close price and not just the Body of the Candle.
If we take a look at the Average Directional Index (ADX DI) we can see that the Trend Strength hasn’t turned upwards yet with the ADX (Yellow Line) at 21.11 and note the DAX Line is still under its 9 Period EMA (White Line) which is at 26.34. Positive Momentum is sideways at the moment with the +DI (Green Line) at 22.05 and Negative Momentum is also sideways at the moment with the -DI (Red Line) at 19.06. A good sign to look out for on this indicator is when the ADX (Yellow Line) starts moving upwards and an eventually cross back ABOVE its 9 Period EMA (White Line) as well as an upwards trajectory for the +DI (Green Line) and a downwards trajectory for the -DI (Red Line) diverging apart form each other on this 1 month chart.
As stated in my previous BTC post, the Price needs to successfully CLOSE ABOVE its Key Resistance Area and turn that area into Strong Support. So it seems there might be very interesting times ahead for BTC and the whole Crypto market, especially if we get a Buy Signal on the MACD Indicator if/when the MACD Line (Blue Line) crossing back ABOVE the Signal Line (Orange Line) on this 1 month chart.
I hope this post is helpful.

Eth falling wedge and ascending channel Eth is consolidating in ascending channel and falling wedge. It will stay in this range for some days. Btc will pump more than Eth these days. It’s not ETH time.
NIFTY WAS DESTINED TO GO UPWARDS TODAY - 27/04/23
nifty had taken support twice from a very strong resistance zone formed since the last 2 days after the market opening today
nifty had formed an ascending wedge pattern since yesterday which was broken out later in the day and consequently nifty went upwards by the same amount as the width of the wedge

Wealth Unleashed: Wedge Pattern Power - Hidden Gem Revealed!Introduction:
Are you looking to skyrocket your trading profits? Look no further! Today, we will uncover the hidden gem of trading patterns: the Wedge Pattern. This powerful tool has the potential to transform your trading strategy and help you achieve financial success. Let's dive into the world of wedge patterns and explore how you can capitalize on their power.
What are Wedge Patterns?
Wedge patterns are popular among traders due to their high probability of forecasting trend reversals. These patterns appear when the price of an asset consolidates between converging support and resistance lines. There are two primary types of wedge patterns: the rising wedge and the falling wedge.
Rising Wedge:
In an upward trend, the rising wedge is considered a bearish pattern. It forms when the price consolidates between an upward-sloping support line and an upward-sloping resistance line that are converging. As the price approaches the apex of the wedge, the upward momentum weakens, signaling a potential trend reversal to the downside.
Falling Wedge:
Contrary to the rising wedge, the falling wedge is a bullish pattern. It appears in a downward trend when the price consolidates between a downward-sloping support line and a downward-sloping resistance line that are converging. As the price nears the apex of the wedge, the downward momentum loses strength, indicating a possible trend reversal to the upside.
Trading Strategies:
To capitalize on the power of wedge patterns, follow these steps:
✅Identify the pattern: Observe the chart for converging support and resistance lines to spot a rising or falling wedge pattern.
✅Confirmation: Wait for a breakout from the wedge pattern, either above the resistance line (for falling wedges) or below the support line (for rising wedges).
✅Entry point: Open a long position after a breakout above the resistance line in a falling wedge, or a short position after a breakout below the support line in a rising wedge.
✅Stop-loss and take-profit: Set your stop-loss order below the breakout level (for falling wedges) or above the breakout level (for rising wedges). Establish your take-profit target at a level that aligns with your risk-reward ratio and trading plan.
Conclusion:
The wedge pattern is a hidden gem that can potentially boost your trading profits when used correctly. By mastering the art of identifying and trading wedge patterns, you can strengthen your technical analysis skills and increase your chances of success in the market. Remember, no single tool guarantees success, so always use additional technical indicators and maintain a disciplined approach to risk management. Happy trading!

W9.1-28 ADA BEARISH IDEA (RISING EDGE)Potential Bearish Entry
Dow Theory In Place - Lower High and Lower Low Expected in Place
Formation of Rising wedge coupled with bearish divergence (Bearish reversal pattern)
SL & TP Levels are defined.

DXY potential moveDXY is having bearish trend in general while creating descending broadening wedge in 1H timeframe.
I am predicting two scenarios:
1. DXY will move upward temporarily to 102 and continue to go to 100.5
2. DXY will have reversal to break the resistance of the descending broadening wedge and continue to reach 104 (Fibonacci retracement 1.618)

$DXY #USD is in a bearish wedge Watching the TVC:DXY and the USD losing strength with #BRICS backing their currencies with #gold

#Nifty #USDINR Strong supply aheadBank nifty is out of wedge pattern but faces strong supply ahead
Looks like it will reverse and retest the wedge support

NASDAQ TO CONTINUE BEING BULLISHGOOD day traders nex week i will be looking at NASDAQ, what i am expecting is the market to give us a pullback after hitting our TP1 hopefully the pullback will lead us to the to the third touch of our wegde pattern so that we can join the trend by executing our buy trades.

GBPUSD, H4 - Wedge patternPrice forms wedge pattern that in most cases ends current trend. So possible some corrective move to the downside. Breakdown of the support level at ca. 1.2280 would be additional confirmation of this scenario. Target fot shorts can be round level 1.2200. Trade carefully!
