Weeklyanalysis

EUR/USD Going short on Hexagon&Triangle patterns Weekly Analysis- EUR/USD Going short after a quick correction
- Hexagon&Triangle patterns
- Weekly Analysis
- EUR/USD Weekly expectaions

USOIL - Few Dollars to Gain - OptionsSo looking at the weekly Oil is in tough spot and potentially may enter a sideways trading zone. However, I could see it bouncing around $19-20 then to $22 and back down in that area. So if this becomes true scalping and or option right now may work.
Upside is if oil news breaks it won't matter what resistance is there.

Respect of Trendline Indicates Bears Are Still In ControlUhhhh yeah, I don't see any bullish anything happening here. On none of the higher timeframes. A just in case bull move was shared anywho. Trendline was respected to continue to bearish move to the southside. This is gonna be a good ride. So will trade accordingly.
BEAR TPS:
• 1.73132
• 1.72943
• 1.71354
BULL TPS:
• 1.75772
• 1.76611
• 1.77635

Harmonic With Consolidation Means A Bullish Setup Happening?Beautiful trade setup happening here.
We got a harmonic.
We got a multi-day consolidation.
And we're on a daily key level.
This is gonna be AMAZING!!
Looking forward to collecting pips from this pair.
BULL TPS:
• 1.53709
• 1.54582
• 1.54626
• 1.56354
BEAR TPS:
• 1.52140
• 1.50998
• 1.49809

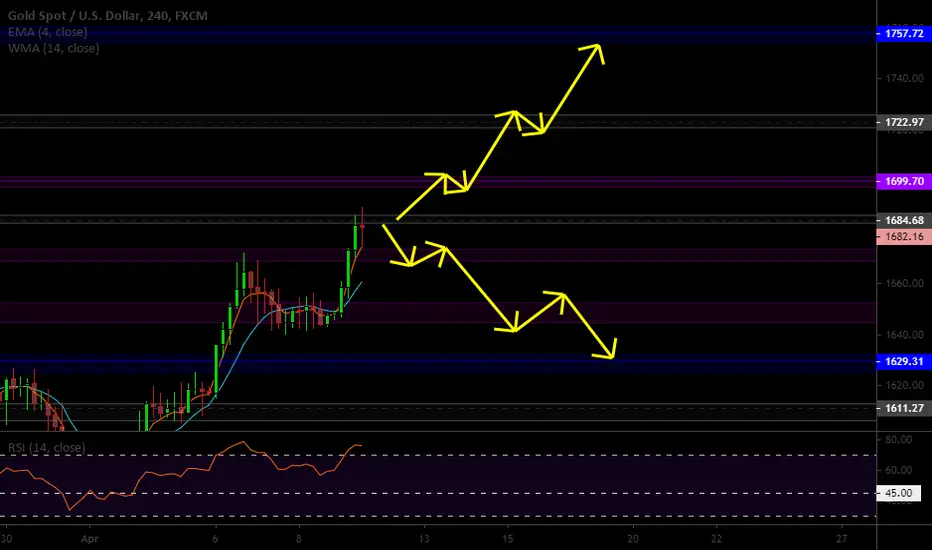
Pullback Setup In Place Or Will it Be a Change In Direction?Nice doji setup on the 4hr. And price looks like it's running out of steam and this may be due for a pullback this week. Will it return to the weekly resistance at 1757.52 area, or will it drop back down at least to the weekly level at 1629.31. We’ll see.
BEAR TPS:
• 1668.80
• 1652.46
• 1632.23
BULL TPS:
• 1697.70
• 1720.94
• 1754.14
Bearish Continuation LikelyBoth this pair and EURCAD will be bearish as long as the Canadian dollar continues to show strength. Here are the TPs for both. My aim is for it to be bearish. But I move where the market moves.
BEAR TPS:
• 1.73132
• 1.71867
• 1.71354
• 1.69933
BULL TPS:
• 1.74523
• 1.75927
• 1.76611
• 1.77635

Can Remain Bullish If CAD Stays StrongBoth this pair and GBPAD will be bearish as long as the Canadian dollar continues to show strength. Here are the TPs for both. My aim is for it to be bearish. But you I move where the market moves.
BEAR TPS:
• 1.52947
• 1.52680
• 1.50998
• 1.49798
BULL TPS:
• 1.53960
• 1.54582
• 1.55656
• 1.56602

Weekly Analaysis for 15/2020 by Soinc Prime Analysis Gold, Sliver, WTI, USDCAD and EURGBP anslysis .
Good Luck for you all .

New Weekly Analysis for BTCUSD
Price in trading range between $5800 and $6800 based on long-term horizontal levels.
Ichimoku cloud becomes thin in July and August creating opportunity to break above all-time resistance at that point.
Cautious on long-term view for now.

EUR/JPY SELL SIGNALHey tradomaniacs,
welcome to another free trade-plan.
Important: This is meant to be a preparation for you. As always we will have to wait for a breakout and confirmation.
Market Sell: 120,000
Stop-loss: 121,085
Target 1: 119,250
Target 2: 118,600
Target 3: 117,760
LEAVE A LIKE AND A COMMENT - I appreciate every support! =)
Peace and good trades
Irasor
Wanna see more? Don`t forget to follow me.
Any questions? PM me. :-)

EUR/USD SELL SIGNALHey tradomaniacs,
welcome to another free trade-plan.
This is meant to be a preparation for you guys.
We will obviously have to wait for a confirmation before we execute a short-trade.
Market Sell: 1,11500
Stop-loss: 1,12300
Target 1: 1,11300
Target 2: 1,09850
Target 3: 1,08875
Target 4: 1,08015
--------------------------------------------------------------------------------
LEAVE A LIKE AND A COMMENT - I appreciate every support! =)
Peace and good trades
Irasor
Wanna see more? Don`t forget to follow me.
Any questions? PM me. :-)

EURJPY SHORT SET UPEURJPY made a strong push upwards and is at a strong resistance level.
I am expecting a fall to tp 1 and tp 2 ….tp 3 is open trail profits from there.

BTC update! What's next???These past few weeks has been really bearish! The C&H pattern did not hold, and we broke down (see previous post). This break down started a very steep decline in price.
In the chart above we can see BTC dropped almost 53% towards 3800 ~ 3900 USD. It broke right through the 100 and 200 weekly MA. There BTC got a lot of support from a high volume node, before bouncing back above the large yellow trendline. Currently, BTC is hanging at the 200 weekly MA combined with the 0.786 FIB level. BTC never closed below the 200 weekly MA. If it does close below, we could be in for a far bigger decline than we experience the last few weeks. The coming hours are very important!
A close above would confirm the strong support at the 200 weekly MA, and probably result in a longer consolidation/sideway movement. The CHOP index needs to recover and prepare for a next big move. If this happens, we need to keep an eye on the smaller timeframes, because all smaller timeframes are in a downtrend as well. Changes start from the inside out. Uptrend on the smaller timeframes will translate in an uptrend in the larger timeframe.
Until we close the weekly chart, I wouldn't recommend taking any long or short position. We need a confirmation first! If we consolidate, look for an upward or downward channel to trade. If we close below, I'll short from 5000 USD with a price target of 3900 USD (high volume node support).
Stay safe and focus on price. Don't let news headline blur your view!

The week results: the epidemic & the Friday bloodbathThe past week has so far been considered the most eventful of the last few months. And the point is not even in the number of new events that took place, but in the price dynamics in the financial markets. One of the strongest drops in the US stock market in history (during the week Nasdaq lost up to 15% of its capitalization), the Fear Index grew almost three times, the oil decreased by almost 20%.
The culmination was a natural "blood bath", which was arranged by traders in the financial markets on Friday, when, for example, gold was reduced by $80 during the day.
How did markets get to such a life? We wrote about this quite actively for more than six months and now we are faced with the results of those temporary bombs that were planted.
Epidemic coronavirus is still able to be a "black swan", which freed all the energy that accumulated markets. More precisely, not all, because it is still only in the process of development.
The main event of the past week - the coronavirus epidemic ceased to be a local problem in China and became a global disaster (the number of newly diagnosed cases outside China steadily exceeded the number of cases in China). It was after this that investors became completely scared.
And if the week began with the fact that the problems were in South Korea, Japan, Italy, and Iran, then it ended with a radical expansion of the list. Now it has the USA, France, Germany, Spain, Great Britain, Singapore, Malaysia, Kuwait, Bahrain, and many others. The total number of cases in the world over the week has grown significantly and has already exceeded 7,000.
Naturally, now no one has any doubts that the world economy will suffer and will suffer very much. Out of habit, everyone turned their eyes to the Central Banks, which have recently been playing the role of traditional savers of the economy.
Fed Chairman Powell said at the end of last week that the US Central Bank is ready to act. Accordingly, the markets instantly rebuilt their expectations and now assess the probability of a rate cut in March at 100%. Typically, 95% of traders expect a decline of 0.5%. So the problems of the dollar on Thursday and Friday are generally understandable. One side. On the other hand, other central banks, in particular the ECB, may also lower rates.
Thus, we continue to consider the growth of the EURUSD pair abnormal and this week will be very active in selling the euro against the US dollar. Not forgetting, of course, about the feet.
In general, in the current conditions, when the most terrible volatility has increased many times, a trader can do it - work without stops and try to impose his will on the market. So we’ll definitely put the stops - it’s better to re-enter the position when the dust settles, rather than stand against the market and lose the deposit in one day, essentially out of the blue.
What else do we plan to do this week? Definitely buy gold and at the same time buy a pair of USDJPY. It’s a kind of under-hedge on safe-haven assets that did absolutely nothing on Friday, but we believe that the markets will return to some semblance of rationality and this hedge will work.
This week, we are inclined to start buying oil, because a) the achievement of the $ 44 mark for the WTI brand corresponds to our goals, which we announced when it was still in the region of $ 60; b) OPEC is seriously concerned about what is happening, and this week there will be a meeting within the framework of which amendments may be made to the OPEC+ agreement - they announce an additional reduction in oil production by 1 million BPD. It is very serious. But again, these purchases are a rather risky attempt to catch a U-turn, which is not yet available. So we advise fans to take risks, do not forget about the stops, and we recommend that conservative traders put the oil trade on hold or at least wait until the end of the week and OPEC's decision.

USDCAD W8 OutlookCurrently Trading in a 4H channel
We can expect a brief test of 1.3200 level before reversing back to test the 1.3250 level and then resuming the downtrend to 1.3150 and eventually hitting 1.3100 in early March.

Week Results: Virus, NFP, Pound & Investor ConcernsA week in the financial markets was held in the chronicles of the coronavirus. The epidemic is still under development. The number of deaths exceeded 700, and the number of deaths approached 40,000. A number of quarantined cities in China, many plants are idle, are already starting to disrupt the functioning of the global economy: some companies outside of China cannot continue the production process, since components from China do not arrive, some ( like Toyota and Honda) temporarily shut down their Chinese capacities and sharply lose in production volumes, some (like Apple) close their stores in China.
And if on Monday and Tuesday last week, the markets still tried to pretend that they did not notice this, then towards the end of the week even excellent NFP figures could not inspire American investors to buy on the stock market.
And although the VIX Fear Index fell by 15% over the week, there is a feeling that the time of unbridled euphoria in financial markets is coming to an end. And this means that now is the time to start opening short against risky assets. Moreover, the markets marked the highs, respectively, the points for placing stops are obvious, and the stops themselves are small especially with respect to the goals that can and should be set.
The week as a whole turned out to be very successful for the dollar and ended on a major note: NFP figures came out well above market expectations (+225K with a forecast of +165K). In principle, employment data from ADP (+291K) were prepared by the markets for good numbers, but until the very last it was difficult to believe in them. The overall view was somewhat spoiled by weaker than expected growth rates of hourly wages, as well as unemployment, which went above forecasts.
The main losers in the foreign exchange market were the euro and the pound. Traditionally, the reason for the sale of the euro was the weak macroeconomic statistics from the Eurozone. So German industrial production in December literally collapsed by 3.5% during a month, recalling that the recession is not just an economic term, but also one of the aspects of reality. As for the pound, the pressure on it was due to growing fears that the UK and the EU would not be able to agree on a trade agreement until the end of 2020.
Our trading plan for this week is next. We continue to look for points for purchases of gold and the Japanese yen anyway (unless an ultra-effective vaccine is found and the epidemic of coronavirus is quickly over). We will wait until the euphoria around the dollar subsides, and we will look for points for its sales. The pound is not bad, the Canadian dollar looks interesting. We won’t touch the euro - the single European currency seems too toxic in the light of the latest data from Germany. While oil is below 51.20 (WTI benchmark) - we sell it with stop-flips above 52. In general, the situation with oil looks rather uncertain. OPEC +’s decision to expand the decline in oil production by 600K bd is, under normal conditions, the strongest bullish signal.

GWO Double Bottom 200SMA GWO has recently passed the 200MA on the weekly chart signalling a strong reversal in the price trend from bearish to bullish. after price showed a double bottom reversal, the price rebounded to break the resistance and cross over the 200SMA indicating a strong bullish trend. Price showed a similar pattern of a double bottom reversal crossing the 200MA in late 2011/early 2012 leading to a strong rally seeing the price increase almost 50% after breaking the resistance. the price target is 45-47.50 (35%)

NZDCAD week sell signal op [120pips]
ENTRY: 0.85650+-
TP: 0.85350
TP2: 0.85000
TP3: 0.84700
TP4: 0.84400
SL: 0.86350
Chart time frame - 1W
Time for reaching TP - 1-3W
Follow, Like, Share or Comment
Thanks on supporting!
All best!

#DXY #DollarIndex #USD Weekly Analysis Dollar index is expected to go down a little bit after a day or two. Id the downward movement continues, we can expect good correction to the downside.
Hit the like button and drop a comment of you enjoyed this analysis.

#GBPUSD #Pound #Brexit Weekly Analysis: Still ShortGBPUSD is still showing bearish movement but we need to watch 61.8 fib level which will be reached in a day or two. Trade management is the key.

#EURUSD #EURO Weekly Analysis: Bullish Zone Ahead with 61.8 FibPlease watch DXY analysis first because DXY and EURUSD are usually inversely correlated. EURUSD Is expected to fall for a day or two to test and retest few important levels. However it has been a game of 61.8 fib levels so far. So a bullish zone lies just ahead.

#USDJPY Fibonacci Confluence Weekly AnalysisHi Traders, USDJPY has come to a region where it is a good candidate for short position. However we will have to manage the trade properly.
