XAUUSD Weekly Outlook – August 4–8, 2025
The question isn’t whether gold is strong. The question is — will price expand, or rebalance?
🔸 Macro Overview
Gold begins the week consolidating just below its final HTF supply zone (3439), while USD weakens amid mixed macro data and growing speculation of future rate cuts. Markets await fresh catalysts, and gold’s recent impulsive rally is now facing the big test: break the wick, or pull back?
🔸 Weekly Structure & Bias
Element Observation
🔹 Trend Bullish continuation — clean structure
🔹 Last BOS March 2025 — impulsive, with imbalance below
🔹 Price Action Top wick rejection forming near 3439
🔹 Bias Still bullish, but entering exhaustion zone
🔹 RSI Above 70 — overheated
🔹 EMAs EMA5 > EMA21 > EMA50 > EMA100 — perfect trend
🔸 Key Weekly Levels (Zones + Confluences)
Zone Type Price Range Confluences
🔴 Supply 3350 – 3439 HTF wick supply + FVG + RSI 70+ + liquidity trap
🔵 Demand 3270 – 3215 Weekly OB + FVG + EMA21 support
🔵 Demand 3120 – 3070 Old BOS + deep FVG + psychological level
🟢 Support 3000 zone EMA50 + historical consolidation
🔸 Fibonacci Extensions (Above 3439)
Extension Level Price Target Confluences
1.0 (Swing Full) 3439 Supply wick high
1.272 3505 Next psychological milestone
1.414 3560 Mid-extension + liquidity
1.618 3610 Golden expansion target
2.0 3740 Full trend extension (max)
🔺 These levels serve as potential breakout targets ONLY if we get a confirmed weekly close above 3439 with clean BOS on LTF.
🔸 Weekly Scenarios
🟢 Scenario 1 – Break and Expand
If gold breaks 3439:
Expect clean continuation to 3505 → 3560 → 3610
Best entries come from new OBs on H4/D1 around 3350–3370
Follow momentum — but don’t chase without retrace confirmation
🔻 Scenario 2 – Rejection + Retracement
If price holds below:
Pullback toward 3270 – 3215 expected
EMA21 acts as dynamic support
If selloff gains strength, next demand = 3120 – 3070
🎯 This zone aligns with macro OB + re-entry for long-term bulls.
🔸 Conclusion & Gameplan
Gold is pressing against its final weekly ceiling.
Structure remains bullish, but every sniper knows — at the edge of premium, timing is everything.
✅ Above 3439 → expansion opens to 3505 → 3560 → 3610
🟦 Below 3439 → retracement into 3270 → 3215 → 3070
The best setups will be born from confirmation, not prediction. Let the market decide.
—
What would you do if 3439 rejects hard this week?
Comment your plan, tag your sniper level, and let’s stay ahead together 💬
—
With clarity, confidence, and perfect timing,
GoldFxMinds 💙
Disclosure: Analysis based on Trade Nation (TradingView) chart feed.
Weeklychart
Market Insights with Gary Thomson: 21 - 25 JulyMarket Insights with Gary Thomson: RBA Minutes, BoJ Speech, ECB Decision, UK Sales, Earnings Reports
In this video, we’ll explore the key economic events, market trends, and corporate news shaping the financial landscape. Get ready for expert insights into forex, commodities, and stocks to help you navigate the week ahead. Let’s dive in!
In this episode of Market Insights, Gary Thomson unpacks the strategic implications of the week’s most critical events driving global markets.
👉 Key topics covered in this episode:
— RBA Meeting Minutes
— BoJ Deputy Governor Uchida Speech
— ECB Interest Rate Decision & Press Conference
— UK Retail Sales
— Corporate Earnings Statements
Don’t miss out—gain insights to stay ahead in your trading journey.
This video represents the opinion of the Companies operating under the FXOpen brand only. It is not to be construed as an offer, solicitation, or recommendation with respect to products and services provided by the Companies operating under the FXOpen brand, nor is it to be considered financial advice.
Total2 wants to inv h&s its way into completing its cup’s handleShould break above the neckline of this lemon lime colored inverse head and shoulder pattern in the upcoming 1-3 weekly candles here, and we are likely less than a week a way from the daily chart golden cross (not shown here). The breakout target from this inverse head and shoulder pattern will take price above the rimline of the larger cup and handle pattern and upon triggering the breakout from that we head to the light blue erasure move target which fro where price action currently is is about a 100% gain for the alt racket which should confirm alt season. *not financial advice*
Ascending Inverse H&S on the BTC weekly chartThe longer it takes to break above this neckline the higher the breakout target will be. I have arbitrarily placed the measured move line at July 18th 2025. If the breakout were to happen on that day the measured move target is around 208k, which could take quite awhile to reach or if we entered a truly hyperparabolic blow off top we could reach such a target way quicker than when the dotted measured move line reaches it. *not financial advice*
Weekly timeframe version of previous HBARUSD postWanted to show my previous hbar idea which was on the daily time frame on the weekly as well so I could fit the pole of the bullflag in the frame here. I will put a link below to my daily time frame version of this post which goes into slight more detail about each pattern and also the Nvidia hbar news. *not financial advice*
EUR/GBP – Bearish Triangle Breakdown in Play (Long-Term Setup)This EUR/GBP weekly chart is flashing a long-term bearish triangle pattern that has finally broken down, signaling potential for a major move to the downside. This setup is packed with high-confluence signals that traders should not ignore.
🔍 Pattern Breakdown:
📐 Bearish Triangle Pattern
The pair has been forming lower highs while maintaining a relatively flat support base, forming a descending triangle, a classically bearish continuation pattern.
The pressure has been building for over 6 years, with buyers failing to make new highs while sellers stepped in aggressively at lower levels.
The triangle support has now been broken, and price is entering a retest phase, which is critical for confirming the breakdown.
🟧 Black Mind Curve Resistance
A unique visual tool here is the Black Mind Curve — a curved trendline that mirrors the psychology of long-term resistance.
This curve has consistently capped price action since the 2009 peak, reinforcing the dominance of sellers in this zone.
Every time price reached this curve, it reversed — confirming it as a dynamic resistance.
🧱 Major Horizontal Resistance Zone
The shaded blue zone around 0.92–0.93 represents a long-term resistance area, which has repeatedly rejected price for over a decade.
This zone also aligns with the Black Mind Curve, adding to the confluence.
The most recent swing high failed to break this area, and the pair rolled over again.
🔄 Retesting in Progress
After the recent breakdown of triangle support, price is currently retesting the underside of the broken support line (now acting as resistance).
This is a textbook setup: break → retest → continuation.
If this retest fails (which is likely based on history), the bearish move should resume.
🎯 Bearish Target Projection
The projected move from the triangle breakdown points to the 0.64330 area, which aligns with a major support level from early 2007 and 2008.
This level is a high-probability magnet if the pattern plays out in full — giving a long-term swing trade or position-trading opportunity.
🧠 Why This Matters (Pro Insights)
This chart is powerful because:
It’s on the weekly timeframe – high conviction and larger moves.
It shows a long-term squeeze finally breaking.
Resistance is reinforced by multiple layers (curve + horizontal zone).
Retest confirms possible continuation sell setup.
This isn’t a short-term scalp — it’s a position trade idea that could develop over months or even a couple years, with a massive risk-reward potential.
⚠️ Trade Plan Summary
Bias: Bearish
Pattern: Descending Triangle (broken)
Current Action: Retesting broken support
Entry Zone: On bearish rejection near 0.8400–0.8450
Stop Loss: Above resistance zone (around 0.9285)
Target: 0.64330
Risk/Reward: Potentially >4:1 on a swing basis
WEEKLY ANALYSIS FOR BITCOIN/BT/BTCBitcoin is one everyone's radar with analysts expecting another bullish run. Prices are definitely looking bullish and I'm on board with the thesis that new highs will soon be delivered, but for now I'm bearish on the next week and think you can enter on better prices.
IO/USDT Weekly Trend Analysis and Reversal OpportunitiesThis analysis offers a detailed review of the IO/USDT weekly chart with a focus on identifying potential reversal zones that may provide attractive trading opportunities. The current market trend is bearish; however, two notable price levels—approximately 0.366 and 0.163—have been identified as potential support zones, suggesting a possibility for trend reversal.
Key observations: • Reversal Zones: These levels, clearly marked on the chart, could represent areas where buyers may step in and reverse the price decline. • Consolidation Areas: Horizontal areas of consolidation indicate periods where the price may pause before resuming its movement. • Current Price Dynamics: The asset is trading at 0.664, with a modest weekly increase of +1.68%, offering an intriguing counterpoint to the prevailing downtrend.
This organized analysis is intended to provide traders with clear, actionable insights for identifying potential entry points and refining their overall technical evaluation of IO/USDT.
BTCUSD. Weekly bull pennantThe daily failing wedge’s top trendline is not as sharp of a trajectory as the the weekly timeframe’s and due to this, the daily time frames wege is noticeably longer, so I thinkI am going to post a follow p idea to this one that shows the longer version of the wedge, not sure which one is more valid yet at this current time. If the weekly 50ma(in orange) can hold support then we should break up from this wedge right around where I have placed the dotted measured move lne, in which case the breakout target would be around 133k, if the longer version of the wedge on the daily time frame is the more valid of the two then we will likely have to correct longer before we see a breakout. Will post the longer version n the very next idea post. *not financial advice*
XRP just found bounce support on the bttm trendline of the wedgeLooking like a very valid pattern on the weekly hart. My guess is it will break upward somewhere around where I have arbitrarily placed the dottedmeasuredmove line, in which case the breakout target would be somewhere around $4.80 always a chance we retest the bottom trendline and even send a wick below. It before confirming a break upward though. *not financial advice*
EUR/USD short on weekly chart
Stop Loss = 1.14925
Entry Order = 1.10425
TP1 = 1.05925
Two positions with the same stop loss and x1 target for the first position
The stop loss of the second position to breakeven when the first position hits the target1.
The second position has no target, only exit
Risk= 2% of account capital (1% each position)
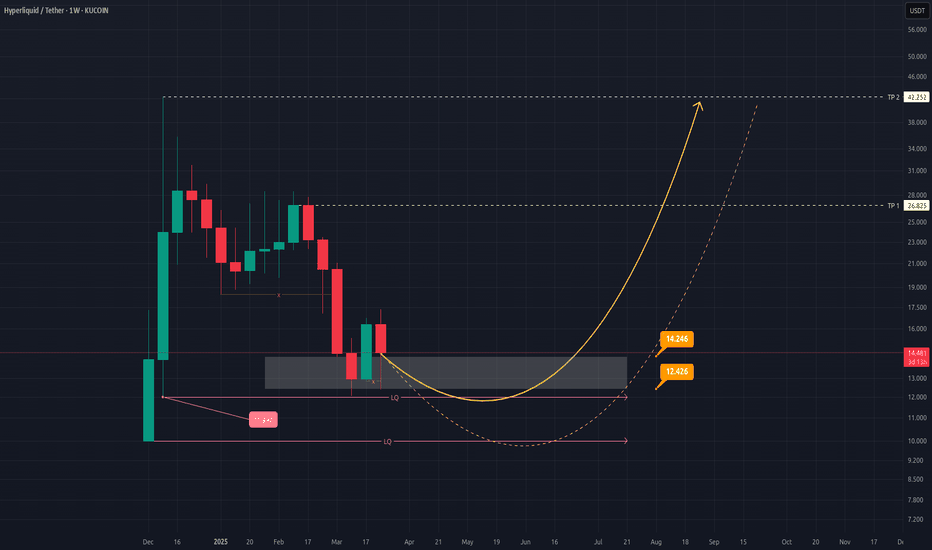
HYPEUSDT Weekly Outlook: Potential Reversal and Upside TargetsWeekly Chart Analysis of HYPEUSDT
The weekly chart of HYPEUSDT reflects a critical phase where the price is consolidating within a key demand zone, suggesting potential for a bullish reversal. Below is the detailed analysis:
Key Observations:
Demand Zone: The price is currently hovering around the highlighted gray box, which represents a strong liquidity zone ( LQ ) between $12.426 and $14.246 . This area has historically acted as support, and a bounce from here could signal a reversal.
Support Levels:
Immediate support lies at $12.426 .
A deeper correction could test the $11.997 and $10.000 levels, which are marked as liquidity levels below the current zone.
Bullish Scenario:
If the price holds above the current demand zone, it could initiate a rounded bottom pattern (illustrated by the yellow curved line).
The first target ( TP1 ) for this potential upside move is $26.825 .
The second target ( TP2 ), representing a more extended rally, is projected at $42.252 .
Candlestick Structure: Recent weekly candles show indecision, but if buyers step in strongly, it could confirm bullish momentum.
Risk Management:
Traders should monitor for any breakdown below the $12.426 level, as it may invalidate the bullish setup and lead to further downside toward $10.000 .
Conclusion:
HYPEUSDT shows promising signs of recovery from its demand zone, with upside targets at $26.825 and $42.252 in sight if bullish momentum builds. However, caution is advised until clear confirmation of reversal occurs.
This analysis provides a roadmap for both short-term and long-term traders to plan their entries and exits effectively.
JUPUSDT: Weekly Outlook & Key Levels for JupiterHey everyone! 🌟
Let’s take a look at this weekly cryptocurrency price chart together. Here's what stands out:
We’re looking at two possible scenarios:
Primary Scenario: The price might bounce back from the first support level, marked with a solid yellow arrow.
Secondary Scenario: If it doesn’t, the next potential rebound is from the lower support level, shown with a dashed yellow arrow.
Keep an eye on the numbers highlighted—$0.4310 and $0.3798. These are key price levels that could guide future movements. It’s also essential to monitor liquidity, candlestick patterns, and trading volumes. A strong confirmation, like a favorable candlestick formation and sufficient volume, could signal a rebound.
However, if the price dips below these critical levels, it might shift the perspective. Staying vigilant is key.
Always remember, this is just an observation. Do your own research, stay informed, and keep learning. The journey in the crypto world is as much about growth as it is about numbers! 📚📈✨
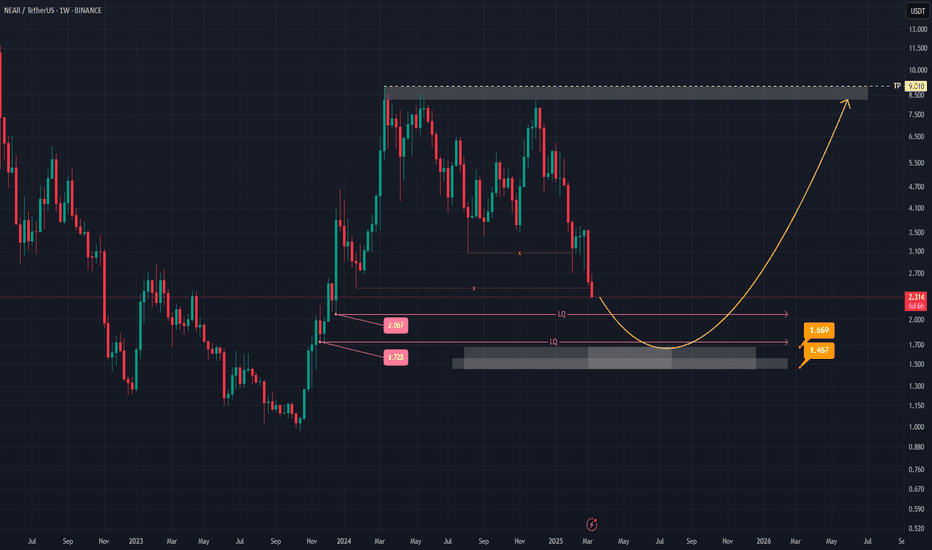
NEAR (NEARUSDT) Weekly Analysis: Potential Reversal in SightHey everyone! Let’s take a look at NEAR (NEARUSDT) on the weekly chart. There’s a chance the price might move into the 1.728–2.067 range, possibly sweeping up some liquidity before heading toward the 1.467–1.669 zone. This area seems like it could act as a launchpad for a potential bounce, aiming for higher targets afterward.
Watch for a spike in trading volume around that zone—if volume picks up, it could indicate stronger buying interest. Another key signal to look out for is a bullish candlestick pattern (like a hammer or a bullish engulfing), which might confirm a reversal if it appears near the 1.467–1.669 level.
Of course, if the price drops below 1.467, it might change this outlook and suggest a different path forward. Since the market can be unpredictable, it’s always important to keep an eye on these levels and stay prepared.
Above all, remember to do your own research and stay informed—this space can move fast, and it’s best to approach it with a curious mind. Keep learning, stay positive, and good luck out there! 📈
NOTUSDT Weekly Demand Zone: Potential Bullish Reversal at 0.0019This analysis focuses on Notcoin (NOTUSDT) on the Weekly timeframe , identifying a key demand zone that suggests a potential bullish reversal .
Based on chart observation, the price of NOTUSDT is approaching a critical demand zone located between 0.001971 and 0.001561 . This zone is anticipated to act as strong support, potentially marking a significant price low for the asset in the current market cycle.
The expectation is that within this demand zone , buyers will step in with sufficient volume , leading to a change in the current price trend and initiating a bullish reversal . The presence of proper volume upon entering this zone will be crucial to confirm the strength of the demand and the likelihood of a sustainable upward movement.
To illustrate the potential upside, Take Profit (TP) levels have been marked on the chart. These TP levels represent projected targets for the price following a successful bounce from the demand zone. Traders and investors should monitor price action closely as it interacts with this zone, looking for bullish confirmation signals such as:
Increased buying volume: A surge in volume as the price tests the demand zone would indicate strong buyer interest.
Bullish candlestick patterns: Formation of reversal candlestick patterns within the zone (e.g., bullish engulfing, hammer) could further validate the potential for an upward move.
In summary: This analysis suggests that the 0.001971 - 0.001561 zone presents a significant opportunity for a potential bullish reversal in NOTUSDT on the weekly timeframe. Closely monitoring price action and volume within this zone is recommended to identify potential long entry opportunities, targeting the marked Take Profit levels as the asset recovers.
Some interesting parallel channel linesEvery single one of these lines has significant resistance and support with price action candle wicks and bodes. We can see that the double top of the last bull market has both of it tops connected by one of these channel trendlines. That same trendline we broke above not too long ago nd t was also during the recent correction the exact level of support for the lowest we’ve gone during the correction. I get the feeling that that trendline is now the new floor on bitcoin. Will be interesting to see how price action responds to these trendlines in the near future. The current top trendline could very well end up being our next big resistance,however on the way there we will be breaking up from a bull flag that has a much higher target than that current top trendline so it may not. I feel probability of the other trendline that connects the most recent major support to the last bull market double top being the new support floor for bitcoin is higher though. It’s currently at 90k. Of course there’s always a chance we eventually correct down to 78k or so to fill the CME futures gap but if so y guess is we will break upward one ore leg first before we were to do anything like that. If we did indeed go down to fill that CME futures gap at some point that is when I believe will be the last time under the current support trendline which is right now sitting around 90k *not financial advice*
Current bitcoin bullflag has a target of 144kBeen consolidating inside this one for some time now and its been creating a lot of uncertainty in the market lately as most people have been distracted by the bearish h&s pattern on the Daly chart and haven’t zoomed out to the higher time frames to realize this whole time we’ve ust been consolidating inside this bullflag. The stochrsi has already been reset for awhile on the Daly time frame and is about to be fully reset here on the weekly time frame too sugget we will resume the uptrend in the near future. *not financial advice*
LTC Breaking above tan invh&s neckline, right on goldencrossI have the weekly chart timeframe selected here simply because I needed to expand the timeframe on the chart to be able to fit both inverse head and shoulders patterns and their respective breakout targets in the frame. Wanted to put the timeframe on the daily chart so. Could show once again how these recent crypto pumps have all being launching on the exact day that the Daly golden cross occurs. I will post. Daily chart version of this as well that zooms in on the golden cross and subsequent priceaction and link it below. Anyways it looks like on this 2nd breach above the tan neckline that Litecoin is likely to finally trigger a breakout ths go around. If so the highest measured move target is in the $170s here, and reaching it will obviously also allow us to hit the white inverse head and shoulders breakout target too on the way there. In order to ensure that price acton doesn’t dip back below the tan neckline for a second time, it will need to flip the weekly 200ma(blue line) to solidified support once that happens I think it will definitely confirm the breakout at that point. Alt season has officially began! *not financial advice*
XDC breaking up from 3 different bull patterns at the same timeI had to use the weekly time frame instead of the daily to fit all 3 patterns in the frame here. As you can see we have a double bottom(green neckline), an inverse head and shoulders (tan neckline), and a pink bullflag that price action is currently breaking above each of. Their full measured move targets are all relatively close to eachother too which creates some bullish confluence. *not financial advice*


