Hindcon Chemicals - All time high. Breakout on weekly chart#HINDCON CMP 138.20 | All time high price & volume | Breakout on weekly chart
Strategy to add on dips from current price
Can see more momentum in short to mid term
*Not recommendation
Weeklychart


GRANULES breakout - Inverse H&S / Parallel channel- Increased volume
- Inverse H&S / Parallel channel breakout
Entry levels 325-330
*Not recommendation

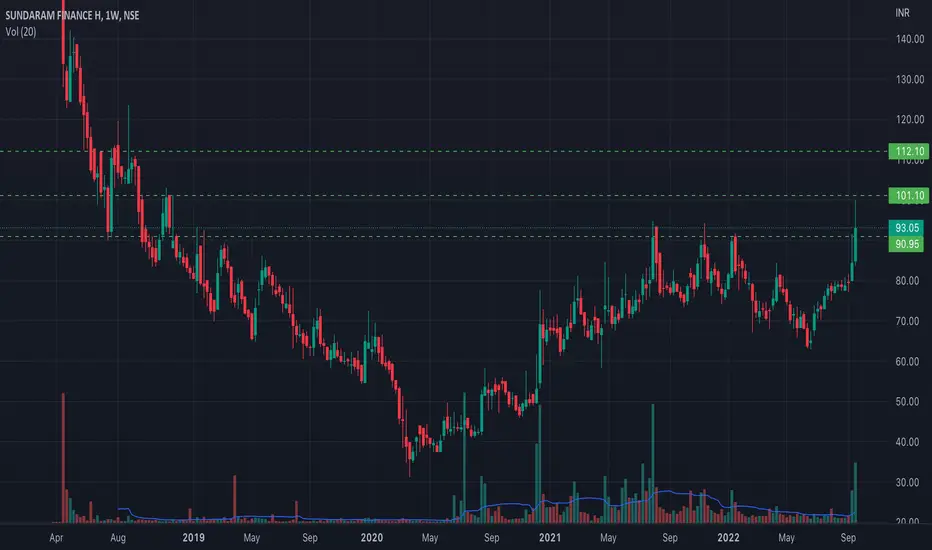
SUNDARMHLD Weekly chart - Bullish momentumGood volume
Looking good on weekly chart
Bullish momentum
*Not recommendation
DAAWAT - Multiyear breakout with volumeMultiyear levels breakout
Looking good on weekly chart
Bullish momentum
*Not recommendation

LIBERTSHOE looking good - CMP 222Multiyear levels breakout
Looking good on weekly chart
Bullish momentum
*Not recommendation

XRP appears 2b triggering a double bottom brkout on weekly chartWe can see the double bottom formation pretty clearly hear on the weekly chart…its not as obvious on the daily so I chose to post this idea from the weekly time frame. We have two potential targets here for measured move. We also have a potential resistance zone just before the 1st target at 48 cents. This is where the 1day 200ma (not shown here) currently resides. I anticipate it will offer at least temporary resistance. Both of these measured move targets are above it though so ultimately I think we will at least overcome the 200ma long enough to hit the first target. *not financial advice*

MISHRA DHATU NIGAM WEEKLY TIME FRAMEThe Structure looks good to us, waiting for this instrument to correct and then give us these opportunities as shown on this instrument (Price Chart).
Note: its my view only and its for educational purpose only. only who has got knowledge about this strategy, will understand what to be done on this setup. its purely based on my technical analysis only (strategies). we don't focus on the short term moves, we look for only for Bullish or Bearish Impulsive moves on the setups after a good price action is formed as per the strategy. we never get into corrective moves. because it will test our patience and also it will be a bullish or a bearish trap. and try trade the big moves.
we do not get into bullish or bearish traps. we anticipate and get into only big bullish or bearish moves (Impulsive Moves).
Just ride the Bullish or Bearish Impulsive Move. Learn & Know the Complete Market Cycle.
buy low and sell high concept. buy at cheaper price and sell at expensive price.
Keep it simple, keep it Unique.
please keep your comments useful & respectful.
Thanks for your support....
Tradelikemee Academy

A potential double bottom may be forming for btc dominanceWe are seeing a big green candle on the 1 day chart (not shown here) right now on btc dominance. It is suggesting that perhaps the bottom is in for btc dominance. We also happen to have bullish confluence for this scenario because even though the current bottom is slightly lower than the previous which create a slight downward slant to the double bottom pattern….when we take that downward slanted trendline, clone it and then move it up to where the neckline of the double bottom would be, it creates a perfect parallel channel which only adds credence to this begin a valid double bottom -and- a valid channel at the same time. Of course you can’t assume a double bottom is going to play out until a breakout is confirmed, and with price action still near the bottom of the pattern and nowhere near retesting its neckline yet there’s no guarantee this pattern will play out. Worth keeping an eye on for sure though which is why I am posting this idea. I chose to post the weekly version of the chart instead of the daily because it seems more valid as a weekly pattern and there is also less noise making it easier to see the pattern. *not financial advice*

Weekly candle above the falling wedge. Which target more likely?We can see one of the most common bull/bear combos on the weekly chart here. It is the bearish H&S pattern, with a bullish falling wedge overlapping it. We have been below the neckline of the H&S pattern for awhile now, however as you can see the measured move for these and shoulders pattern is negative 589…which greatly increases the probability that we wont be getting anywhere close to 100% of the breakdown target. When bearish patterns don’t hit 100% of their target, it is a sign that either we are still in a bull market or the trend is about to change from bearish to bullish. I personally think that the 63k breakout target of the falling wedge is more likely to hit 100% than I think the h&s will. . .the fact that it is says 589 is slightly intriguing considering how that number has gained cult significance in the xrp realm of crypto but I’m pretty sure sure it would worst case scenario never go negative and instead just do what luna did and start adding more zeros after the 0. Decimal point. However I don’t think the whales would let bitcoin go to zero without at least one more exponential hyperparbolic bullrally if not several more. All these things collectively make me a firm believer the falling wedge breakout is far more probable than the h&s reaching this impossible negative target. *not financial advice*

Inv h&s on xrpeth pair on the weekly chart.We can see price action on the weekly xrpeth chart is peeking above the neckline of an inverse head and shoulder pattern here. If we can close this weekly candle above it and see a bullish volume impulse on next weeks candle we should be able to confirm this breakout which has a target that would lead to xrp gaining 59% in value against ethereum. For now this isn’t confirmed, however you may have noticed I posted a chart a few weeks ago that showed xrp should be making even bigger gains on ethereum than that based on the triangle pattern it had broken above. So with that in mind, it doesn’t surprise me that we’ve seen this many daily green candles on the xrpeth chart and increases the probability of this inverse head and shoulders pattern getting validated. For now we must await the pattern validation *not financial advice*

About to break above a weekly btc falling wedge soon?We can see price action is now currently back above the weekly 200ma (in blue). This key moving average has held solid support for most of bitcoins existence and if it can flip back to solidified support here as well then it should allow price to break up out of this falling wedge right around where I have placed the dotted line that charts the measured move of the wedge’s bullish breakout. If we see this occur odds are very likely the bull market will be back on….of course ideally we will still want to see price action eventually create a new higher high which would require a new ath. *not financial advice*

Nearing the Neckline of the 2020 Market Collapse BottomThe "neckline" of the bottom after the market collapse of 2020 is very strong support as the selling at this juncture was a panic mode due to the pandemic economic lockdown. Stocks collapsed beyond fundamental levels at that time.
This support level is going to thwart downside action for many stocks near this area. This kind of pattern warns of the impending end to heavy selling down. So, many stocks should develop a bottom around this level.
Example: The neckline of the 2020 bottom formation for CMCSA is at 39.49. But this is NOT confirmation of an entry point yet. Best to wait for a breakout of the current basing action. Bottom formations can take a while to build sufficient buying energy to move up sustainably.

📈 Bullish rebound ahead!Looking over the last ten years in NDX, we've got a bullish seasonality from now on until the 27th of July. This seems to match with our recently touched 50 % fib retracement. A bullish rebound appears to be very likely now.


ITC Evening Star Pure Educational Purpose Only
On Weekly Timeframe, Seeing Evening Star without touching Body of Evening Star Candle Body.
But there is immediate Support also which may Retest also & bounce Back.

Huobi Token is in good consolidationHi Friends,
As we can see in Weekly Timeframe chart Huobi Token ( HUOBI:HTUSDT ) is in good consolidation I think it is accumulating. Most of the time such long consolidation will give a breakout towards the upside.
Huobi Token ( HUOBI:HTUSDT ) is the native token of the cryptocurrency exchange Huobi Global. It is a decentralized digital asset based on the Ethereum blockchain and is ERC-20 compliant. Huobi Token was first launched in January 2018. So it has been some time since it launched. Old crypto projects have high trust.
Remember this is weekly TF trade so you have to HODL Huobi Token for weeks if not months. Also, don't forget to manage your risk as the crypto market is highly volatile in nature. Share your opinion in the comment section.

Where the green line intersects the brown line. I feel like this would be a great spot for a potential end to the current correction. It is a convergence of two major trend lines. The green trendline being the top trendline of the wedge we broke out of a few weeks ago and the brown line being the bottom trendline of the channel we’ve been in forever now. Price action loves to retest the top trendline of a wedge after breaking above it before fully validating the breakout and has yet to do that on the weekly chart here so what better spot for it to retest that trendline than where it overlaps this other trendline that has been proven to be huge support time and time again. If we do confirm the breakout there are 2 potential measured move targets. Both targets depend on which bottom trendline of the wedge is most valid. The other lower green trendline, or the pink trendline. If the pink trendline is the more valid then we have a higher potential measured move target. The green one appears to have slightly more key touches but the pink one creates a shorter wedge and the point of breakout from the price action makes more sense in the shorter wedge as opposed to the longer wedge in which it feels like the breakout would be occurring far earlier than normal. Also if the pink line is the more valid bottom trendline, we can see its measured move target would take us exactly up to the top brown ascending trendline (aka top trendline of the brown rising channel) if price action were to reach the target at the same time the pink dotted measured move line’s trajectory does. That’s added bullish confluence that helps to increase the probability that the pink trendline could be the more valid of the two bottom trendline to the falling wedge. I would definitely prefer the pink line to be the more valid since it has the higher breakout target. Of course, as always there’s always the chance these patterns could break downward and confirm a bear market. I would still be leaning bullish myself until I saw a lower low formed as well as a weekly close or 2 below the bottom brown trendline though. *not financial advice*

Potential falling wedge breakout on the weekly chart. This wedge could attempt to retest its top trendline for support..if it does the trendline is currently around 38k. As long as we can maintain 35.5k as support worst case scenario then the bull market should be maintained. No guarantee we will be dipping to these levels though.

ZILUSD with a pump no one expectedOn the 1 day chart it was hard to find a legitimate chart pattern to justify ZILUSD’s sudden pump here but once one flips to the weekly chart this pattern emerges. This triangle is probably more valid on either the 2 week or 3 week chart than it is the 1 week considering how many weekly candles we closed outside the triangle before we saw the breakout. Judging by this pattern ZILUSD still has a little more room to move up on this current breakout *notfinancial advice*

Bitcoin Weekly Chart Analysis WARNINGHi guys I was looking at the weekly chart for bitcoin and I noticed something on the rsi. A huge hidden bearish divergence can be seen from last year's top to this year's top. I am still very bullish on bitcoin and do hope that this does not affect the price action of bitcoin in the following weeks to months even though we have had a massive break out to the 40k levels. Just a warning to be cautious. Just wanted to point that out in the case bitcoin dumps back down lower.

If this symmetrical triangle is valid on AVAX, target= $177These seem like the most valid trendline for the avalanche usd pair on the weekly chart. If this is a valid pattern and the top trendline is correct then we should see the breakout confirmed by early April. If so the target would be $177. *not financial advice*

A potential weekly chart double bottom on zecusd forming as wellThis weekly chart double bottom is much more massive and currently far more speculative than the 1 day chart double bottom I posted an idea about just before this idea. However I felt it worth mentioning as it would be fun to see this actually unfold then come back to this idea later to click play on the chart and see the pattern play out from its second bottom. If this one were to play out, then ZECUSD’s target would be $520. Of course again, this one is much more speculative at this point, but still worth keeping an eye on. *Not financial advice*
