Weekly Review - 28/10/2020 (still short on EU indices)Our weekly review- things are going well, contact us for more.
Weeklyforecast

EURUSD Facing Pressure at Range TopEURUSD has rebounded and retraced from a 1-month low just above 1.16 for the entire October and has completed 2 bullish waves by now.
As the US election draws closer, uncertainty continues to brew, causing risk sentiment to rise and boost demand for safe-haven assets such as the dollar.
Besides, the ECB conference will be up this week and chances are the ECB might take a dovish stance if they are ready to bring interest rate deeper into the negative territory.
Otherwise, the market has retraced significantly from the previous bearish trend and is definitely a decent price to attempt selling EURUSD.

Can USDCAD's Support Hold?USDCAD has retraced back to the breakout point of it's 6-month downward trendline, back to a strong support zone, which coincides with the 78.6% level retracement.
With oil prices hovering below $40 after breaking below key channel, and the Canadian economy being heavily reliant on Oil prices, the effects should be seen in Canada's currency.
This week, should the current support hold, we could look to buy USDCAD again, however, should price break current support, next level of support could be seen at the previous low at 1.300.

USDJPY to Range before Further DownsideUSDJPY fell last week after rejection from a 3-month falling trendline but found support just above 105.
The yen has gained across all major peers amid growing uncertainties due to the pandemic and political turmoil in the US and Eurozone such as the US election and the Brexit talk.
However, the dollar rose too on safe-haven demand which therefore causing USDJPY to stuck in a range.
However, the price has reflected that the yen will eventually strengthen against the dollar ever since the pandemic broke out.
We expect the market to rebound a little higher towards the 105.6 - 105.8 region before it provides more downside movement.

Gold's Demand ReturnsThe gold has shown a clear sign of a bullish reversal for the first time in nearly 2 months.
The gold broke above a near 2-month falling trendline which started forming since the gold peaked at a new historical high of 2075.
However, we are not expecting huge and fast buying of the gold and we do expect the price to range upwards through October.
In general, the gold market has provided a pretty satisfactory discount and buyers will inevitably start to pile up.
Wait for the price to pull back and observe the price action to find a good entry point and as of now, 1916 looks like a good price to buy.

USDCAD More Room for DownsideUSDCAD was unable to keep the bearish momentum after breaking above a significant resistance level. Price came back to the trendline formed after the initial break out of the falling channel, but could not find support either.
The last 3 days of this week formed 3 very bearish candles, even breaking through previous demand zone, providing USDCAD with more downside.
This week, we could look to continue selling USDCAD to it's previous low, waiting for small retracements too add positions.

EURUSD Ready to Resume Bull RunEURUSD is probably ready for a whole new wave of a bullish run after gaining stronger ground from last week.
The market has broken out from a retracement channel and the price has also resurfaced above all moving averages, as well as an important pivoting level at 1.1750.
The MACD is also showing a returning bull and the line is about to cross above level zero which indicates a sustainable bullish trend.
This week, we expect EURUSD to climb further and traders may wait for a pullback towards 1.1790 to long.

Dollar Resumed Bearish after 3 MonthsThe dollar broke away from a rising structure after breaking below a 1-month rising channel and a demand zone around 93.6.
The MACD is also about to cross below level zero which indicates a sustainable bearish trend to follow.
The market sentiment seemed to have turned risk-on again in anticipation of the fresh stimulus package.
It has also taken the dollar a little more than 3 months of retracement and consolidation since the completion of a previous bearish trend to once again resume depreciation.
This week, we expect the dollar to continue weakening towards 92 and traders may wait for a pullback towards 93.38 to sell the dollar.


$ETHUSD #ETHUSD [D1] Is Retreating to Recharge!KRAKEN:ETHUSD
1 more test to 300 : 270 range is anticipated.
#AHMEDMESBAH

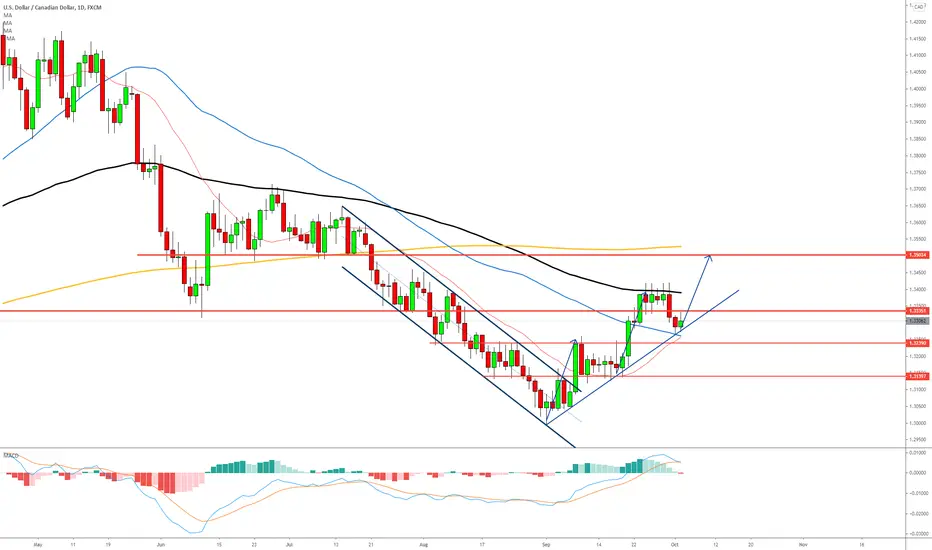
USDCAD Newly Formed Trendline.After USDCAD broke out of a 3 month channel, price has been slowly appreciating.
USDCAD has mainly been pulling back this week after a second wave of appreciation.
Price has came back down and found support on newly formed trendline on Friday.
Next week, should this support on trendline hold, we could look to continue buying USDCAD back to next resistance level at previous head and shoulder pattern.
GBPUSD - WEEKLY ANALYSISGBPUSD - Refer the charts, I have marked the levels for both side movement probability.
Current situation : Positive bias is there, momentum is in buying side, For now approach should be a BUY at current price range 1.29200 - 1.29400
Maintain stop loss around 1.28700, If your risk appetite allows you can keep 1.27600 as a major support zone or stop loss level.
Potential upside move 1.32000
In the lower side Sell below 1.27500
Maintain stop loss around 1.28700
Potential down side move 1.24800
Follow the levels as mentioned above.
Traders, if you liked this idea hit the like button & write in the comment section.
Why you should follow this tradingview account ?
Managed by top most renowned trader - Pulak Priyesh
10 + years of trading experience
Professional Day trader
Excellence award winning mentor
Professional chart, clear chart without junks.
Major S/R levels with inner insights
Frequent Day & Swing trade levels
All major and minor FX/INDICES covered
Thanks !!

Weekly Forecast (GBPJPY Daily) 27-09-2020Looking like we are in the middle of a pullback.
Could have bullish momentum to re-test structure on HTF

USDCAD More Room for Upside.USDCAD continued its gains this week following a break from a downward channel early September.
Price has managed to break and close above key resistance area, signifying that there are more room for appreciation.
We can continue the bullish stance on USDCAD till next key resistance at neckline of previous HnS pattern.
Upon market opening, await for signs of retest on support area for long opportunities.

Practice Patience with GoldGold had the biggest weekly loss in close to 2 months.
It also ended a 5-week ranging market that took the shape of a symmetrical triangle soon after the breakout from a near 6-month rising channel.
With that, the gold is now on sale, an 11% discount from its all-time high.
While the dollar seems to be in high demand as a safe haven currency, what performed the best is still gold especially in a risk-off market like the one we are facing now.
Gold was just too overpriced but many will be observing for the right time and best price to buy the gold again before the next gold rush.
Therefore, we will probably expect the gold to fall into another range eventually and we will practice more patience with trading gold.
Otherwise, the best price to start buying the gold will be from the 1800 demand zone.
It was once a very strong resistance throughout 2012, and the bull rush has begun shortly after it was broke through.

Dollar's Comeback ContinuesAfter ranging for more than 2 months and reaching a 29-month low, the dollar started to show signs of reversal.
The reversal took off strongly and broke above the top of its previous range just below 94 with very little pause.
The dollar continued to climb and finally reached the top of a 6-month falling channel where resistance was presented.
However, a reversal failed to take place and the dollar went out to break above the previous day high on the very last trading day.
US dollar rose amid a risk-off market sentiment and also due to a technical oversold.
The dollar is likely to inch higher further before Friday's NFP.
We will keep our short-term view bearish or slightly towards ranging for now until it reaches the supply zone above 95.

Sunday Weekly Forecast 20-09-20 (GBPJPY Daily)Bearish bias for the week based on:
1. Friday's candle broke and closed below support with strong candle
2. Overall bearish trend on HTF
3. New UK COVID lockdowns will hurt GBP

USDCAD One More Wave?USDCAD has been ranging last week after breaking out of a 3-month channel. Similarly to the Dollar Index, with a bullish bias towards dollar, and the recent Oil Price falling, we can continue buying USDCAD at the bottom of its current range.
Next point of resistance being 1.3335 and 1.3500. Look for retests upon market opening, or should price break above the current range, await a retest on resistance turned support.

GBPUSD More Room for DownsideGBPUSD started a downtrend when it gapped downwards and broke a trendline upon Elliot Wave completion. Last week, Price has once again broken a 6 month trendline, and retested break out point before a bearish closing on Friday.
This week, we can assume GBPUSD will continue it's downtrend, at least back to its previous low at 1.278, with next immediate support being at 1.2545.
Continue selling GBPUSD once there are small pullbacks in the smaller timeframes upon market opening.

EURUSD Weekly Analysis [9-20]Hello traders, if you like these analysis please like and share :).
price is squeezing tighter in the current wedge, we may see more downside
to the .50 retracement or to retest the trendline. I am currently biased in upside long term,
reference to my previous analysis.
RSI has not yet crossed below 50, sma still says bullish.
Hope you all be blessed.
Trade with wisdom.

GBPUSD - Weekly Analysis.GBPUSD - Looking bearish on bigger time frame, breakdown is there on the chart, I have made a projection follow it properly.
Look for a short selling opportunity.
Follow the levels :
Sell range : 1.29250 - 1.29400
Stop loss : 1.29900
Target : 1.28700 - 1.27900
Traders, if you liked this idea hit the like button & write in the comment section.
Why you should follow this tradingview account ?
Managed by top most renowned trader - Pulak Priyesh
10 + years of trading experience
Professional Day trader
Excellence award winning mentor
Professional chart, clear chart without junks for your better understanding
Major S/R levels with inner insights
Frequent Day & Swing trade levels
All major and minor FX/INDICES covered
Thanks !!

Dollar still owes a Bullish WaveThe dollar continued to range and trended slightly lower.
The bearish movement can be seen as a pullback for the previous bullish trend which saw the minor bearish structure broken.
On the other hand, the dollar is very oversold and hasn't pulled back significantly enough even though the current highs are still trading lower.
This week, we will still maintain our bullish bias and continue to buy the dollar as part of a short-term trading strategy.
