Weeklymarketsanalysis


BNBBTC bounced on 0.786 Fibonacci Level 🦐BNBBTC bounced on 0.786 Fibonacci Level and now is testing a weekly resistance.
IF the price will break weekly resistance According to Plancton's strategy, we can set a nice order
–––––
Follow the Shrimp 🦐
Keep in mind.
🟣 Purple structure -> Monthly structure.
🔴 Red structure -> Weekly structure.
🔵 Blue structure -> Daily structure.
🟡 Yellow structure -> 4h structure.
⚫️ Black structure -> >4h structure.
Here is the Plancton0618 technical analysis, please comment below if you have any question.
The ENTRY in the market will be taken only if the condition of Plancton0618 strategy will trigger.

Possible Retracement Before ContinuationThis pair looks like it has a huge retracement due this week before continuing for the short. Retracement may end in the 1.79129 zone before the short continues. If not, we'll keep going up to the next zone above for a fresh to test the last lower high.
BULL TPs:
• 1.78192
• 1.79129
• 1.80512
BEAR TPS:
• 1.75881
• 1.75308
• 1.73815
• 1.72856


Price broke the Support Last week price broke the strong support level and now its resistance hence price will continue to fall

Weekly Trading Analysis 20.09.2020A look at the Major Indexes to form pairings for the week ahead.
PAIRINGS:
SELL PAIRS: NZDUSD, AUDUSD(C), GBPUSD(C), GBPJPY(C),AUDJPY(C),CADJPY(C), NZDJPY,CHFJPY
BUY PAIRS: USDCAD (C), USDCHF(C)

BTCUSDT WEEKLY Strong Bullish SignWe are in 4 th wave of Weekly TF So we Should See 5th Wave and then Dump

BTC on the retest of a weekly support 🦐BTC on the weekly chart is retesting a very important weekly structure.
The market after the break and test of the highs retraced back till the 10k level.
Being a strong support we can expect the price to bounce over the structure and respect the mid line of the channel for new move up.
On the other hand if the price will break below the weekly structure we can look 9k level.
----
Follow the Shrimp 🦐
Keep in mind.
🟣 Purple structure -> Monthly structure.
🔴 Red structure -> Weekly structure.
🔵 Blue structure -> Daily structure.
🟡 Yellow structure -> 4h structure.
Here is the Plancton0618 technical analysis , please comment below if you have any question.
The ENTRY in the market will be taken only if the condition of Plancton0618 strategy will trigger.

GOLD - WEEKLY ANALYSIS.GOLD- It's looking bearing on a bigger time frame, Approach should be finding a short sell opportunity.
Levels to take action on ;
Go for short sell in the range of 1945 - 1950 with a stop loss of 1966 for a downside potential up to 1900 - 1883.
Keep trailing stop always to secure your profits.
There is a possibility of a bounce back which I have mentioned from 1883 so have an eye on it to grab a buying opportunity as well.
In case if it triggers stop loss level of 1966 and sustaining above 1970 it can jump till 2012 level, but chances for an upside is little less for now based on technical charts but do keep this in mind too.
Follow the levels properly and maintain proper risk reward.
Traders, if you liked this idea hit the like button & write in the comment section.
Why you should follow this tradingview account ?
Managed by top most renowned trader - Pulak Priyesh
10 + years of trading experience
Professional Day trader
Excellence award winning mentor
Professional chart, clear chart without junks.
Major S/R levels with inner insights
Frequent Day & Swing trade levels
All major and minor FX/INDICES covered
Thanks !!

GOLD Weekly, Daily analysis 🦐Gold has reached in the last weeks a key level of 2072 and retraced back below the 2000 level.
On the weekly chart (left) we can see that market found support on a weekly structure and price retrace till the 0.618 fib level and went back up at the 0.5.
On the daily chart (right) the market testing the discending trendline and creating a triangle pattern.
We can expect the price to break above the discending trendline and the upper daily structure to test the recent highs.
–––––
Follow the Shrimp 🦐
Here is the Plancton0618 technical analysis , please comment below if you have any question.
The ENTRY in the market will be taken only if the condition of Plancton0618 strategy will trigger.

XRP testing a discending trendlineXRPUSD on the weekly chart hit a descending trend line and got rejected for a 3rd time on the 0.30 level.
Market hit on the move back the 0.618 on the support structure.
If the price will break above the weekly resistance and consequently break the trend line we can set a nice long order according with Plancton’s strategy.
–––––
Follow the Shrimp 🦐
Keep in mind.
🟣 Purple structure -> Monthly structure.
🔴 Red structure -> Weekly structure.
🔵 Blue structure -> Daily structure.
🟡 Yellow structure -> 4h structure.
Here is the Plancton0618 technical analysis , please comment below if you have any question.
The ENTRY in the market will be taken only if the condition of Plancton0618 strategy will trigger.

Key Level Trade Setup -- Major Resistance Level May Be RespectedFirst, this is nice that it's sitting on a weekly key level. Second, where price stopped also looks to respecting a major level of structure according to the daily.
I'm looking for another short overall. But, as we know, price does what it wants. So if it does decide to perform a pullback into a continuation, those TPs are in place too.
BEAR TPS:
• 139.698
• 139.164
• 138.236
• 137.708
• 136.542
BULL TPS:
• 141.621
• 142.320
• 142.768
• 143.718

XRPBTC is inside a descending channel 🦐XRPBTC is inside a descending channel after price bounced twice on 0.618 Fibonacci level as you can see on weekly chart (right chart).
Now the price need to have a breakout from channel and weekly resistance.
According to Plancton's strategy, we can set a nice order
–––––
Follow the Shrimp 🦐
Keep in mind.
🟣 Purple structure -> Monthly structure.
🔴 Red structure -> Weekly structure.
🔵 Blue structure -> Daily structure.
🟡 Yellow structure -> 4h structure.
Here is the Plancton0618 technical analysis, please comment below if you have any question.
The ENTRY in the market will be taken only if the condition of Plancton0618 strategy will trigger.

Depends If The Bearish Trend Can Be Broken This WeekThis pair actually has been fun. It's spent multiple weeks in consolidation just to do it up massive uptick that made me so proud. Then it pulled off this beautiful short, that actually looks like a giant pullback at first glance on the higher timeframes (daily, weekly).
When it hit the daily key level zone at 1.54626 and bounced off as support, it actually respected the several-week major consolidation area and looks to be positioning itself to break the bearish trendline, or to respect it and keep tumbling on down.
This is my favorite pair so I am just going to rock wherever it goes. Lots of pips either way.
BEAR TPS:
• 1.54812
• 1.54058
• 1.52947
BULL TPS:
• 1.56837
• 1.58161
• 1.59955
• 1.61280

GBP/USD and a POSSIBLE BUY#PreparationHey tradomaniacs,
looking at GBP/USD I can see a possible long-scenario in order to continue the trend.
Technicals:
The previous fakeout by DXY caused a sell-off in GBP/USD which has resulted in a fakeout and close above the key-support,trendline and 61,8% Retracement-Level.
GBP/USD recently broke out of its consolidation and has now retested the area of possible bullish confluence.
It is likely to see another UP-WAVE which would be the third and so extended wave to trade (Very attractive to trade).
Fundamentals:
The previous NFP-Data were overall bearish for DXY as the positive Figures were a confirmation for the current low monetary policy of the FED.
The market will probably price in more liquidity for the market and so more inflation in the USA which will probably boost EUR as it has a weight of 57,5% in the US-DOLLAR-BASKET.
The only concern I have is a previous post from London saying that the economy does not recover as good as expected and that a further easing is likely to happen.
This is a dovish sign for the POUND and could so may give us a nice chance to buy EUR/GBP as I expect a better performance by EURO against DXY.
LEAVE A LIKE AND A COMMENT - I appreciate every support! =)
Peace and good trades
Irasor
Wanna see more? Don`t forget to follow me.
Any questions? PM me. :-)

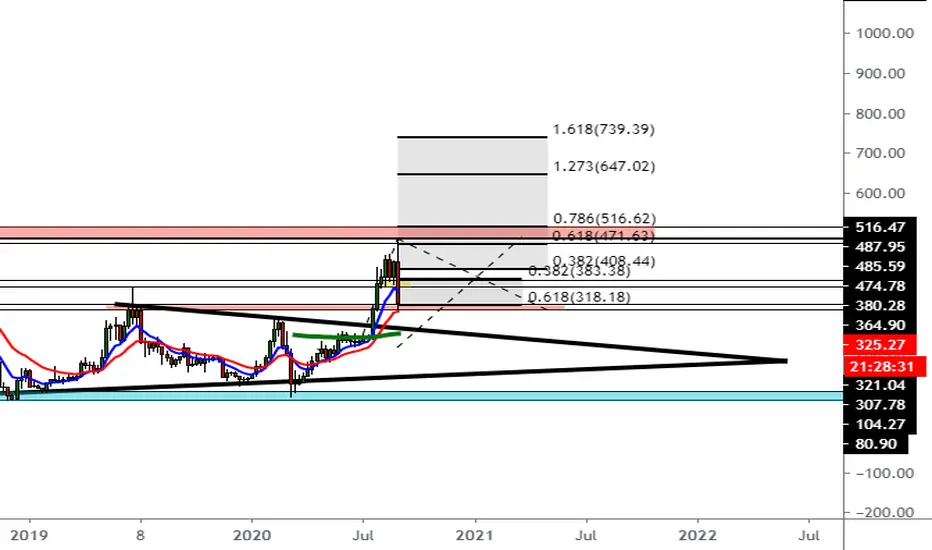
Overview of Ethereum: What never see in Ethereum is a bullrun!!!In this analysis on weekly, I detect a long opportunity, now this correction show a good opportunity to buy, buy and buy Ethereum for long-term and accumulate Ethereum.
So, guys I show you the targets to reach based in the Fibonacci's Trend:
0.382% = $408 USD
0.618% = $471 USD
0.786% = $516 USD
1.273% = $647 USD
1.618% = $739 USD
That is a good investment for Ethereum and great opportunity for longer while we see a Altseasoon soon.
Also, in weekly timeframe we detect the buy at 0.618% of Fiboancci. That is amazing to invest in Ethereum for long-term!!!
NIFTY COMMENTARY by Kiran WEEK 2Hello friends,
Last week I started the commentary with five conditions, they are listed below.
1. BUYing opportunity
2. BUY hold
3.Wait for trend confirmation
4. SELLing opportunity
5. SELL hold.
We might be in the middle of trend reversal.
So, here both bulls and bears should take care.
If NIFTY cannot able to close above the red trend line then it signals the correction is underway. It will be confirmed this week.
Any dare people can short the NIFTY at red line which can act as resistance line.
my view about the NIFTY
3.Wait for trend confirmation
When it will confirm the down trend?
Simple, new lower low will confirm it. it is now at 11150-11300 range and not able to go above 11500 -11600 range.
Thats it
Have a nice weekend. SEE YOU NEXT WEEK.
Your humble trader,
Kiran

BTC Re-Post From July 11 coming true!! Re-test Weekly 21 EMA No One is Talking About this...Re- Post
I was Correct, just missed it by one week! BTC has always retraced to the Weekly 21EMA to test support... in both previous post-halvings. The Weekly 21 EMA was tested between the 12th and 16th week...BTC is in week 17 Post-Halving 2020.
Weekly 21EMA is currently 9940...today's candle wick low was 9987 week-to-date... that's close enough for me!
Now to stay bullish...the BTC weekly close, should not CLOSE below the Weekly 21EMA. Wicks below are fine, that could even mean a daily close below the Weekly 21EMA, but NOT the Weekly Sunday night close at 8pm Eastern..
No-one would listen to me...got this one right...
I am lead to believe that the market cycles are getting longer so the 17th week after the Halving makes sense to me...

Special Analysis: Are you prepared for the Euro crash!!!Hello everybody, in this special analysis, I see a nice opportunity that maybe Euro is weakness the trend!!! Because we could see a bearish season.
Now, i share you my screenshoot for you, because we could see a possible USA recovery for the next days between weeks.
First, we see in Daily that Euro is weakness boughts and we are in the strong resistance at $1.18 that was broke up, but in that case we could see a sell off of Euro as US is into the recovery for the past speculate news that I discuss with you.
Now, this analsyis of Daily is a key important to find up a medium term profits.
Now, this is an weekly analysis that we broke up the red resistance, obvously this red resistance is a weekly zone, and it's could be a go back below as rejetion, because as we are in the bullish channel, we could to end the boughs and startind the bearish season for the next days as I predict.
Finally, as I add the 3 day charts, we see a possible drop of the price in medium term, also the RSI show a pull back in the 80 parameters and that confirm an exactly point to find down sell off.
Now, I share you my fundamentals keys for you:
1. Euro rises above key $1.20 USD level for first time since May 2018
Now, if you see Euro is go up so much, but need to make a correction before to continue up with their bullish trend.
Also, using the Fibonacci we could see two scenarios at $1.16 USD and a possible to reach at $1.1550 USD,
So, my objective is simple find down 330 pips, its a good bussiness and profits to earn down.

GBPAUD SELL STRATEGY - ANALYSISPrice has just done a quick retest of the broken resistance. We anticipate to see a big fall throughout the next week. Our last target will be at 1.77451 (there is another strong resistance when you look at a weekly time-frame).

SP500 on new highs 🦐SP500 has almost each the level of February 2020 before that the covid pandemic hit.
On the monthly chart the marker has been in a full uptrend for the last 5 months and going on the weekly chart the market has broke the resistance structure around 3200 zone.
For the next weeks we can expect the market to reach the recent highs around 3390 zone and consequently break it for new historical highs.
––––
Follow the Shrimp 🦐
Here is the Plancton0618 technical analysis , please comment below if you have any question.
The ENTRY in the market will be taken only if the condition of Plancton0618 strategy will trigger.

TFUELBTC the last bastion of the fall.first bastion of ascensionVirtual money has high profits and high RISK. THIS IS NOT AN INVESTMENT PROPOSAL. My personal opinion.
If you find this useful and want more FREE guesses.
Please show your support.
Press the Like button.
Leave your feedback to us in the comments section!
Thank you very much for your support.
Let us know how you see this opportunity and forecast in the comments.
Abundant earnings
