Apple stocks are probably Bearish next week - SELLApple stocks reached a strong up trend resistance on weekly.
Prices are likely to go down next week if the prices fails to break 328.09.
Weeklymarketsanalysis

GBP/USD: Your OPPORTUNITIES for the WEEK Hey tradomaniacs,
this is just meant to be a weekly preparation and shows that GBP/USD is currently showing an interesting scenario!
Plans are noted in the chart so there is not much more to add. ;-)
Make sure to note that you need an confirmation for each scenario.
LEAVE A LIKE AND A COMMENT - I appreciate every support! =)
Peace and good trades
Irasor
Wanna see more? Don`t forget to follow me.
Any questions? PM me. :-)

$USDCAD Potential longThe Usd/CAd is a correlation pair, that usually moves opposite to the Aud/USd and oil. Last week bullish candle stick and supported by 1.4000, the pair seems to be ready to test the 1.4500 over the coming weeks. As long as the pair stay supported by a daily close of the weekly low 1.3900. The pair stays bullish.

Forex Weekly Forecast 18th-22nd May 2020 (FX Pairs and Gold)Welcome to Profitlio Trading!
What's up traders! Thanks for Jumping back on my Analysis, Traderchamp is here on your Service, Also hit thumbs up and support the work.
Take a look on my Weekly Forecast and How I planned my added watchlist for the week ahead! Feel free to drop in your comments right down below and share this with your friends! But still Sketch up your own trade setup before you take off. Good Luck!
Profitlio Trading ( Since 2014 in Financial Markets )
________________________________________________
Traders Disclaimer: Non of our analysis or trade setups being shared here on tradingview is a trading advice. As we keep on weekly updates with our predictions and expectations. We may take them as a trade only if trade setup meets the required criteria ( Confirmations ). Unless we will never take them as a trade if it never reach our trading requirements.
Take them at your own risk as trading is highly risky and you may loss your investments. Our trades are based on Swinging and Mid to long term approaches. All trades executed will be handled under the name of Profitlio Trading only.

NZD/USD Short on a weekly close here!!!The New Zealand weekly close is looking at a shorts to test .57 the lower Bollinger band. The Macd on the daily crossed down for the first time since March 26. Hope this was helpful. Happy Trading!
Remember to like, comment, follow, and share.
Let's make money together!
Dr. Lydia


GbpJpy bearish ScenarioThe bearish scenario for gbpjpy :
gbpjpy has been pushing up after a big fall....but I don't think it has the strength to continue its bullish movement.
There is bearish divergence since the start of this uptrend and the market is exhausted..it is also at a strong resistance level and from here a fall I very likely
If this zone is not broken then my previous bearish set ups are still valid.

Big potential profit of the week +1k pipsGBP/AUD is overbought levels in weekly rsi, DeMarker, and bb
Weekly MACZ-Vwap crossover for short-sell
Weekly Moving averages are crossing for short-sell
1.800 take-profit target and 1.9320 stop-loss
Retail sales expected bullish for AUD later
Bearish expected construction for GBP later
NFP is bullish expected so GBP/USD are short-selling

USD/JPY: Your OPPORTUNITIES for the WEEK Hey tradomaniacs,
this is just meant to be a weekly preparation and shows that USD/JPY is currently right at a significant level.
If the Key-Resistance-Zone can`t hold and price breaks through trendline we could get a potential BUY-SIGNAL!
If the market rejects of the Key-Resistance and Trendline we could get a potential SELL-SIGNAL!
LEAVE A LIKE AND A COMMENT - I appreciate every support! =)
Peace and good trades
Irasor
Wanna see more? Don`t forget to follow me.
Any questions? PM me. :-)

EUR/USD: Your OPPORTUNITIES for the WEEK Hey tradomaniacs,
this is just meant to be a weekly preparation and shows that EUR/USD is currently right at a significant level.
If the Key-Resistance-Zone can`t hold and price breaks through trendline we could get a potential BUY-SIGNAL!
If the market rejects of the Key-Resistance and Trendline we could get a potential SELL-SIGNAL!
LEAVE A LIKE AND A COMMENT - I appreciate every support! =)
Peace and good trades
Irasor
Wanna see more? Don`t forget to follow me.
Any questions? PM me. :-)

NZD/CHF: Your OPPORTUNITIES for the WEEK Hey tradomaniacs,
this is just meant to be a weekly preparation and shows that NZD/CHF is currently right at a significant level.
If the Key-Support-Zone (CHECK WEEKLY CHART) holds and price stays inside the FLAG-PATTERN we could get a potential BUY-SIGNAL!
If the Key-Support-Zone can`t hold and price breaks out of the FLAG we could get a potential trendfollowing breakout and a SELL-SIGNAL!
LEAVE A LIKE AND A COMMENT - I appreciate every support! =)
Peace and good trades
Irasor
Wanna see more? Don`t forget to follow me.
Any questions? PM me. :-)

NZD/USD: Your OPPORTUNITIES for the WEEKHey tradomaniacs,
this is just meant to be a weekly preparation and shows that nZD/USD is currently right at a significant level.
A support above the trendline would confirme the breakout and could be a potential BUY-SIGNAL!
A break below the trendline and out of the rising-wedge would be a potential SELL-SIGNAL!
Hope this will help you to get prepared for the next week. :-)
LEAVE A LIKE AND A COMMENT - I appreciate every support! =)
Peace and good trades
Irasor
Wanna see more? Don`t forget to follow me.
Any questions? PM me. :-)

Weekly US Market Update | Week Ending on 1st of May 2020Hello everybody! Welcome to another episode of Weekly Market Update. Let's get started with the performance of the major indexes of Wall Street for the week ending on 1st of May 2020.
The Dow Jones Industrial Average closed on Friday with a loss of 2.55%, losing 622.03 points and closing at 23723.69. On a weekly basis the Dow Jones had a loss of 0.22% while from the start of the year it has a loss of 16.87%.
The S&P 500 closed on Friday with a loss of 2.81% losing 81.72 points and closing at 2830.71 points. For the week the S&P 500 had a loss of 0.21% while it's YTD performance is -12.38%.
The NASDAQ Composite Index closed on Friday with a loss of 3.2% losing 284.6 points and closing at 8604.95. For the week it was down 0.34% while from the first of the year it is only 4.1% down. As you can see the NASDAQ composite has better performance than the other two major indexes.
The current market outlook right now is that we are on an UPTREND. An Uptrend that was confirmed on 2nd of April 2020, the date that we had our follow through day. A follow through day is a day of a new rally between 4th and 7th day with a gain of 1% at least and volume higher than the previous day. On 28th of April we had a distribution day on both Nasdaq and SP500. A distribution day is a day when a major Index falls 0.2% or more with volume higher than the previous day.
So we have 1 distribution day for the Nasdaq and 1 distribution day for the SP500. A lot of distribution days on a short term means weakness for the rally.
Nasdaq broke the Trendline Support (2). Personally I wouldn't be afraid if we have a pullback at our Trendline Support (1) and then the markets continue up. If this happens, it's normal. If it breaks the Trendline Support (1), more downside will happen. But the Friday's Candlestick shows that the market will fall a little more.
We remain on an UPTREND right now and we have to see if it will break the Trendline Support (1). As long as we are above the Trendline Support (1) we are ok.
See you next week for another Weekly Market Update!

Week in a glance: negative oil prices and sad stat dataThe main event of the past week, without a doubt, was the epic failure in the oil market on Monday and the drop of May oil futures quotes into a deeply negative zone (up to - $ 50 per barrel). We wrote about the reasons for this in our reviews. The bloodbath continued on Tuesday when the world's largest oil futures ETF fund decided to reposition itself from June futures contracts into longer terms contracts.
These events spread panic not only in the oil market, but also in the financial markets in general. At the same time, our confidence in the medium-term oil purchases is still here. Given that both crashes on Monday and Tuesday were related to technical issues, our global argument did not suffer from them. It is difficult to worsen the current fundamental background for oil. But it is to improve it. So we stay in buy position.
After the shock in the oil market subsided somewhat, economic data came to the fore. Which turned out to be worse than the most pessimistic forecasts. Indices of business activity in the Eurozone, the UK and the US came out just disgusting. As well as jobless claims figures in the United States (+ another 4.4 million).
In this regard, we definitely keep on recommend to sell in the US and EU stock markets.
An additional motivation for sales is the potential second wave of the pandemic, which, apparently, even without partial removal of restrictions, begins in Germany and Spain. In any case, a sharp jump in disease after weeks of declining is a very bad signal.
After retail sales in the UK demonstrate record drop in the entire history of observations, we recommend to sell the pound not only in the EURGBP pair, but also in the GBPUSD pair. That is, this week we buy EURGBP and sell GBPUSD. EURUSD sales also seem like a good idea in light of extremely weak data on the Eurozone and Germany in particular.
Bank of Russia cut the rate by 0.5% on Friday. The event, although expected, is definitely negative for the Russian ruble. And the fact that it has not yet dropped does not cancel its inner weakness and general doom to decline. So this week we will actively buy USDRUB. With the worst outcome, this will be a good hedge for our oil purchases. In 2020, the correlation coefficient between the Russian ruble and oil is 0.98, that is, with a probability of 98% a decrease in oil prices will provoke a decrease in the ruble.
The upcoming week does not promise to be simple. The publication of US GDP for the first quarter, meetings of key global central banks (the Fed, the ECB and the Bank of Japan), as well as a bunch of other macroeconomic statistics guarantee a surge in volatility.

Weekly US Market Update | Week Ending on 24th of April 2020Hello everybody! Welcome to another episode of Weekly Market Update. Let's get started with the performance of the major indexes of Wall Street for the week ending on 24th of April 2020.
The Dow Jones Industrial Average closed on Friday with a gain of 1.11%, adding 260.01 points and closing at 23,775.27. On a weekly basis the Dow Jones had a loss of 1.93% while from the start of the year it has a loss of 16.69%.
The S&P 500 closed on Friday with a gain of 1.39% adding 38.94 points and closing at 2836.74 points. For the week the S&P 500 had a loss of 1.32% while it's YTD performance is -12.2%.
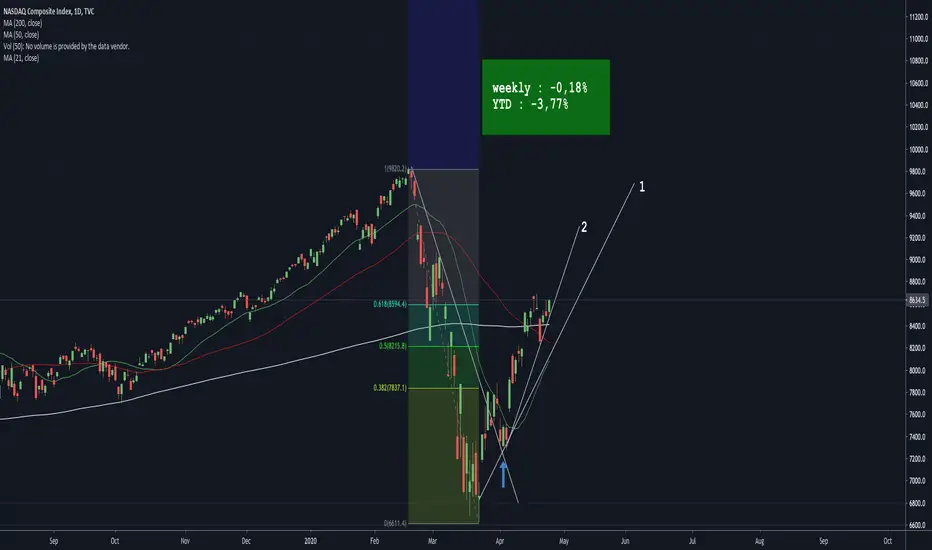
The NASDAQ Composite Index closed on Friday with a gain of 1.65% adding 139.77 points and closing at 8634.52. For the week it was down only 0.18% while from the first of the year it is only 3.77% down. As you can see the NASDAQ composite has better performance than the other two major indexes.
The current market outlook right now is that we are on an UPTREND. An Uptrend that was confirmed on 2nd of April 2020, the date that we had our follow through day. A follow through day is a day of a new rally between 4th and 7th day with a gain of 1% at least and volume higher than the previous day. On 7th of April we had a distribution day which has been deleted after the huge gain of 4% on 14th of April. A distribution day is a day when a major Index falls 0.2% or more with volume higher than the previous day.
We remain at 0 distributions days, which is a positive sign for the market. A lot of distributions days on a short term means weakness for the rally.
Personally I wouldn't be afraid if we have a pullback at our Trendline Support (1) and then the markets continue up. As we told on our previous Weekly Market update we are on 61.8% Fibonacci Level, we crossed the 50 moving average and on Friday 17th of April we saw a pinbar . So there was a 65-70% probability for the markets to have a pull back to the Trendline support as it happened. But now we have also a test at Trendline Support (2).
We remain on an UPTREND right now and we have to see if it will break the Trendline Support (2). If this happens then it may move until Trendline Support (1).
See you next week for another Weekly Market Update!
Weekly US Market Update | Week Ending on 17th of April 2020Hello everybody! Welcome to another episode of Weekly Market Update. Let's get started with the performance of the major indexes of Wall Street for the week ending on 17th of April 2020.
The Dow Jones Industrial Average closed on Friday with a gain of 2.99%, adding 704.8 points and closing at 24,242.5. On a weekly basis the Dow Jones had a gain of 2,21% while from the start of the year it has a loss of 15,05%.
The S&P 500 closed on Friday with a gain of 2,68% adding 75 points and closing at 2874.57 points. For the week the S&P 500 had a gain of 3,04% while it's YTD performance is -11,03%.
The NASDAQ Composite Index closed on Friday with a gain of 1.38% adding 117.8 points and closing at 8650.1. For the week it was up 6,09% while from the first of the year it is only 3,59% down. As you can see the NASDAQ composite has better performance than the other two major indexes.
The current market outlook right now is that we are on an UPTREND. An Uptrend that was confirmed on 2nd of April 2020, the date that we had our follow through day. A follow through day is a day of a new rally between 4th and 7th day with a gain of 1% at least and volume higher than the previous day. On 7th of April we had a distribution day which has been deleted after the huge gain of 4% on 14th of April. A distribution day is a day when a major Index falls 0.2% or more with volume higher than the previous day.
So we have 0 distributions days, which is a positive sign for the market. A lot of distributions days on a short term means weakness for the rally.
Personally I wouldn't be afraid if we have a pullback at our Trendline Support and then the markets continue up. As you can see on the graph we are on 61.8% Fibonacci Level, we crossed the 50 moving average and on Friday we saw a pinbar. So there is a 65-70% probability for the markets to have a pull back to the Trendline support. We have to see also the earning season. If the results are not good, the pull back has more probability to happen.
But whatever happens, we are on an UPTREND right now.
See you next week for another Weekly Market Update!

GBPJPYWHAT DO YOU TRADERS THINK ABOUT THIS ANALYSIS/OBSERVATION ON GJ? COMMENT DOWN BELOW AND GIVE IT A LIKE IF YOU ENJOY THE BREAKDOWN -

How near is the END? S&P 500Look on the behavior of DMI on the previous crashes, it keeps falling while the index is falling as well and RSI builds up a bullish divergence. It does not necessarily mean that history repeats itself, just pointing this out.

NIFTY weekly analysisNifty CMP is 8083
* If you see the weekly RSI, then it will show nearly about 15 indicates (nearly about all time low) that there is no strength is left to go further downside (Below 7500 level).
* If Nifty breaks the 7500 level then it will clearly indicates strong bear run into the market and could go around 6300 level.
* Now sudden fall in the market might not seen further as it factored previously and it may take a pause in the range of 7900-8700 levels for a long time period of 2-3 months.
* volatility in the market will reduce gradually from now and it will stabilize as clearly the chart has very small strength to go further downside and may take reversal.
* Right now nifty is standing nearly at the retracement level of 78.6% from 2016 to 2020 bull run. Already broken the so called golden ratio of 61.8%
* Nifty might go under a long sideways zone of 8500-11000 level for the next 2-3 years
* whatever the situation occurs like invention of coronavirus vaccine, then also i am not seeing the further bull run from now onward to 12500 level for the period of 1-2 years.

Eurgbp bullish & Bearsih scenariosPrice is currently below a strong support line. if price closes above the line I am expecting a bullish response and if it closes below im expecting a bearish move.
There is slight bearish divergence present.

GBPUSD SHORT SET UPGbpUsd has made a strong push up and is in a phase of consolidation. I strongly fell the market will reverse from here...
and anyways I don't think the situation in Britain in regards to this Covid-19 is getting any better so it might be a good idea to hold long term gbp sells

GBPJPY 1h timeframe analysis GbpJpy has made a strong push up but has lost its bullish momentum and has reached a strong resistance zone + the 50% fib retracement level.
Im expecting a push down to the recent low and possibly a down trend continuation. Trail profits.

XAUUSD continued push down?Xauusd has made a sharp move down...can we see a continued down trend after a retracement? let me know what u think, share your analysis in the comments
