SHIB - Lesson 15 this is how to read the chartUsing Lesson 15 to read the chart (annotations in sync with chart):
1. Support (coming from daily chart)
2. Largest down wave (buyers could be in there)
3. Placed AVWAP wait for the price to cross upwards and pull back
4. PFBL Long signal on the pull back and up we go
Enjoy !
Weiswave

AAVE - Lesson 15 said Long and the pull back another LongReading the chart using Lesson 15 and Exit from Range methodology (annotations in sync with the chart)
1. Fib Location (buyers might enter)
2. Largest down volume wave (potential buyers in there) - Placed AVWAP at the beginning of the down wave wait for price to cross upward and pullback
3. Entry Long with PRL signal - first target fib closed with profit
4. Fib was reached and pull back started
5. PRL long on AVWAP acting a resistance
6. This my last Entry using strategy Exit from Range with a Plutus signal.
This is a risky Long since we are on Fib area, but I will take the risk.
Enjoy!

DodgeCoin - Speed Index is telling me ShortReading the chart
1.Location: Fib + touch AVWAP low
2. Speed Index numbers at top on the High side (red numbers) which means Hard to Move Up.
3. PRS Short signal
4. If we do not get stuck into range and break it downwards , it's Short!
Enjoy! Reading the chart with Speed Index!

Wyckoff Up-Thrust - This is how to identify using Speed indexClassic Wyckoff Up-Thrust formation, this is how to read it using Speed Index (annotations in sync with the chart):
1. Fib Area - this is where sellers might come in
2. FU - Fast Up wave with SI 0.4F
3. Next up wave with an abnormal SI of 1.0S while the average speed at 0.5, which means price has a hard time to move up (more sellers on the up move). Following the up wave on the down move we have double Short signals WU-Wyckoff Up-Thrust and PRS-Plutus Reversal Short and this where we enter.
I hope this was helpful. Enjoy!

LTC - This is how a Wyckoff Spring look like when reading SI Reading the chart: Location, Structure, Speed Index and Plutus signals
Annotations in sync with the chart.
1. Major Fib
2. Support
3. Breaking Support with a false break - Fast wave = low Speed Index 1.1
4. Down wave, price has a hard time to move down = high Speed Index 2.9 (buyers absorbing sell orders)
5. Entry a Wyckoff Spring WS signal from Plutus
.... and up we go!!!

HOW TO:Major Update Weis Wave with Speed Index Signals and TypesThis is an information video about the 6 new features of Weis Wave with Speed Index - Signal v6.0 and Weis Wave - Wave Types v3.0.
These versions will release at end of this week or next week.
Available to answer any of questions that you might have!!!
Enjoy!

ETH- Etherium - Are we getting ready to Short?1. Resistance Level - Triple top (1st one not visible)
2. Abnormal SI at the top 17.8
3. Waiting for a Plutus Short Signal to Enter
Enjoy!

PEPE - Trade is on the way - Reading Speed IndexChart reading using price location, volumes and Speed Index:
1. We are on Fib (buyers could enter here)
2. Fast down wave on the way to Fib with SI at 16.7 while the average was 26.3
3. Next down wave it's a very slow wave and it look like an HTMD (hard to move down) with a very high Speed Index of 47.8 while the average was 26.8 (probable buyers absorbing sell orders). This is change in Behavior , but in order to confirm the reading it would nice be for the forming down wave to finish with a high Speed Index.
4. AVWAP blue lines act as resistance. Finally to enter long we need price to break resistance level marked with the black line, otherwise we might get stuck into a range and you never know what's going to happen next.
Patience! Enjoy!

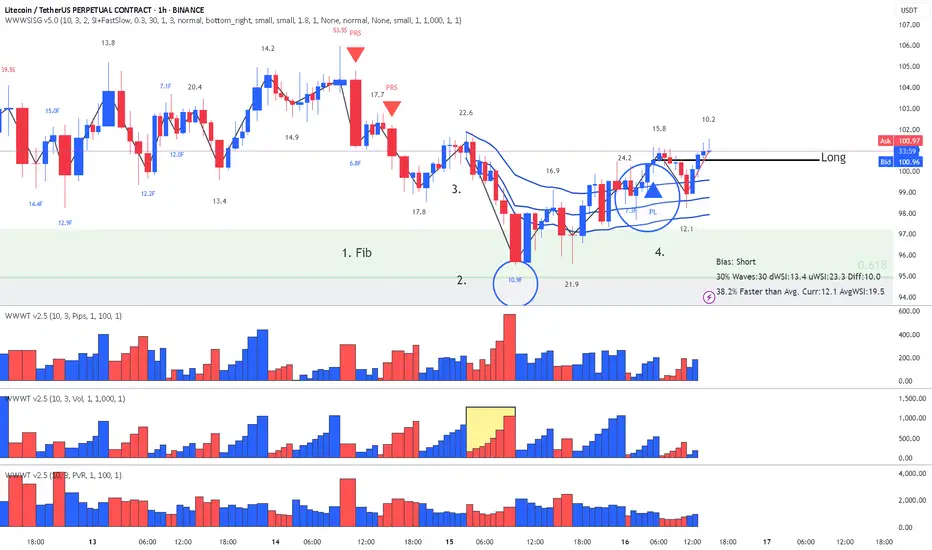
LiteCoin-LTC Lesson 15 said Long - This is why!Lesson 15 Methodology chart reading:
1. Fib Location (buyers might enter here)
2. Largest down volume wave (buyers could be in there) with increasing PVR
3. Placed AVWAP at the beginning of the down wave and wait for price to cross upwards, wait for a pull back and a Plutus Long on the pull back.
4. Entry Long on the PRL signal.
Enjoy!

DOGE - Entered Short using Lesson 15 MethodologyThis is how I read the chart using Lesson 15 Methodology:
1. Fib Location (sellers might enter)
2. Sellers started to be visible on PVR when price entered Fib 50-61.8 area and on the break of 61.8
3. FU - Fast Up wave - Fast SI of 3.4F and that's our Fake break of Fib
4. After the false break we have the highest down volume wave, that's another indication of sellers
5. Placed AVWAP at the beginning of the fast wave and wait for the price to cross downwards, then pullback and respect AVWAP as resistance.
6. Entry Short of PS (Plutus Short) signal
I have already moved my order to Break-Even because are entering another Fib location.
I hope this helps. Enjoy!

How to read Speed Index and Identify Potential Reversals!In this chart we removed all Plutus signals and we are reading just Speed Index and weighted Averaged Speed Index. The purpose is to identify a potential reversal at a significant location such as Fib.
There are two numbers visible on every price wave swing, the first one is the wave's Speed Index and the second one is the weighted average Speed Index of the 30 waves back.
What do we need to identify for a potential reversal? The answer is Abnormal Speed Index compared to the weighted average Speed Index, which means that something is cooking.
Reading the chart:
- Look at highest volume up wave hitting the Fib area, Speed Index at 6.2 while the average at 5.0 , higher than the average but not too abnormal.
- The next down wave is where it gives you an Abnormal Speed Index of 10.4 with an average of 5.2. This is what we call their first Push Down, now definitely something is cooking.
- The next up wave has a Speed Index 10.4 (Abnormal) with an average of 5.2 and that's we call a Hard to Move Up Wave (HTMU).(by coincidence these two waves have the Speed Index and average Speed Index)
- Finally to make sure that all these were sellers we need price to break these waves.
To Summarize this is how we approach this Short trade (annotations are in sync with chart).
1. Fib Location (potential sellers might enter)
2. The highest volume up wave to get to Fib
3. Placed AVWAP at the beginning of this up wave, because we will go short if price goes below AVWAP with the appropriate Speed Index justification.
4. First Push Down wave with SI 10.4 with AvgSI at 5.2
5. HTMU (Hard to Move Up) wave with SI 10.4 with AvgSI at 5.2
6. Our entry Short breaking the structure of the previous waves and cross AVWAP downwards.
I hope this helps all you Weis Wave Speed Index owners. Enjoy!!!

LiteCoin -LTC - Lesson15 Methodology Signaled LongChart reading using Lesson 15 methodology:
Annotations in sync with chart
1.Location : Fib 50-61.8 are (an area that buyers can step in)
2. Fast Down Wave with SI 10.9
3. Placed AVWAP at the beginning of fast down wave and wait for price to cross upwards and pull back to it.
4. Wait for a Plutus Long signal to enter and in this case it was a PL.
Enjoy!
PEPE - This is why price explode - Speed Index ReadingThere is always a reason why price explodes either true or fake. The criteria to look at are:
- Location - very important - where is the price locate - higher probability trades accomplished when the price leaves a significant location such us Fib, Sup/Res, AVWAP
- The volume waves - nothing moves without volume - sometimes is not so visible by the volume waves alone because they distribute or accumulate little by little, that's why we have Speed Index
- Reading Speed Index
- The proper entry signal
In the attached chart I will demonstrate how I read it using the above criteria (annotations are in sync with the chart):
1. Price entering Fib Area 50-61.8 - possibility of buyers to come in
2. Price touching AVWAP (three blue lines) coming from the bottom of a previous swing acting as resistance - another possibility of buyers to come in.
3. Speed Index 6.4, that's an abnormal speed index , that what I call first push up or PU, price never drops below the beginning of this wave
4. Speed Index 11.1, that's another abnormal speed index and that's what I call a hard to move down (HTMD) . What's happening here is that all the sell orders are absorbed by buy orders and price breaks on the up wave the origin of the HTMD wave.
5. Finally the entry Long with a PRL (Plutus Reversal Long) signal an up,up,up, we go!!!
I hope my years of work helps you out on reading charts!
Enjoy!

LTC Long - Learn to read Weis Wave with SI- Target hit overnightLearning to read the chart using Weis Wave with Speed Index will help you understand how the market works. Speed Index is very valuable to understand if there is absorption happening in the market. Remember that absorption takes time, it takes hours or sometimes days, so you have to be patient. In this chart I will explain how to read this 1HR LTC chart using Speed Index and why we had this explosion in price. I have entered long (my target was hit overnight). Annotations on chart are in sync with my below notes.
Reading:
1. We had a high volume down move (buyers could be in there but I am not sure yet)
2. We have touched 50-61.8 Fib area - If buyers would like to enter this is a great area.
3. Speed Index 29 that's an Abnormal Speed Index. Why is it abnormal? Because at that time the average Speed Index of 30 waves back was 15. I call this as the first Push or the first absorption. Buyers are entering.
4. Speed Index 78.7 another abnormal SI -> more buying
5. Speed Index 37 on a down wave that's what I call a HTMD (Hard to move down) more buying and finally a PL (Plutus Long signal) breaking by a bit the previous resistance level. This is where I have Entered Long.
6. Another HTMD , hard to move down wave with Speed Index 32.2, more buying and another Plutus long signal PRL.
Therefore the explosion is completely justified because it has a history of several hours of absorption. If you were to read just volume waves you would not be able to see this coming Speed Index alerts that something is cooking and when the time is right you enter (PL signal)
I hope my above explanations helped you.
Enjoy!

This is how to read the chart using Weis Wave with Speed IndexReading the chart:
1. We have bottom down and we pull back with high up volume waves, approaching the Fib area. Notice how SI is increasing on the up waves as we are reaching Fib from 13.3 to 15.7 to 18.4 and last not able to break previous resistance at 20.4. This means sellers are absorbing all buy orders of people entering long thinking that the trend will continue.
2. Notice the up volume wave with SI 20.4 and respective pip move right above it which is small compared to the amount of volume used - This is absorption.
3. The highest PVR bar at the beginning of the down wave - more sellers
4. Entry Short on the Plutus Short signal
Notice all the Short signals following confirming the continuation of the down move!
Simple as that, if you are able to read the chart and not just following signals from an indicator.
Enjoy!

Litecoin (LTC) Lesson 15 said - This is How to Read the ChatLesson 15 Methodology Chart Reading:
1. Highest up volume wave (sellers could be there)
2. Placed AVWAP lines at the beginning of the wave
3. Wait for price to cross downward AVWAP line
4. Pull back with an Abnormal Speed Index of 24.1S , that's a hard to move up, meaning sellers are absorbing on the up move
5. Enter Short on a Plutus signal which in this case is a double signal WS (Wyckoff Spring) and PRS (Plutus Reversal Short)
Enjoy!!!

LiteCoin (LTC) - Chart reading with Weis Wave with Speed Index
Lesson 15 Methodology:
1. Largest up volume wave at the bottom after while (probable buyers but let's confirm using AVWAP and Weis Wave with Speed Index and it's Plutus Signals.
2. Placed AVWAP at the beginning of the previous down wave and wait for price to pullback to it.
3. Price Respects AVWAP.
4. Abnormal Speed Index 40.8 is a sign that price has a hard time to move down.
5. Enter Long on PL signal.
... and up we go!!!!
Target Fib area which was reached!
No entries now - Fib could risky!

Cardano (ADA) Long using Lesson 15 MethodologyAlready first target was hit and moved stop loss to BE.
Lesson 15 Methodology:
1. Largest Down wave on support (could have buyers in there)
2. Place AVWAP at the beginning of the down wave
3. Wait for price to cross upwards the AVWAP and pull back to it.
4. Wait for a Plutus long signal where in this case it was a PRL
and up we go!
Now this huge pin with the enormous volume worries me for sellers but since we got 1st target and stop is at BE I will let it run.

PEPE - Entered Long based on Lesson 15Lesson 15 Methodology;
1. Largest Down wave after a while (Buyers possible entering)
2. Placed AVWAP at the beginning of the down wave and wait to cross upwards and pullback
3. Enter on Plutus signal Long in this case PL
Stop loss below Low AVWAP line

Ehtereum (ETH) - Entered Long based on Lesson 15Lesson 15 Methodology;
1.Support Level
2. Largest Down wave after a while (Buyers possible entering)
3. Placed AVWAP and wait to cross upwards and pullback
4. Enter on Plutus signal Long in this case PL

ETHERIUM (ETH) - Monitor for a Possible Long using Lesson 15Lesson 15 Methodology
A few of the criteria have been met:
1. Support Level
2. Highest Up Volume Wave after a while
3. Anchored AVWAP at the previous down wave and priced crossed above
4. Price has pulled back to AVWAP
...and now I am waiting for a Plutus Long signal that will push price above AVWAP to enter Long!

DODGE - Short - This is how to read the short using Lesson 15Lesson 15 Methodology:
1. Fib 61.8 (sellers might come in on this level)
2. Highest up volume wave after a while (probable sellers inside)
3. Anchor AWVAP at the beginning of the up volume wave. Wait for price to cross downward and then pull back.
4. Highest down volume wave after a long time (sellers)
5. Price respects AVWAP acting as resistance
6. Enter Short on one more confirmation of weakness - Plutus Short signal PS
...and down we go!!!
Enjoy!

Copy Paste Lesson 15 on PEPELesson 15 Methodology
This trade is a copy paste from my previous post
1. Largest Up Wave (sellers might be entering on large waves-to connfim later on)
2. Anchor AVWAP
3. Price respecting AVWAP as resistance several times
4. Enter on a Plutus Short signal
....and down we go !!!
