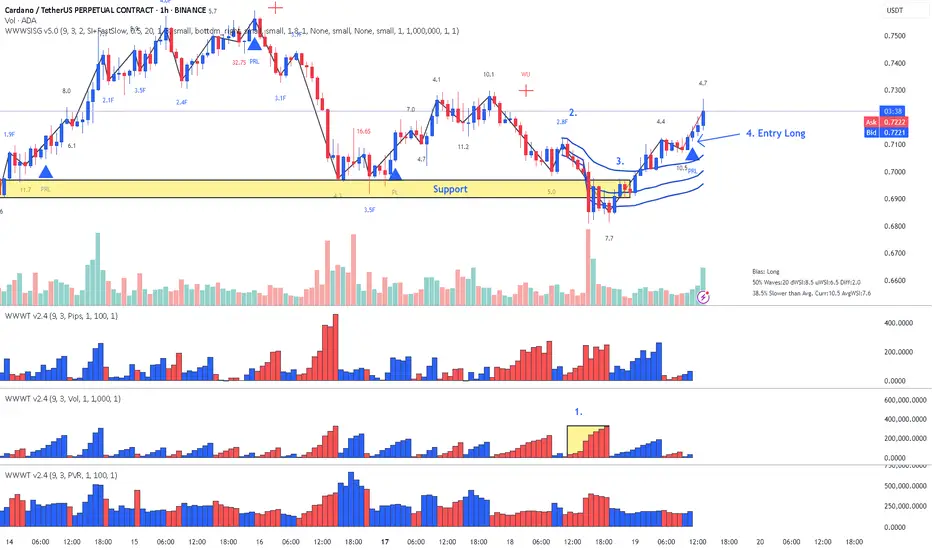
ADA (Cardano) Lesson 15 said LongLesson 15 Methodology (blue numbers on chart explained below)
1. Large Volume Down wave breaking Support (could be fake break -sometimes buyers come into large down waves but to confirm we follow next steps)
2. Place AVWAP at he beginning of the down wave
3. Wait for the price to break AVWAP upwards
4. Wait for the pullback and a Plutus long to enter.
Currently at Resistance level let's if we are going to break it or find sellers
Enjoy
Weiswave
DodgeCoin - Lesson 15 said Short after Fib - Wyckoff Up-thrustFollowing Lesson 15 methodology:
1. Location Fib Area
2. Fast Up Wave 5.1F Speed Index
3. Place AVWAP on the beginning of the fast up wave
4. Wait for price to cross downwards the AVWAP
5. Wait for a Plutus Short signal below AVWAP to confirm entry. In this case it was a double signal, WU (Wyckoff Up-Thrust) and PRS.....
.... and down go!!!
Enjoy!

LiteCoin Lesson 15 said LongThe Methodology:
Location - We are in Fib Ares
Largest down volume wave ( many times we have buyers on large down waves.
To confirm that there are buyers we do the following:
Place AVWAP at the beginning of the down wave, wait for price to cross upwards and finally wait for a Plutus Long Signal --------and up we go!!!!

Snoflake [SNOW] Wyckoff Bullish PatternsVery fundamental company. The last consolidation after very large drops is a good prognosis for an upward exit. It is necessary to focus on Wyckoff Wave Volume, which decreases at the bottoms. This means a decrease in selling pressure. There were two shafts with a very large purchase volume and a wave marked with volume 200. It was a very large sale that did nothing to the price. This sale was absorbed by buyers.
This security has typical accumulation features. In my opinion, it is on BUY with a target of $ 140/150
For more analyses using price and volume and the Wyckoff method, subscribe to the profile

Wyckoff Bullish Patterns - Accumulation (strong buyers action)VolumeDayTrader offers script of such indicators on TradingView. For more details check our profile or DM us.
Weis Wave is an advanced trading indicator used to identify bullish and bearish patterns in the market. It is based on Richard D. Wyckoff's methodologies and is typically used to analyze volume and price action. Here's how to recognize and understand bullish patterns using Weis Wave:
Key Concepts of Weis Wave
Wave Volume: This is the cumulative volume of each price wave. It helps to identify the strength of buying or selling pressure.
Price Waves: These are the movements in price, which can be upward or downward.
Recognizing Bullish Patterns
Rising Volume on Upwaves: When the volume increases on upward price waves, it suggests strong buying interest. This is a bullish signal as it indicates accumulation.
Decreasing Volume on Downwaves: When the volume decreases on downward price waves, it indicates weak selling pressure. This is also a bullish sign as it shows that sellers are not aggressive.
Higher Highs and Higher Lows: In a bullish pattern, each successive upwave will typically make a higher high, and each downwave will make a higher low. This reflects a strong uptrend.
Support and Resistance Levels: Pay attention to how the price reacts around key support and resistance levels. A bullish pattern often sees the price breaking through resistance levels with strong volume.
Example of Bullish Patterns
Accumulation Phase: This phase is characterized by a series of higher lows and higher highs, with increasing volume on upwaves. It suggests that smart money is accumulating shares.
Breakout with Volume: A significant bullish signal is when the price breaks above a resistance level with a large increase in volume. This confirms that buyers are in control.
Pullback with Low Volume: After a breakout, a minor pullback or consolidation with low volume is often seen. This is typically a continuation pattern indicating that the uptrend is likely to resume.
Using Weis Wave for Confirmation
Combine with Other Indicators: Use the Weis Wave in conjunction with other technical indicators like Moving Averages, RSI, or MACD to confirm bullish patterns.
Volume Clusters: Look for clusters of high volume on upwaves at key price levels to confirm bullish strength.
By analyzing these aspects, you can effectively use the Weis Wave to identify and trade bullish patterns in the market. Would you like more detailed examples or further explanation on any specific aspect of the Weis Wave?

GBPAUD - Possible Short to Continue
Reading the waves and Speed Index
1. After the High up Volume wave the reaction a Down volume wave with very high PVR
2. Fake Break with a very fast Speed Index of 2.5
3. Abnormal Speed Index of 15.4 with PRS signal = sellers
Price dropped to Fib , next is to monitor reaction on Fib, bias is to continue Short

USDCAD - Short
Reading the waves and Speed Index
1. Abnormal Speed Index of 14.8 = Sellers
2. Largest down wave with normal Speed Index = market agrees with move
3. 4. Large up wave but with high Speed Index 10.5 = Sellers
5. High Speed Index on the up move 8.0 = Sellers still forming but it looks like we are have a hard time to move up
Therefore Short

GBPJPY - Abnormal Speed Index - That's a Change on Behavior as David Weis would say. Very High Volume but with an Abnormal Speed Index 156.2 = meaning the price is not moving down easily.
PVR is increasing at the bottom= meaning more volume a price goes lower = buyers
Therefore the forecast is that we are going for another break and a move up.

GBPNZD - Wyckoff Up-Thrust and down we go!
We have hit Fib area
Fast Up Wave
and then Wyckoff Up-thrust signal -WU at the top and down we go
Correct entry already at 70 pips but I think it will continue

GBPAUD - Possible Wyckoff UpThrustSimple:
Broke a major resistance level - excellent location for a Wyckoff Up-Thrust
Price pulled back and the next up waves has a very high Speed Index of 27.9 which could mean price having a hard time to move up.
To confirm we did to break the blue line downwards to enter short
This is David's Weis quote "Trade is About to Happen" and book

EURUSD - Forecast to get to the FIb - ShortPVR high at tops = sellers at tops and no significant buying at bottoms
Fast wave up with 4.3 si - not justified probably fake
Very high of 31.5 = too muck effort little result
The forecast is to at least get to 50Fib which is 25 pips but can also get up to the blue line which is 70pips

EURNZD - Why did we start going up?Simple:
PVR indicator increasing as price goes down = buyers - Why? because we approach ......... Fibonacci Area!!!! -
You have been trained to trade at these levels , robots trade at this levels..

HOW TO: Identify a Buying wave vs. a Selling Wave HOW TO: Identify a Buying wave vs. a Selling Wave using Weis Wave with Speed Index
One excellent interpretation is noted by @tdtrdview, of course there are more.

EURNZD - The diference between these up wave is............Coming from my previous idea:
Even they are both up waves, Wave 1 is buying wave and Wave 2 is a selling wave. How do I know?
Speed Index wave 1 normal speed index of 5.0 , wave 2 abnormal speed index 12.9 (Effort vs Result). The average speed Index is 7.5.
I hope you are Short.
That's exactly what David Weis book title "Trade is About to Happen" .
Enjoy!

EURNZD - What's the difference between these waves?What's the difference between up wave 1 and up wave 2, apart from the fact that wave 2. is a bit larger?
Looking forward for your comments
Tip: look on the chart.

NZDUSD - Is this a trend change? Story:
Location is Excellent - Fib touch
Bottom Speed Index a bit on the high side - I would preferred them to be higher to denote hard to move down moves.
Immediate reaction after the last high down volume wave the largest up volume wave.
The up waves are increasing
What we need now is a retracement with small volume to go long. There is chance also to retest the level, no one knows. The forecast is Long.

GBPUSD - Let's get to that Resistance Level - Long 60 pips targeSimple story:
First of all this is classic entry as TTVW says - Exit from range with PRL
The rest of the story
Green waves larger than red waves
Speed Index on the high side at the pullback = Hard to move done (Effort vs Result)
No funny stuff at the top yet
Therefore we should be heading for the resistance level approximately 60 pips

GBPAUD Time to Short - Speed Index AlertThe story :
In that huge up wave there were sellers! Why? Speed Index is telling us why. That was a hard time to move up wave 18.2 SI at the top is Effort vs Result (Wyckoff ) . The average Speed Index is 10.5 therefore the 18.2 is an Abnormal SI. If we break the beginning of the 18.2 wave downwards 1.92627, we are going down.

AUDUSD - Let's get to that Fib Long
Buyers have stepped in. High Up Volumes green is everywhere.
That last down wave with high volume has a high Speed Index 16.4, that's hard to move down
Plutus signals also Long
We should be reaching at least he Fib area

HOW TO: Lesson 5 - The Importance of ConfluenceLesson 5 - The Importance of Confluence
This video explains what is confluence in trading, identifies confluence structural elements and provides guidance on how to put all the pieces of the puzzle together to increase trading success rate.

GBPUSD - Going for Long - Are we going to break that ResistaceThe Story :
We have hit resistance level and started going down
Hit the Fib Area and started going up again
On the way down we see an very high Speed Index - price is having a hard time to come down
Finally a PRL long signal shows the way for a long - already at 55 pips
Now the question is if we are going to break that resistance level considering the background the answer is yes but it's a bit risky because there another Fib area coming up right above this one

EURCAD - This could be a Trend Chnge
EURCAD has broken a major resistance with a very large up volume wave.
The Indicator produced a Wyckoff Up-Thrust signal but the slow wave it's only two bars
Price comes back in below resistance level
Highest down volume wave
Usually this formation a very large up with a false break and a fast down results in a trend change. We need to see the reaction if we break the low of down wave , especially with a Plutus signal I will go Sshort

GBPNZD - Did you entered Short or not yet?After hitting Fib Area 61.8 the Short signals from Plutus started PRS and PS.
The largest down wave after a while.
The large down move wave at regular Speed Index 8.8 which means market agrees with the move.
More pips to go!
