EURAUD - Probable Wyckoff Spring - The ForecastLearn to read the chart.
The Story:
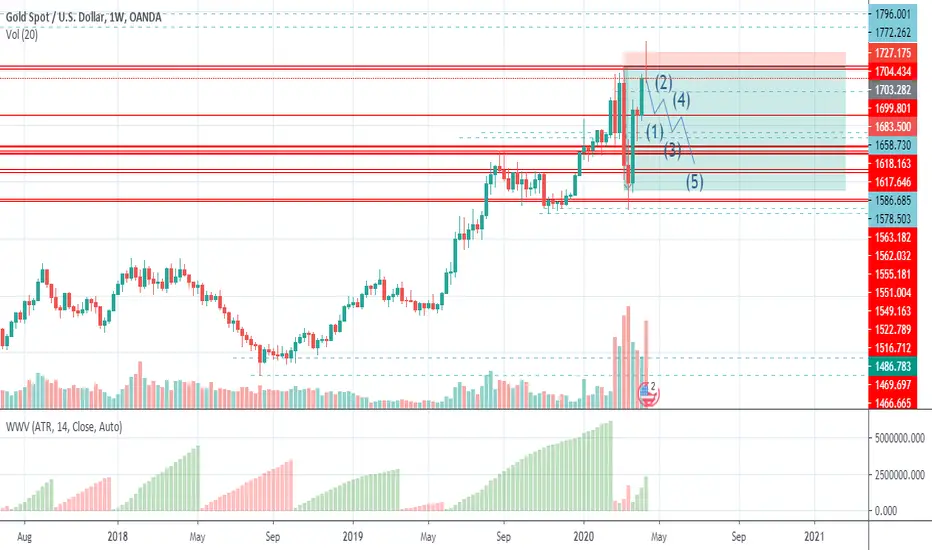
We are balancing on a significant Fib 61.8
Last SI before the fake break of Fib quite High at 17.6, probable buyers
Fake Break = Wyckoff Spring formation start. PVR quite high
Plutus comes with a Long signal PRL
Abnormal SI of 21.0 = buyers on the way down
The reaction : large up volume wave with the corresponding pip move
The Forecast and possible entry is shown on chart. If we break that Entry Level line the Spring is confirmed.
Weiswave

USDJPY - Still in Range No Entry because we are in Range, waiting for Plutus on Exit only, no the bias is neutral!

USDCAD - Coming from a previous post- another signal more pips More PRS signal more pips. It has reached 202 pips from the Abnormal Speed Index and stopped exactly were expected, where else, at support!!!

EURNZD - Classic textbook entry - Exit from Range with PRSThe Story:
1. Largest Linear Volume Down Wave
2. Ranging for a few days
3. Plutus provides the signal PRS = Plutus Reversal Short
That's a text book entry for the SI traders and their methodology.
110 pips so far
Enjoy!!

EURNZD - All Signals Point to LongAll the charts say a story, you just have to be able to read it!
The Chart Story:
Progressive Volume Rate increasing as we approach Support
Plutus also signals PL signal = Long
High Volume waves after a while

BTCUSD Pullback to Neckline Accomplished. 50% drawdown expectedSigns of reversal, market structure choppy. Flat correction in consecutive double three zig-zags on the upper boundary of a macro diagonal after an complete impulsive wave; lower highs with decrease of volume, showing lack of confidence by the buyers-side, as shown on Weis Wave Volume indicator; overbought condition.
Harmonic patterns: potential bearish Crab leading to supply. If price action don't reach this area breaking volume POC, a least a back-test to VWAP from the higher high can be occur, leading by an 3-Drives pattern. High possibility of a POC back-test @ preferencial 14,6% Fibonacci retracement zone. Plus AB=CD bearish projection leading to the micro demand zone.
Strong hidden bearigh divergence on CCI oscillator.
Short position swing perspective: if price broke weekly pivot level @ 21009 with strength, possible intermediary target @ 18229 support. The price can retrace to the pivot.
MACRO
Weekly price action: the price made a strong bearish candlestick pattern Harami Cross.
The price is trading in a broadening structure like a ending diagonal formation.
Weekly scenario: price pulled back to neckline from the major Head and Shoulders back-testing the VWAP from ATH. In a potential fractal from the 1st test of this VWAP, in which the same Harami Cross performed in an overbought condition, showing that a strong supply was reached.
In addiction to the fractals, I've selected the local choppy structure and calculated the pivots by the sum of high+low+close:3, resulting in a key level exposed, in which price retraces before continue the decline in an impulsive bearish leg-Down.
Expectation: possible lower low if a throw-over occurs in a breaking of the expanding diagonal structure. this can be lead price to touch the same 88,6% Fibonacci level as occurred historically in all corrections. Therefore, a drawndown of 50% to the 11k level seems strongly possible,
---------------------
Bitcoin is about to complete it's first Wave 1 Grand Super Cycle bull run, in which actual point seems to be forming a ending diagonal of 5th impulse wave.

Natural Gas triangle formationThere is a big contracting triangle on the chart of NG. The Weis Waves give a clue that most likely the uptrend will be continued.

DOGE/USDTDoge is in an interesting accumulation formation, and at the moment its price is below the Ichimoku Cloud, which may imply a new setback before it crosses it. I understand that the Cloud above the price acts as a resistance region, and the more dense it is, the more difficult it overcomes it. With that in mind, we can see that in this case it is not that dense, so it does not seem like a strong resistance (I may be mistaken, of course). So, the best thing to do is to wait for a price consolidation above the Ichimoku Cloud for a safer entry and with greater profit potential.
It is also important to note that the volume has been falling in recent days and at any time we may have gained volume due to the optimism that the market has shown today (if it will happen ... Well, I am not a seer lol).
WT_CROSS indicates upward movement, Weis Waves has been forming small and almost inexpressive waves, considering also the volume traded and the fact that the price has formed an area of accommodation, I believe we can see the price evolve considerably, if not in the next hours, but in the next days.
Important to note: always do your own research and remember that the decision to follow this idea (which is personal) is not mine. Therefore, this is not a financial advice.
Good luck!


Weis Wave with Heikin-Ashi Trend TraderHi all,
This is my first post on Trading View so I hope I lay this outright.
What we have here is Heikin-Ashi candles with a Weis Wave indicator which triggers buy and sell signals. The strategy works best on 5 min chart.
The Heikin-Ashi is important for the volume indicator to work properly in this case
I have had issues where the entry and exit price of the trades changes due to the issues of backtesting with Heikin-Ashi so...
Does anyone know how I can stop the entry and exit price changing in a backtest? Any comments for constructive discussion would be appreciated.
Thanks!

XAUUSDAs simple as that just because a big size of pendingorders in market thats why market reject the level and as you can see market is totally in down trend for next 1 month
EURUSDSimple method for buying side market you can see a to bar reversal if the sign was confirm that we will go for a buy side and if markets break this level then we will go for selling side

Overview of Renko Weis Wave Volume IndicatorI outline the several features and recent additions to the Renko Weis Wave Volume Indicator . Enjoy.


Bitcoin: 50k? 8,360-9480-10640 to contend with first. 6:1 chanceWe have roughly a $1,200 gap between the levels, and to clear 3 levels will have odds of 3:1, and seeing as it failed twice before ill multiply those odds by 2, so 6:1. Only Volume will confirm a move.
- The indicator is Weis Wave Quantum Volume

PundiX – NPXS – over 700% profit possible(long) – pure TAHi Guys!
Today we want to share with you our recently discovered project.
This time we made technical analysis only.
First thing which brought our attention was rising volume on Binance.
During last 24 hours it was over 1300 BTC. Nice!
So looking at the chart we can see, we are very low according to Fibonacci scale.
This is actually the lowest level since 15 months and now we can see signs of movements.
On Weis Waves indicator we can see rising green waves and decreasing red waves. It means that supply evaporates slowly and demand is growing. This means one thing - greater pressure on the price which should result in the price growth.
MACD chart – this is very strong positive divergence. Although price was constantly decreasing over last months, MACD’s bottoms were each time higher. Such reading of the divergence index predicts future trend reversal. This may happen now.
On the second chart we marked Ichimoku Cloud. As you can see we crossed TenkanSen but we need couple of bars more in order to be sure we did for good and we are significantly above Tenksen (red line). Moreover some time ago TenkanSen crossed KijunSen which is another bullish signal.
So Traders! Keep an eye on this project. We know that generally market is unstable and we have to be aware of that. But this time we can earn some money as we touched the bottom of the price.
What do you guys think? Have you already bought it? Or You just observe?
Thank you for being here.
Do not hesitate to comment and like.
Click follow if you like our job! :)
HUGE Hugs!
WBM Team

BNB - Binance coin – will we manage to get any profit next weeksHI Guys.
As BTC dropped down there are literally few coins which bounced off and probably can give us at least small profit.
One of these is Binance coin. BNB has just bounced off from a big support. It didn’t cross this support since end of April 2018. It tried 3 times but luckily didn’t manage. This time we also bounced off from 0.0014336.
When watching Weis Wave chart we can see clearly new demand waves has shown up. Small supply on the horizon.
We also broke the resistance marked up by all local previous heights (red line).
When observing Ichimoku Cloud indicator we can see price broke TenkanSen (red line). Let’s wait if it was for good. We need couple of bars more.
Moreover positive info from MACD – bull’s cross just happened.
What do you think guys?
Will it be possible to earn some money investing in BNB?
You opinions are highly appreciated. :)
Thanks for being here.
HUGE HUGS!
WBM Team

BTC – some positve news. All indicators say BUYHi Traders!
We hope you are doing well.
Seems like BTC is getting better. After many bad words from the prominent people from finance, BTC not only didn’t go down but also managed to grow up a bit.
Taking into account the fact that major cryptos are sluggish we may think many investors sold their coins in favour of BTC.
Let’s look at the chart.
We have a couple of bounce offs with the latest reaching $7800. Still solid growth as we can see on the Gann Fan. Much over 1/1 level which is very good and solid sign.
Moreover demand is growing on Weis Wave and no supply on the horizon.
When using Ichimoku Cloud Indicator we can see clearly we are above the cloud and also chart has crossed Tenkan-Sen (red line) and Tenkan-Sen crossed Kijun-Sen (blue line). This is very strong and safe signal to BUY. Let’s keep an eye on this indicator as it provides rally safe trading.
MACD – we observed positive convergence. We can also distinguish that uptrend is getting stronger.
We measured their trend – look at first 3 dips. When linked, they form 13 degrees trend. When linking 2 last dips we can see they form 46 degrees trend which almost 3 times more. This is a massive change and we may expect to observe price rise.
What are your feelings guys?
Do you feel the same? Are we close to something big?
Thank you for your likes, support and comments.
Thank you for being here.
HUGE Hugs
WBM Team!

ARK – 516 % Earnings possibleHello Guys!
Here it is another much undervalued coin.
As you can see on the chart according to Fibonacci levels we are very low (same level as in December 2017). Same levels were observed in August 2017 before massive rally when one could earn nearly 600%.
So traders look now at Visible Range. We are below much below “fair” price and in the lower part of the Volume Area. It means 70% of all traders bought their coins over the current price. They won’t be willing to sell until they get their money back. Fair price is established at 0.00034035 BTC
What’s more we have double bottom already formed waiting for a great rally. Stay vigilant and observe the volume and price. Last time rally took us only 6 weeks so be prepared.
What’s more we have crossed MA50 which is very good sign.
On Weis Wave we can see volume rising and no supply therefore we have stronger price pressure. We need more volume to obtain such levels as in 2017 but stay patient and positive.
On MACD chart we can see positive divergence – all bulls’ crosses are higher from the previous ones ones.
So guys. This might be very interesting trade with great potential.
Observe levels such as 0.00026801 than 0.00035000 and than our first Fibonacci target 0.00043297. We have to break them all in order to break supports and obtain confirmation of the uptrend.
Fibonacci levels:
Target 1: 0.00043297
Target 2: 0.00058805
Target 3: 0.00071339
Target 4: 0.00083872
Target 5: 0.00101717
Target 6: 0.00124447
Thank you for all support. You are the reason why we are making this.
If you like our job give us a like. Do not hesitate to comment. We are very open and value your contribution!
If you don't want to miss out updates don't forget to follow us!
HUGS!
WBM Team.

Qtum – 450% possible EarningsHi Guys!
here is another intersting idea. So exited to share all those ideas with you.
Qtum (Quantum) is a project coming out of China that aims to make decentralised blockchain technology easy to deploy for enterprises. It provides a complete blockchain stack and is able to execute smart contracts and decentralised applications like the Ethereum blockchain.
They use Proof-of-Stake algorithm. It is backed by some highly prominent members of the blockchain community such as Anthony Di Iorio, Xu Star, Bo Shen, David Lee, Jehan Chu and Roger Ver.
Their team coinsist of 30 people mainly IT engineers. They are also backed by the 12 backers and advisors.
They managed to gather decent community – nearly 170K Twitter followers and and 14,5K Reddit followers.
Source code repository activity is ranked by Coingecko at 84%
They have a 7365 global nodes which nearly 5000 are located in China.
Qtum conducted its crowdsale in March 2017 where 51 million Qtum tokens were sold in 117 hours raising 11,156 BTC and 77,081 ETH (~US$15.6 million)
Technical Analysis details
We are very low at Fibonacci scale
Chart crossed SMA50 – very good
VWMA20 crossed MA20 – even better
MACD – bull’s cross and positive divergence
Weis wave – no supply and lot’s of demand - price rise
Gann Fan – much over ½ level
Fibonacci levels:
Target 1: 0.00225722
Target 2: 0.00287490
Target 3: 0.00337417
Target 4: 0.00387334
Target 5: 0.00458410
Target 6: 0.00548947 (ATH)
Stop-loss: 0.00128878
Thank you for all your support, likes and comments.
If you like our job don’t forget to follow .
YOU ARE AWESOME.
HUGHS!
WBM Team

ICON – Next generation blockchain – 500% Possible EarningsSo Guys, we have today for you another interesting project.
This project has Koreanian roots.
It resembles a bit ONT. They aim to create global network of many blockchains, both private and public to cooperate with each other.
By saying this they mean connecting different institutions such as banks, insurance companies, hospitals and universities.
They also aim to create digitial, safe identity in order to enable individual to move smoothly in such diversed ecosystem.
Example: You had a car accident. You were hospitalized for 3 days. You want to claim to the insurance company. All your sensitive data are stored on blockchain – only you have access to them including all medical data. You give access to them to your doctor in order to write the whole history of the treatment. OK what next? You give temporary access to treatment history to that insurance company. They check compliance. They approve. Once approved you will get your money automatically. It can be ex. 2000 ICON which can be spent on other services in the ecosystem or they can be simply withdrawn.
A transparent governance system and artificial intelligence (AI) guided incentive system is at the core of ICON’s sustainable network. Through the mutual trust earned with their system, C-Reps and Nodes will actively contribute to the ICON community.
These are the basics regarding idea of this enterprise.
We personally find it very interesting because this is totally new point of view.
They of course provide smart contracts and real-time payments.
They will make us possible to start with ICO.
They will also launch on 30.06 decentralized exchange.
They managed to built large team – 60 persons including engineers and advisors.
They have a 5 divisions: Advisors, Foundation Council, Technology, Business, AI Department, Design/Communication/Security.
They are listed on many exchanges such as Binance, OKEX, Bithumb.
Getting back to the chart:
We are very low at the Fibonacci scale (Fib. extention)
We bounced off many times from the level marked on red – around 3000 satoshi – it is happening right now
We observed fully finished Elliot wave cycle. New one is expected.
Most probably we have double bottom shape forming which is a bullish signal.
MACD positive convergence
Weis Wave – a bit of demand has shown up. Awaiting for more.
Gann’s fann - crossed 2/1 for a while but another solid crossing needed – observe
Fibonacci levels:
Target 1 : 0.0004158
Target 2 : 0.0005405
Target 3 : 0.0006413
Target 4 : 0.0007420
Target 5 : 0.0008855
Target 6 : 0.0010682 (ATH)
Target 7 : 0.0015960 (new ATH)
Stop – loss: 0.0002143
Guys what do you think of such projects?
Please do comment, share your thought and don't forget to follow us in order not to miss the update.
Hugs!
WBM Team

BTC – The only way is UP from here – correlation with S&P500Hi Guys!
As we assume many of you are currently waiting for a bounce off.
Unfortunately we have very small volume here but this is the only bad news right now.
Looking back to 2012 on the BTC chart we can draw long-term support. We haven’s crossed it for over 6 years.
Most probable we won’t do it right now.
This support is more less at the same level as minimum price of 1 BTC when it is profitable to dig it right now.
We think minimum profitable price is $5800. If you want more details please look at our previous analysis.
"BTC - WE ARE SAFE - WE WON'T GO BELOW 5800$"
It is down below.
So we can observe another support which was 4 times defended – this is around $6400. Please look on the chart. It is already marked.
We are testing it right now but it doesn’t seem we are going to break it either.
Moreover, we identified Elliot Waves pattern.
It this case 5 steps in the uptrend are clearly marked and also another 5 for the correction.
In our opinion it is clear full cycle has been finished.
New cycle expected.
Look again and you will see red line – this is a long-term resistance line. Most probably we will reach within a months . We should stop somewhere between $35000 - $55000. It is to early to determine the exact number. We will estimate over time. It is marked as a green rectangle.
So we think probability of going up is 80%. Unless we don't get any terrible news or major exchange is hacked we can expect price increase.
Thank you for all your comments, likes and messages.
You opinion is highy appreciated.
If you don’t want to miss the update don’t forget to follow us.
Huge hugs!
WBM Team

ETC – demand on the horizon - 700% earnings possibleHi Guys!
We are back with bunch of good information regarding ETC.
As you already have heard Coinbase (digital currency exchange and wallet headquartered in San Francisco, California. They broker exchanges of Bitcoin, Bitcoin Cash, Ethereum, and Litecoin with fiat currencies in around 32 countries, and bitcoin transactions and storage in 190 countries worldwide) has expressed intention of supporting ETC.
They will start with so-called step4 which means seeing public APIs and other signs that asset is added. Once they finish integration and tests, they will announce officially in the next few months a launch date for trading on their platform.
So we can expect to have a greater interest on ETC thus volume rises and price will rise of course too.
Here is a bunch of other important events which will influence the price. This is going to be interesting year for ETC.
30.06 PoC of new StateDB layer & Emerald Mobile Wallet
31.07 Sidechains support in Emerald Project & Emerald SDK First Release
31.07 Radex will be the first decentralized exchange to be launched on ETC blockchain (delayed – was to be at the end of May 18)
31.08 JIT Compilation in SputnikVM
12.09 Second Annual Ethereum Classic Summit in Seoul
30.11 Fully IoT-compatible infrastructure of ETC(BIG THING)
It is going to be very interesting summer with a nice summary in Seul in September.
Looking back on the chart.
We observed finished Elliot Wave short-term pattern (1-5;A-C). New cycle expected.
When looking at the chart from the perspective we can see we have just started 3rd wave on the long-term Elliot Cycle.
On Weis Wave chart we can see that demand was growing. No supply yet. GOOD.
CMF indicator has just crossed 0 which is the sign of the price pression
MACD – strong positive long-term trend. VERY GOOD.
VWMA50 crossed
We are very low at Fibonacci Scale
Fibonacci Targets:
Target 1: 0.0032868
Target 2: 0.0044939
Target 3: 0.0054696
Target 4: 0.0064452
Target 5: 0.0078342
Target 6: 0.0096110
Target 7: 0.0147133 (new ATH)
Stop-loss: 0.0013355
So guys all we need is good news and volume. On the wave of good investment
atmosphere we should reach the stars. :)
Thank you for all your comments, likes and messages.
You opinion is highy appreciated.
If you don’t want to miss the update don’t forget to follow us.
Huge hugs!
WBM Team
