IOTA - Superfast, feeless ecosystem for machines and humans.Hi Guys!
As we predicted in our analysis "BTC – signs of improvement - don't worry - we will get there!" we have a bounce off of the market.
Although BTC is not mooning yet we will observe rally soon.
OK many of you wrote us to make analysis of IOTA.
Here it is.
First bunch of information:
IOTA is a distributed ledger for the Internet of Things. This ledger is capable of processing hundreds of thousands operations per second. Transactions are feeless. This means money transfer costs you nothing. IOTA ecosystem was created to be integrated with the machines making totally new possibilities for future economy.
By solving the inefficiencies of the Blockchain, IOTA, based on the distributed ledger technology, the Tangle,which is to be the missing link for the Internet of Everything and Web 3.0. Powering a secure, scalable and feeless transaction settlement layer, IOTA will empower machines and humans to participate in flourishing new permissionless economies.
IOTA’s distributed ledger, by contrast, does not consist of transactions grouped into blocks and stored in sequential chains, but as a stream of individual transactions entangled together.
In order to participate in this network, a participant simply needs to perform a small amount of computational work that verifies two previous transactions. Rather than creating a hierarchy of roles and responsibilities in the network, every actor has the same incentives and rewards. In order to make a transaction in the Tangle, two previous transactions must be validated with the reward for doing so being the validation of your own transaction by some subsequent transaction.
Moreover, without the need for monetary rewards, IOTA is not limited to transactional value settlements. It is possible to securely store information within Tangle transactions, or even spread larger amounts of information across multiple bundled or linked transactions.
This structure also enables high scalability of transactions. The more activity in ‘the Tangle’, the faster transactions can be confirmed.
On 3.06.2018 We have Qubic Project meeting.
Probably the most important IOTA event this year. IOTA team will reveal more info about Qubic Project. It seems superfast processing and unlimited scalability as well as smart contracts implemented into IOTA ecosystem.
Team:
50 people on board which over 30 are the part of the team working on everyday basis. Each of them with photo and Linkedin profile
Their team includes experienced entrepreneurs such as Ralf Rottmann, David Sonstebo and Dominik Scheiner as well as experienced developers (some of them are PhD)ex. Paulo Finardi, Darcy Camargo, Jakub Cech.
Technical Analysis:
Price has crossed VMA50 – very good sign
Chaikin Money Flow crossed 0 which says we have increased money pressure
DMI – bull’s cross
MACD – bull’s cross
Volume Profile Indicator – let’s wait will we cross significantly level of 0.00024570. This is the “ fair price” according to investor who bought IOTA. It is marked on the chart as a red line.
Weis Wave – not much volume yet. We can observe relatively small green wave and almost no red waves. It means there is no much demand but also supply is almost spent. Let’s observe.
Fibonacci extension:
Target 1: 0.00024120 (achieved)
Target 2: 0.00031005
Target 3: 0.00036514
Target 4: 0.00042091
Target 5: 0.00050015
Target 6: 0.00060121 (long)
Target 7: 0.00089250 (very long)
Stop-loss: 0.00018000
This might be a long run but this project looks very solid and it may pay off to hodl it for longer.
Thank you for all your support.
If you like our job give us a like. Do not hesitate to comment. We are very open and value your contribution!
HUGS!
WBM_Team
Weiswave

NXS – Mainnet in the sky? 420 % Possible EarningsHi our dear crypto family.
We are back with another trading idea.
Today we will make summary of NXS.
Nexus has revolutionary idea to create its mainnet on the orbit.
Each satellite will operate as a full node, and connect with its peers in orbit and on the ground to establish a complete mesh network that will be resistant to external control. This robust and autonomous infrastructure will run parallel to the Internet, providing alternate pathways for the global community.
How cool is that???
Nexus is creating a distributed satellite and ground based mesh network to enable global access to the Nexus blockchain. In partnership with Vector Space Systems, a nanosatellite company, we will launch communication satellites to provide a fast, affordable, and secure network with unparalleled coverage, distributed across multiple satellites for enhanced reliability and performance. The capabilities provided by the Galactic Sky platform combined with the flexibility of Vector’s launch model bring us one step closer to accomplishing our mission of providing the world with a decentralized currency that can be accessed virtually anywhere, anytime.
This is not the end of innovation.
Three dimensional blockchain - Using a unique implementation of three consensus channels, Nexus will transform the blockchain into a 3D process called the 3 dimensional chain. By adapting to transaction volume, using trust to secure the network, and weighting transactions to determine the most efficient use of resources, the 3DC will increase decentralization and limit the influence exerted by any one system. The 3DC protocol will organically scale to meet network computational demands, which means the network will get faster as more nodes join the system.
Moreover, they claim to be first truly quantum-resistant blockchain, incorporating advanced cryptography designed to negate the threat posed by quantum technology of the future. The 3DC combines 571-bit private keys, 1024-bit Skein and Keccak quantum-resistant hashing algorithms, and an evolving signature scheme called signature chains.
Team
They have a strong team (21 people on board – 6 experienced developers).
Their Chief Software Architect is Collin Cantrel who is experienced coder (since he was 6), music composer and entrepreneur. He is also enthusiasts of space science and quantum phisic. He designed the whole protocol aiming to be the best and most robust.
Ajay Ahuja – very experienced executive (over 20 years) - leading global business initiatives across industries, ranging from developmental-stage companies to Fortune 100 corporations.
Scott Bischoff - has 20+ years cross-functional leadership experience in multiple Fortune 500 companies including Bristol-Myers Squibb and Teva. Areas of expertise include strategic marketing, business development, operations, project management, and finance.
When looking at google trends we are now increasing rapidly.
We are level 34 and growing which is very good sign as we need interest for buy. We need buy for price increase. trends.google.com
Technical Analysis details:
Very low at Fibonacci scale
According to Volume Profile we just crossed the “ fair trade” line which is at 0.00023615. At this price many people have bought their NXS and want to sell with profit. We expect price rise.
According to Weis Wave we have almost no supply and demand is growing – GOOOD!
Chakin Money Flow indicator – we crossed 0 and we in uptrend. It means there is a price pressure – demand is growing.
MACD positive convergence – bullish
VWMA50 crossed
Fibonacci:
Target 1: 0.00042556
Target 2: 0.00052782
Target 3: 0.00063176
Target 4: 0.00077760
Target 5: 0.00096368 (ATH)
Target 6: 0.00149867 (new ATH)
Stop-loss: 0.00025896
Thank you for all support. You are the reason why we are making this.
If you like our job give us a like. Do not hesitate to comment. We are very open and value your contribution!

BTC – did we start the rally?Hi Guys!
Thanks for watching us. Here we are again with our fresh view.
As we predicted in our previous analysis (BTC – signs of improvement - don't worry - we will get there! – down below
) we have no supply now.
Within last 4 months 70% of all trades were between 7300$ and 10 000$.
It means we have new investors who bought BTC within mentioned range. They won’t be willing to sell it. They wait for the price rise. We think this is happening right now.
Here is what we see.
On 4h chart we can see big green bar – the biggest since 14th of May.
It is reflected on Weis Wave chart. 2nd bar is much bigger than the previous one and still there is no supply – no one is selling right now. VERY GOOD INFO. PRICE SHOULD INCREASE.
We marked couple of resistance lines.
1. 7224$ - resistance broken
2. 7400$ - resistance broken
3. 7527$ - resistance to be broken
4. 7990% - resistance trend to be broken
5. 8280$ - resistance trend to be broken
6. 8600$ - 8800$ - resistance zone – when passed this we are sure we will attack 10000$
Guys and girls – observe these levels and act if necessary. By now we say HODL!
Thank you for all support. You are the reason why we are making this.
If you like our job give us a like. Do not hesitate to comment. We are very open and value your contribution!
If you don't want to miss out updates don't forget to follow us!
HUGS!
WBM Team.

BTC - silence or storm?Hi Guys!
We are back with the new view and new charts.
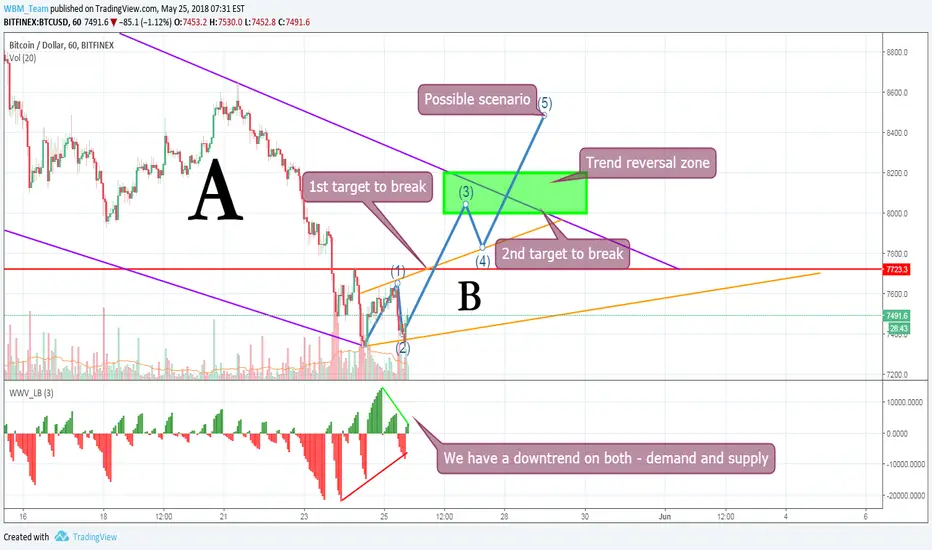
It is not a secret we are in a corrective downtrend. How deep can we fall?
There is more than one answer.
First of all we have a super big support at 6000$. We call it profitability level below which, miners simply don’t earn money. We won’t go below that level. We vastly described why in our previous analysis. You will find it down below.
Moreover we have long term support which is currently at around 6900$ level. We shouldn’t go below that.
So what has to happen to break the correction tunnel?
First of all we have to break 1st target which is at 7700$ level . It would mean we are out of the B tunnel – goooooood. OK but what next?
We are still in A downtrend.
Once it is broken we have a chance to move forward breaking our 2nd point/level which will be at around 8100$ . Once broken for good we are more likely to follow the pattern 1-5 of Elliot’s Wave.
8100$ is also breaking point of the longterm trend. Look at the chart below the analysis.
According to the Weis Waves there is significantly lower volume on both sides – supply and demand.
It looks like stabilization.
Remember after such a massive drop there will be fast recovery. Look at the historical peaks and bottoms.
So guys keep observing BTC and of course our profile.
If you like our job give us a like. Do not hesitate to comment. We are very open and value your contribution!
If you don't want to miss out updates don't forget to follow us!
HUGS!
WBM Team
BITCOIN - QUO VADIS?Hi Guys.
So we are in the middle of whales' play. This game is to get rich . They didn't belive in BTC and cryptocurrencies. They were sceptical.
It turned out they were wrong. They want to buy as low as possible. It is obvious.
They spread panic, FUD. They want us to be afraid and hectic.
Don't be. Be wiser. Stay cool. Observe and be vigiliant.
As we mentioned in our previous analysis BTC - WE ARE SAFE - WE WON'T GO BELOW 5800$ (down below), Satoshi Nakamoto is on guard.
Why? He is on the possesion of nearly 1 mln BTC - he owns the biggest wallet. He can do with the price whatever he wants. For sure he's got another currencies to buy BTC too.
As he owns the biggest amount of BTC he wants the highest price as possible. To do that he needs to keep the whole networked running.
To do so it all has to be profitable for miners, nodes and master nodes. The biggest cost for them is of course hardware, maintenance and energy cost. Basing od the master node distribution we made assumption that it was not profitable for miners to dig BTC when price went below 5800$. This is absolute minimum. We belive it is more around 7000$. It is difficult to give exact number as we don't know exact distribution of the digger around the world.
Be wise. DON'T panic. In couple of years time, 1 BTC will be worth 1mln $ or even more. Maybe we will encounter situation like listing 1 SATOSHI for 1 dollar. It may happen.
BTC is our digital gold. Why gold? Gold is very solid, noble metal. It doesn't oxidize, it doesn't get rusty. By saying this its value doesnt go lower because of its phisical state. It is very limited and widely used (deposits and jewellery). This is the same with BTC. Limited amount of BTC, immutable, impossible to forge, widely used - deposit or to buy another crypto (in 95% cases you have to buy BTC first).
Only 0,42% of the global population heard about BTC or cryptocurrncies. We have plenty room to go higher.
Let's look on the chart:
We are in Elliot Wave pattern correction mode - we have to wait for wave C. We think reload zone is between 6800$ and 7300$.
Long term organic growth support at level 6800$
Stoch RSI - oversold zone
RSI - oversold zone
Weis Waves - not demand yet but observe when supply will be lower and demand explodes
So after every storm sun comes up. We are getting closer to get to the end of the storm.
So guys keep observing BTC and of course our profile.
If you like our job give us a like. Do not hesitate to comment. We are very open and value your contribution!
If you don't want to miss out updates don't forget to follow us!
HUGS!
WBM Team

TRX - TRON - Might be the BEST INVESTMENT till summer.Hi guys!
This is us again with possbily best investment till summer! YES this summer!
As there is a hype around TRON lately you probably may have heard about this project.
Here is what they do:
They aim to be decentralized entertainment content sharing platform.
Founded by a non-profit Singapore-based foundation, the Tron Foundation seeks to tackle the global entertainment industry.
They want to enable authors, creators to omit such platforms as Appstore, GooglePlay. Thus they will be able to obtain money directly from the customers/listeners/readers.
Currently, a lot of user data and traffic is controlled by a few corporations like Google, Facebook, Amazon, & Snapchat. TRON attempts to mitigate this control by placing ownership of the data back into the creator’s hands.
TRX creators are interested in long-term investments/investors. They are not looking for quick money and profit. They want to build sustainable business with stable supporters. The interesing feature of their coin is that they the more tokens you have and the longer you hodl them the greater impact your vote has. So if you are really interested in participating in this project and have influence the way if follows, you have to hodl it. You will have more power such as voting rights and higher status.
Total supply of tokens is 100 billions. Right now there is 65.7 billions in circulation.
They are listed on 38 exchanges - WOW.
They are backed by descent amount of people - 300K followers on Twitter.
have a very engaged team - last 7 days commits rank - Number 1 with 239 commits (outperforming EOS, ONT).
There are plenty events upcoming which influence the price for sure:
25.05.18 TronVM v.0.1 will be launched May 25. This version of TronVM uses a VM adpater that will enable complete compatibility with the ETH VM.
31.05.18 The launch date of main net will be advanced form July 1st to May 31st.
21.06.18 The migration from ERC20 tokens to TRX, the cryptocurrency on Tron’s public blockchain, will begin on June 21,2018
21.06.18 Bittrex is supporting the TRON blockchain upgrade
21.06.18 Bitfinex is supporting the TRON blockchain upgrade
21.06.18 Gate.io is supporting the TRON blockchain upgrade
21.06.18 Binance is supporting the TRON blockchain upgrade
26.06.18 Super representatives for the Tron mainnet will be elected by the community.
So let's look at technical analysis:
We are over all MA50/100 and VWMA50/100 - this is really great news as this is stong buy signal.
Our favourite - Weis waves - demand is visibly bigger than supply and supply is very very small. We have to wait for another moves – we have to observe decreasing green wave. Set alarm at 100000000 at Weis waves chart.
Why is this so important? Volume is fundamental here as this is direct factor which influences the price.
This works in case of every good in the world - the more people want to buy and the bigger shortage of this certin good is the higher the price is.
And other way round - too much good and few people willing to buy results in price decrease.
So guys keep observing this coin and of course our profile.
If you like our job give us a like. Do not hesitate to comment. We are very open and value your contribution!
If you don't want to miss out updates don't forget to follow us!
HUGS!
WBM Team
PS.
Can you do something to increase the volume even more? Of course! Tell your family, friends and collegues at work what cryptos really are.. Explain them, show advantages, encourage them to invest certain amount of money in e.x. BTC instead of loosing money on bank deposit.
Be the ambasador of cryptocurrencies and blockchain.
Here is the great article from medium.com explaning possible huge impact of crypto and blockchain on our world - Read it and share it our peers. It is really worth recommending. medium.com

ZEC - Zcash - Time for reload! Short temporarily.
Hi Folks!
We had a very good news regarding Zcash last time. It will be listed on Gemini Exchange. The price has exploded.
It may go even higher as looking at the big picture of ZEC we are very low according to Fibonacci levels (big scale). The second chart with bigger picture illustrates this.
Right now it is good time to stay vigiliant and reload or simply buy ZEC. We may encounter massive gain within following weeks/months.
So we observed finished Elliot Wave pattern (1-5). We have to prepare for the correction waves (A-C). Wait till it's finished.
Looking at the volume and Weis Waves we can see now demand is spent. Following green wave is signifiantly smaller than previous one.
Waiting for higher supply. Price should decrease then.
We assume perfect levels for reload would be at Fibonacci small scale at level between 0.03465900 and 0.03940200 (green rectangle).
Of course it has to be confirmed by Weis waves.
Technical analysis summary:
Elliot Wave pattern finished (1-5)
Expecting to have correction pattern (A-C)
Weis waves - demand is spent - significantly smaller green wave observed
Reload or buy at level of between 0.03465900 and 0.03940200 (green rectangle)
Waiting for the confirmation from Weis Waves indicator - trend reversal.
Stay tuned.
If you have any ideas/thoughts don't forget to question and comment in section down below.
If you want to be up-to-date don't forget to follow us.
Hugs!
WBM Team

BTC - Recovery is on the horizonHi our dear crypto family!
We are back with bunch new info about BTC and it's trend!
So during the weekend we managed to recover a bit but sill pretty far from the 10K level.
We really have to break it for good to be sure we can go any further.
Good news is we are above the SMA50 and WVMA50 (weighted volume average). VWMA50 is over SMA50 which is another good news.
Unfortunately we fell out from the red-marked triangle. We are still below long-term support. Actually we are on the verge. That is the first step to break to go further.
Next stop will be to break SMA100 and WVMA100 which is at around 8800 level. Keep observing.
Next stop and big resistance is 10K. Be patient but vigiliant. We may encounter double peak forming (with 10k stop) resulting we can fall again below 8K.
This is about trend and certian levels.
But all that won't happen without the key which is VOLUME! Volume is fundamental here as this is direct factor which influences the price.
This works in case of every good in the world - the more people want to buy and the bigger shortage of this certin good is the higher the price is.
And other way round - too much good and few people willing to buy results in price decrease.
Can you do something with it? Of course! Tell your family, friends and collegues at work what BTC really is. Explain them, show advantages, encourage them to invest certain amount of money in BTC instead loosing money on bank deposit.
Here is the great article from medium.com explaning possible huge impact of crypto and blockchain on our world - Read it and share it our peers. It is really worth recommending. medium.com
Getting back to the chart.
Perfectly we need large demand and small supply for rapid price risal. It is not the case now for BTC.
Although we can observe that supply was getting spent. Demand slighlty rised but we are waiting for more.Trend is postiive according to Weis Waves.
Moreover we can see positive trend on MACD chart as well. Dips are shallower and we can see bull's cross.
To make story short. Here is the summary. Quick glance and you know everything.
1. We are above the SMA50 and WVMA50 (weighted volume average). VWMA50 is over SMA50 which is another good news.
2. We have to break previous support line which means breaking 8600$ level.
3. We need to break SMA100 and VWSMA100 at around 8800$ level.
4. If above happens we are going to attack 10 000$ .
5. Stay cool and watch if double peak pattern is not forming.
6. Weis Waves - looks like supply is almost spent and demand is spinning. We should go UP!
7. MACD - positive trend and.
If you like our job give us a like. Do not hesitate to comment. We are very open and value your contribution!
If you don't want to miss out updates don't forget to follow us!
HUGS!
WBM Team

SYS- SYSCOIN- Airdrop CPScoin is coming- June 1st- 300% earningsHi Guys.
Once again thank you for all the support you're giving us!
Today we have a very interesting project for you.
Syscoin - this is fork of BTC. They use the same technology as bitcoin.
They offer near zero financial transactions and they are makretplace which offers business space and infrastructure to trade goods, assets, digital certificates and data securely.
Unlike other cryptocurrencies, Syscoin’s great value is derived from the decentralized services it provides directly on the blockchain. The blockchain powers all Syscoin services. It is a decentralized system of record hosted by a series of “nodes” on the Syscoin network.
It means their coin will be used in varety of bussines which makes the demand pression and as a result we may expect significant price rise of the coin (at least in theory).
They also offer encrypted messaging between participans, alliases to the wallet addresses (great option as wallet addresses are not memorable by humans ;)).
With Syscoin anyone can issue provably-unique certificates with text or ascii content to one or multiple parties on the Syscoin blockchain. These certificates can be authenticated by anyone via Syscoin’s cryptographic proof of work.
This allows for the creation and free exchange of a any kind of digital asset such as ownership certificates, warranties, receipts, tickets, certifications, diplomas, software licenses and more.
They have a strong team (19 team members) with Sebastian Cheips (founder - very experienced (ex. Oracle Project Manager) - www.linkedin.com) and Dan Wasyluk (www.linkedin.com) on board.
The have have nearly 70K followers on Twitter.
There is a Airdrop of CPScoin (June 1st) for holders of Syscoin. CPS is another interesitng project with strong team. More info here
coinpaymentscoin.com
Moreover Dan Wasyluk mentioned above is finding ways to add Syscoin to the Shapeshift.io exchange. SHapeshift is supporting dozens of tokens right now including Bitcoin, Ethereum, Monero, Zcash, Dash, Dogecoin, and others.
So fundamental analysis looks good.
Let's look on technical analysis and volume.
We broke MA100
Cup with handle shape observed - confirmed on volume chart
MACD bull's cross and double bottom shape
Weis Waves - explicit growth of demand and at the same time supply is almost spent - look really good - THIS IS VERY IMPORTANT.
Fibonacci levels:
1. 0.00005285
2. 0.00006379
3. 0.00007472
4. 0.00011032 (ATH)
5. 0.00016778 (new ATH)
If you agree with us please like our post. If you want to comment do it down below. Don't forget to follow us!
HUGS!
WBM Team

SNT-STATUS- Dark horse- no wait dark bull-500% possible earningsHi our dear crypto family members.
We have today for you another crypto proposal.This coin is more for hodlers as we don't have much volume yet.
Everyone uses google or bing search engine right? Without that it would be impossible to exist in Internet.
Without them it would be very difficult to find essential information as well as being efficient in browsing (well we could argue ;) but let's not do it here).
Here is something similar for blockchain. To be specific Ethereum blockchain.
Status is a browser, messenger, and gateway to the Ethereum blockchain world. It is a free and open source mobile client targeting Android & iOS built, entirely on Ethereum technologies. They aim to be next generation browser for the next generation apps called decentralised apps (dapps) based on Ethereum network (ERC-20 tokens). By their app you can also store safely and send ETH to other participants of their network.
They also want us to be able to exchange goods and services.
They offer also what they call smart private messaging. They claim Status is more than a messenger. It enables to send payments and smart contracts to friends from within chats, and enjoy encrypted messaging by default, using a peer-to-peer protocol that doesn’t rely on centralized servers. They are totally open-source and anyone can contribute.
They have descent rates at coincheckup.com:
Open communication channel - 100%
Activity on social media - 95%
Team strength - 65 % - They are recruting heavily by the way status.im
Advisory board strength - 50%
Brand awarness/Buzz - 90%
Product strength - 70%
Coin strength - 89%
Company strength - 70%
The have a descent amount of followers on Twitter - 100K
They made 30 total new commits over last 4 weeks on Github
Technical analysis details:
Very low at Fibonacci scale
Full Elliot Wave cycle fisnished - New cycle expected
RSI - oversold zone - postive convergence with the price
Unfortunately low volume. Set alarm on TV: When reaching the price 0.00001921 and when bar crosses 18542096 on Weis Waves chart. WE NEED VOLUME FOR THE PRISE RISAL
Fibonacci:
Target1: 0.00001921
Target2: 0.00002483
Target3: 0.00002939
Target4: 0.00003394
Target5: 0.00004044
Target6: 0.00004882 (ATH)
Target7: 0.00007262 (new ATH)
So guys. This is interesting concept and project.Keep watching this.
If you have any ideas please do comment down below. Your comments are very much appreciated.
Don't forget to follow us!
HUGS!
WBM Team

Zclassic - (ZCL) - 1700% Possible Earnings - Very Risky
Hi Guys.
Today we have a Zclassic short analysis for you. This is more relaying on TA.
Investment in Zclassic is very risky right now as team announces to cease it partly for the time being but...
Crypto world is crazy right now and for some adreline and fun we would invest very very small part of our assets.
The Zclassic team anounced on Medium.com and Twitter: "No development team has approached us to discuss further development of the project nor does the Bitcoin Private team intend to continue active development. Furthermore, we have no intention of handing the project over to a new team without significant experience or a comprehensive development plan"
They are gathering ideas on what they called "Zclassic project proposal process"
Due date is on June 1st. On June 2, 2018 the Bitcoin Private team will begin the review process and a winner will be announced by September 1, 2018. In the event that no proposal is selected, the proposal process will start over and applicants will have a chance to revise their proposals.
So it may turn out there is a community/devs which supports Zclassic. The news will be announced in September 2018 and there we go - Boom!
It was announced in March and weird is the fact that we had a massive (10 times) price rise.
It may happen this time. Stay observant.
Set alarms on Treding View on Weis Waves. Whether it is 250 000 up or 250 000 down.
Without watching at this all the time you will get the message that something is going on and it is worth watching this coin for a while.
Tech analysis details:
Very low on Fibonacci scale
Elliot Waves cycle finished (A-C) and waiting for another one (1-5)
Weis waves - not enough volume yet - but remember alarms on TV.
Stoch RSI - oversold zone
Fibonacci levels:
Buy: around 0.00180000
1. 0.00492524
2. 0.00770668
3. 0.00999102
4. 0.01228588
5. 0.01553353
6. 0.01963528 (ATH)
7. 0.03153294 (new ATH)
Stop - loss: 0.00130000
So guys. This is risky game but it may pay off. We will see.
When there will be good atmosphere around all crypto even such project can explode (fundamentally and technically).
HUGS!
WBM Team

BITCOIN - Don' panic. Future is bright!Hi our dear crypto family.
Once again thank you for all your support you are constatnly giving us! You are the one of your kind.
So let's look at the chart.
You may probably have heard why we had this sale on bitcoin. Here is the list of possible reasons:
1. One of the US banks has ceased possiblity of buying crypto with credit cards (smaller demand and FUD)
2. Mt.Gox started selling their 8200 BTC. They induced the panic and here we go - price dumps.
3. Upbit - Korea Exchange - Police issues - again FUD.
4. CME price gap
5. Whales accumulation
So this is just temporary. Don't panic. We are at the begining of the story with blockchain and cryptocurrencies.
Do you remember when internet emerged? How many of you had in 1994 email address? Do you know anybody without one now?
We don't fell below the price below it is profitable for miners (look at our analysis "We will tell you why BTC will not go lower than 5800" - it is down below)
Right now it is estimated (it is difficult to count it precisely) that around 30 mln of people have at least 0.001 BTC.
This is nothing ( around of 0,43 % of the global population) comparing to over 7 billions of people worldwide.
Look at the bigger picture. Do we go in the desired direction?
Of course! Don't forget about that! Look at the adoption and prices in 2014, 2015 and so on... There are always ups and downs, turns, twists and corners. But at the end we will reach the goal which is massive adoption! Imagine current situation with possible one in let say 5/10/20 years time when we would have to pay 1/2/5/10 dollars for one satoshi. Be smart before it happens. Use you mind and imagination. Stay vigiliant.
Is there something you can do for mutual goal? Of course. Talk to your friends, family, collegues explaining them what BTC or cryptocurrencies are. Show them how to invest safely their first 100$. Tell them what the advantages are. Simply be AMBASADOR.
We hope those worlds will speak to you guys. We have to stick together.
Here are some technical analysis details:
MACD postivie (delicate) convergence
RSI - oversold zone with positive convergence
VWMA50 getting closer to MA50 - when the pink one crosses blue line - bull's cross - strong buy indicator
Finally, Weis Waves - our favourite last time - As you can see at the chart we marked bars with many vertical lines when current trend changes. We used trend detection length 3 as we think in current situation it gives the best insight of that what happens right now. As you can see usually when supply is growing demand is decreasing and other way round. Somethimes it happens that volume is small and both red and green waves are small. This is not the case this time. We marked you (1-3) growing green waves with significantly smaller (than previus red ones) red wave (A). This means supply is getting spent and demand is growing. We should see price rise soon!
If you like our job please like us. If you have any ideas regarding what we have written please comment.
Don't forget to follow us.
HUGS!
WBM Team

DOGECOIN (DOGE) - 242 % Earnings Possible - Pure Technical
Hi Guys!
As BTC is slowly recovering (look down below at our analysis - it is newly updated) we may find another undervalued project.
Today we want to share with you our technical analysis of DOGECOIN.
This is purely technical
Let's get down to the facts.
Elliot Wave pattern finished - (1-5) UP and (A-C) DOWN
New cycle has just begun (1-5)
Trend-based Fibonacci extention - we are very low at the scale
Stoch RSI is in the oversold area which is bull's sign
Our favourite - Weis Waves - this is a bit weird - both supply and demand are strong but during last Elliot pattern we managed to obtain almost 100% gain. This may happen this time. Be ready for massive green wave and rally up.
Fibonacci Levels:
Buy: 0.00000054 - 0.00000059
Target 1: 0.00000059
Target 2: 0.00000073
Target 3: 0.00000085
Target 4: 0.00000096
Target 5: 0.00000113
Target 6: 0.00000133
Stop-loss: It depends on how conservative you are. Here are some options
1. 0.00000050 (very conservative)
2. 0.00000045 (normal)
3. 0.00000036 (loose)
Good luck.
What do you guys think about this project? Do you think we can go even higher? Can you post some news about Dodge?
All your comments will be highly appreciated.
Don't forget to follow us!
Thank you for being here!
HUGH!
WBM TEAM

BAT - Congratulations - over 100% earnings in less than a monthHi Guys.
First of all congratulations!
Another project with descent earnings in short period of time.
Accoriding to our analysis on April 4th we started at the level of 0.00002814 and on 1st of May we finished at 0.00005761. This over 100%. Great, isn't it?
Ok but what with another targets. Let's take a look
Fibonacci Levels:
Initial entry level : 0.00002814
Target 1: 0.00003400 (achieved)
Target 2: 0.00004200 (achieved)
Target 3: 0.00004800 (achieved)
Target 4: 0.00005450 (achieved)
Target 5: 0.00006340
Target 6: 0.00007480
Bonus: 0.00010753
Stop loss below: 0.00003400
New entry level will be above 0.00003400. According to Elliot Waves we may go as low as 0.00003400 but then new cycle should come up (1-5 Elliot waves).
Lookng at weis waves we don't have a volume on both demand and supply site.The price should stabilize. Let's wait for another candles informing us where we are going!
For those who are new here there is a short reminder what BAT actually is.
This is BAT token strictly attached to Brave browser.
Brave browser is actually FASTER than Chrome.
We tested it on computer and on mobile and THIS IS REAL. It has more than 1 mln downloads on google play.
Moreover, which is very important, they allow the user to block literally all ads. As we download less data, our internet transfer and battery are not that laden. As a result our mobile is longer on one charge and we use less data transfer. This all makes us saving money.
They say we can save up to 23$ a month.
If we actually allow ads on our device we get BAT tokens. The more ads we allow the more BATs we get (up to certain level).
This token is already listed on Binance, Bittrex, Huobi, Bitfinex.
This project is strongly backed by the team. Brendan Eich (created Java Script, co-founder of Mozilla and Firefox), Brian Bondy(Mozilla, Khan Academy, Evernote), Yan Zhu ( Yahoo, Tor), Scott Locklin (Kerf Software Machine Learning) and many more.
Check out the full list of the team members basicattentiontoken.org
They started on May 29th 2017.
Basic Attention Token (BAT) is an ERC20 token built on top of Ethereum -0.71% . They launched its crowdsale in May 2017 which saw the tokens fully subscribed and raised $35 million in 30 seconds. WOW!
Thank for all your support! Don't forget to comment, like if you agree and follow us to get more insight into another crypto tokens.
HUGS!
WBM Team

EOS - Congratulations - 287 % Earnings in less than a month!Hi crypto family!
Congratulations! With WBM Team you could earn up to 287 % within a less than a month (perfecty matched with our predicted time frame).
What a great news.
To remind you (look at our EOS analysis from April 7th) our targets:
Target1: 0.00082547 (achieved)
Target2: 0.00113930 (achieved)
Target3: 0.00128228 (achieved)
Target4: 0.00149216 (achieved)
Target5: 0.00174308 (achieved)
Bonus: 0.00240000 (achieved) - AWESOME
On 7th of April we started from level 0.00082547 and we managed to obtain as high as 0.00240000.
Ok let's get down to the current situation. We still believe in this project but we have to correct temporarly.
For the time being we should establish short postions on EOS.
Here are the reasons why:
Volume Wighted Moving Average likety to cross MA which is bear's sign
We have observed MACD bear's cross
Volume weighted MACD - bear's cross likely to happen
The most interesting and most valuable here - Weis Waves: as you can see after massive green wave we have a very small green candles - it means there is no demand and as a result price won't go up. On the other hand supply is growing - more red candles at the end of the chart - there will be more tokens for sale.
We have to wait till situation on Weis Waves changes - to make story short - more green candles and fewer red ones.
Check out our BTC WEIS WAVES educational analysis down below to understand the concept.
Thank you for your messages, comments and likes. Don't forget to follow us.
HUGS!
Your Team (WBM ;))

Ethereum Classic (ETC) - what is going on?Hello our dear crypto family.
Not expected gains on ETC? Impatient?
Let's take a look closer basing on technical analysis first.
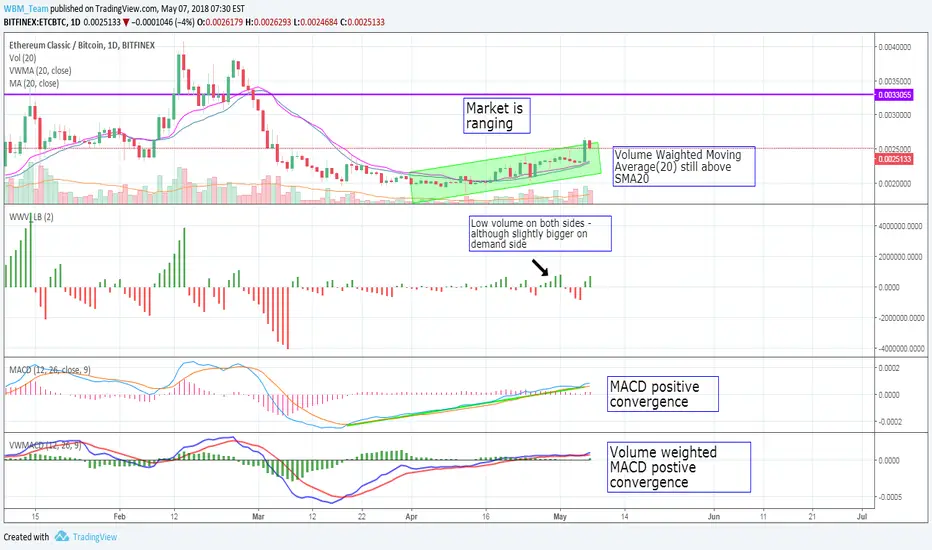
Market is ranging - we made 25% profit since mid April
Volume Weighted Average - very useful indicator to be combined always with Simple Moving Average - VWA is above SMA which is healthy and
positive. Price chart is above them two which confirms good trend. We have a convergence on price and VWA and SMA - GOOD.
Both MACD and Volume Weighted MACD show postive convergence so it is again healthy sign.
Let's jump to our recently favourite indicator - Weis Waves - unfortunately no big candles and a bit small volume. But it is not too bad. As we
can see there more green candels, green candels appear more often so presumably we can expect coininuing (slow?) growth. Waiting for more
candles with hopefully explict direction. Keep follow us for further updates on ETC
Moreover as we expect the new airdrop in mid July (listed below), we stay positive about ETC price in mid term.
Here is short description of what ETC is (for those who are new here):
ETC is one of two separate versions of Ethereum's Blockchain, the other being Ethereum itself. The split occurred after The DAO, a decentralized autonomous organization based on Ethereum, got hacked in June 2016, and $50 million worth of its funds were stolen. Because The DAO was crowdfunded, this event has resulted in a large number of people losing their stakes. After several weeks of heated debate, the community has decided to conduct a "hard fork" of Ethereum's Blockchain in order to "code" the stolen money back to its owners. In order to perform the hard fork, the majority of the users had to simultaneously take all the transaction records prior to the point of the hacking, and start anew from there, while discarding all transactions which have happened after that, including the hackers'. That doesn't mean that anything has happened to the previous version of the Blockchain - on the contrary, the hardfork resulted in two versions existing simultaneously: Ethereum -7.91% , which is the new one, and the old one, which was renamed Ethereum Classic.
ETC is in top 20 in terms of market cap. Backed by very good developers team as well as community. Devs are rated on 81% on coingecko and they have over 200k followers on Twitter (for comparison Eth has 400k)
We are going to have couple of events and good information regarding ETC. Here is the list:
24.05 ETC is hard forking in May to remove the difficulty bomb.
31.05 Working prototype of Sidechain & Enable new Opcodes for compatibility with ETH
31.05 Radex will be the first decentralized exchange to be launched on ETC blockchain (BIG THING)
30.06 PoC of new StateDB layer & Emerald Mobile Wallet
13.07 At block height #6100000t. Each ETC holder receives ETE in the ratio of 1:1 for free (PRICE WILL DEFINITELY INCREASE)
31.07 Sidechains support in Emerald Project & Emerald SDK First Release
31.08 JIT Compilation in SputnikVM
30.11 Fully IoT-compatible infrastructure of ETC (BIG THING)
Thank you for all comments, likes and messages. Don't forget to follow us.
Huge hugs!
WBM Team
ONTOLOGY(ONT) - WHEN IN TOP3 - 4000% POSSIBLE PROFITHi Guys!
Do you remember our last ONT analysis (link down below)? We already reached level of our wave 5 from previous analysis.
So WBM Team was right! Keep follows us to reach higher levels!
As it grows so rapidly with such a high volume (up to 15k Bitcoins/24h) we can expect ONT to be a real hero in 2018.
In terms of market cap ONT is at 17th place. What happens if it is in TOP 3. It has to surpass Ripple in its prosperity time.
Ripple's "prosperity price" was 2,5 USD/coin. It gives market cap over 98 bln USD. Taking into account ONT's market cap is now 2,44 bln USD it should make 100 bln market cap. This is a lot of money!. It can take a year, two or five. We don't know.
As ONT is strongly connected with NEO and NEO had a great ride making even more profit (350X in 2017) this scenerio is likely to happen.
This SOUNDS CRAZY but that is the way it can be in our crypto world.
Their project IS NOT another Etheruem, it is fresh and with very small competition in this this field.
Just to remind you about ONT project:
This is absolutely massive. It has 5 white papers (3 already published and 2 to be). There was NO ICO 0.00% . The total amount of tokens is
1 000 000 000.
They already gave away around 25 % for NEO hodlers, community and attendees of dev conf.
They might reward community for following their facebook -1.21% or twitter accounts.
It is really hard to describe it all but here are the essentials:
There was no ICO 0.00% .
They launched ONT -0.15% at the beginning of March 2018. For 1 NEO one got 0.2 ONT -0.15% .
They are backed by massive team (40 people which most of them are IT senior engineers). Everyone with photo and description.
info.ont.io
CEO Jun Li is also founder of Onchain startup (2014) backed by Fosun Group (Conglomerate from China)
Their goal is to incorporate blockchain into current, real existing businesses. The want to bridge real world with NEO to relieve
businesses from tech development
They are strictly connected to NEO
NEO focus is public, ONT -0.15% focus is private
NEO stands for digital applications, digital new economy, ONT -0.15% stands for bridging real economy with digital economy
NEO new digital apps/businesses, ONT -0.15% wants make it possible for current business to become digital companies
They are aiming to governments, health services as well as private bussines, IoT 0.00% , people, data and many more
At protocol level and application level NEO focuses on digital assets and smart economy and ONT -0.15% focuses on trust identity, distributed
data and trust with collaboration scenerios.
They want you to be in control of your data. They treat data like a gold 0.68% .
ONT wants to create separate blockchains for businesses to store their data without possibility for 3rd parties to access and view them.1
business/process one blockchain.
Token structure is similar to NEO – when you hold NEO you are paid gas and when you hold ONT -0.15% you will get ontology gas – each block 15-
20 seconds
ONT is listed on Binance, Huobi, OKEX, Gate. io
Technical analysis details:
SMA6 over SMA 20
MACD bull's cross & positive convergence
Volume Flow Index - bull's cross
Weis Wave - we are in accumulation and growth phase - we can expect small correction but it will be signal with a red bar.
Stay tuned and don't forget to follow us, comment and give a like if you agree with our idea.
************************************************************************************************************************************************************************************
HUGS.
Your WBM Team

BTC - WEIS WAVES - TRUTHFUL INDICATORHi Guys!
Today we want to share with you knowledge with regard awesome indicator which is Weis Wave.
We all can see that we have up and down trends. Everything moves in waves' manner. There are plenty of buying and selling waves. But how to identify trend change and buy low and sell high? It's not that easy but with Weis Wave indicator it will become clearer.
Wave charts were first created by Richard D. Wyckoff. In his famous course on stock market technique, he instructed students to “think in waves.” Wave analysis was an integral part of his trading method. The Weis Wave is an adaptation of Wyckoff’s method that handles today’s volatile markets. It works in all time periods and can be applied to the futures, forex, stock, commodity markets and of course cryptocurrencies. You will be amazed at how well the Weis Wave identifies turning points.
So we prepared description of this indicator basing on up-to-date BTCUSD 1H chart.
It might be useful in terms of determining BTC price in the very near future.
So let's get down to business.
Let's assume we start from point A.
We can see we start from the price of around 8860 USD.
We finish at point B. We have there green candels (demand) increasing and at the same time red candels decreasing which says we have no supply. This is perfect situation of the price increase. We have smaller amounf of commodity and at the same time our demand grows.
Moving further number 3 followed by point B, we have small green candle stick. It is much smaller than preceding green waves. It means our demand is spent. Moving further our red sticks (point 4) are getting bigger which means supply is getting bigger. As a result price drops.
At point number 5 we have again red candle stick which is smaller than than preceding red waves which means supply is lower and we can expect price to increase. It is confirmed by the wave made from green candels (point number 6). Price goes up.
At point number 7 we have again red candles' wave and again price drop-down. More interesting is that when we can expect trend reversal and when we should establish long trade.
We can see this at point number 8. Small red candle sticks are followed by green waves and those red sticks are significantly smaller than preceding red waves. Green waves become bigger and price increases.
That's it! Isn't it awesome?
That's the first educational post regarding Weis Waves but there will be more. We are very excited about that!
We are sorry for the language which is some parts is repetetive and a bit chaldish but we wanted to be pricise and clear it as simple as possible.
If you like it don't forget to like it, comment and follow us!
Thank you for being here.
HUGS!
Your WBM Team.

NEO - Another hero of 2018? 100% growth expected soon
Hello Dear Friends!
It is great to be here so don't let us down and comment, like and subsribe! Thank you very much.
As yesterday we reminded you about ONTOLOGY project (down below you will find our ONT analysis), today we have to mention about NEO.
On April 10th we made analysis of NEO for You. Yes we achieved 1st Fibonacci Target! YES YES YES!
As ONT is a huge project with massive potential and is strictly connected to NEO it will influance NEO's price for sure!
We think we don't have to introduce NEO.
So here are some technical analysis details:
New Elliot Wave Pattern started - 1st wave achieved; currently in 2nd correction wave; waiting to start 3rd wave (look at the chart)
Stoch RSI - strong oversold zone - time to BUY
Volume Flow Index - bull's cross
Weis Wave - Once green candle appear - strong buy signal - we can expect it very soon
Fibonacci Levels:
Target1: 0.009670 (achieved)
Target2: 0.011567
Target3: 0.013127
Target4: 0.014688
Target5: 0.016865
Target6: 0.019649
Stop-loss: 0.006641
Please do help us to built the greatest group on Trading View. Give us a like and comment what you think about our IDEAS.
***********************************************************************************************************************************************************************************
HUGS!
Your WBM_Team

Beast change of behaviour 13 09 2017There was first wave down with high volume, than move up with light volume signaling "No demand". I think it will continue to the downside.

GBPAUD 23.08.2017Cumulative volumes divergence shows that supply has been dried up. Yesterday, there was bearish trap, which can be consired as Wyckoff spring. 2 possible strategy
1. Aggressive - buy at spring test, SL below spring low
2. Conservative - wait for first wave up. If volume picks up, wait for low volume pullback/test and go long.
In case of breaking to downside, consolidation zone will be consider as redistribution.
Have a safe trading.

AUDJPY 16.08.2017On M15 red arrow shows no supply signal. Next candle closed higher, which confirmed the signal to go long. I'm bullish for today London session.

AUDJPY 26 April 2017AUDJPY is in the down trend.
AUDJPY bounced strong resistance level around 83.75-84.
It will continue move down, most likely. Pullback may be good opportunity to join the trend.
