WEMIX is already in a bull market, send it to 50$This is legit the only play to earn platform in the entire world with actual playable games.
XPLA and MARBLEX come close. But currently WEMIX is the king.
We can expect some good polished and probably popular games in the coming year.
30$ target is a joke for this token. I think 50$ is more reasonable.
Wemixsignals

WEMIXUSD Targeting $6.000 after the next pull-back.WEMIX (WEMIXUSD) broke yet above another Resistance (2.7675) yesterday as well as the 0.5 Fibonacci retracement level. It is about to complete a +160% rise from the previous Low, which is the % range that the previous two bullish legs have registered before pulling back since the August 17 low. The next Resistance level is at 4.700 almost exactly on the 0.618 retracement level, but after the expected pull-back now, our target will be higher, another +160% leg at $6.000.
-------------------------------------------------------------------------------
** Please LIKE 👍, FOLLOW ✅, SHARE 🙌 and COMMENT ✍ if you enjoy this idea! Also share your ideas and charts in the comments section below! This is best way to keep it relevant, support us, keep the content here free and allow the idea to reach as many people as possible. **
-------------------------------------------------------------------------------
💸💸💸💸💸💸
👇 👇 👇 👇 👇 👇

Wemix showing a very good investment opportunitytoday we have one of the best risk to reward Investment opportunity
it is more than 70 times the risk and the chart is look very promising.
Good luck every one

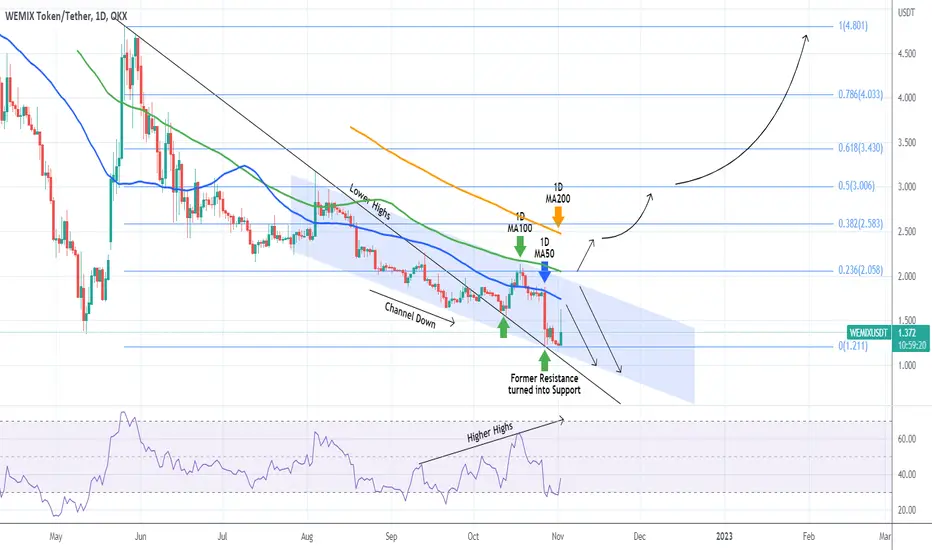
WEMIXUSDT Good rebound but not a break-out yet. Trade it safely.*** ***
For this particular analysis on the Wemix token we are using the WEMIXUSDT symbol on the OKX exchange.
*** ***
The idea is on the 1D time-frame where WEMIX has reached even +30% intraday but is pulling-back (so far) after coming too close to the 1D MA50 (blue trend-line). This is the trend-line where it got rejected heavily on October 27 and made a new Lower Low on the Channel Down pattern that it has been trading in since July 27.
In our opinion, today's rise isn't enough to make us buy Wemix . We would ideally like to see it break above the 1D MA100 (green trend-line), where the price was last rejected on October 18 and which has been holding as a Resistance since August 11.
A break above the 1D MA100, is a bullish signal targeting the 1D MA200 (orange trend-line). Closing above that, can target the upper Fibonacci levels one by one. Until a 1D MA100 break-out takes place though, Selling targeting the bottom (Lower Lows trend-line) of the Channel Down is the go-to trade.
-------------------------------------------------------------------------------
** Please LIKE 👍, SUBSCRIBE ✅, SHARE 🙌 and COMMENT ✍ if you enjoy this idea! Also share your ideas and charts in the comments section below! This is best way to keep it relevant, support me, keep the content here free and allow the idea to reach as many people as possible. **
-------------------------------------------------------------------------------
You may also TELL ME 🙋♀️🙋♂️ in the comments section which symbol you want me to analyze next and on which time-frame. The one with the most posts will be published tomorrow! 👏🎁
-------------------------------------------------------------------------------
👇 👇 👇 👇 👇 👇
💸💸💸💸💸💸
👇 👇 👇 👇 👇 👇
WEMIXUSDT Broke a January trend-line. Major rally ahead.The Wemix Token (WEMIXUSDT) is up +250% since its May 12 Low. This incredible rise has seen the price break not only above the two major Lower Highs trend-lines (of the Nov 21 and Dec 22 2021 Highs) but also above the 1D MA50 (blue trend-line) and yesterday the 1D MA100 (green trend-line). The latter, was the first break above this trend-line since January 11 2022.
That alone could be enough to justify the trend shift from long-term bearish to long-term bullish. What adds more weight to it, is the 1D LMACD indicator which reached a level we saw last time on October 22 2021, right when the major 1 month rally was starting.
Naturally, the immediate target is the 1D MA200 (orange trend-line) around 6.500. Don't be surprised if the price pulls back to gain more buyers and test the 1D MA50 as a Support, if the 1D MA100 breaks. On the longer-term, see how well the Fibonacci retracement levels match Resistance and Support levels during the downtrend. Technically those are the gaps to be filled after the 1D MA200 breaks.
--------------------------------------------------------------------------------------------------------
Please like, subscribe and share your ideas and charts with the community!
--------------------------------------------------------------------------------------------------------
