BTC - ON WHALE SETUP RED ZONE - ETN below 36KHello trading friends,
This is an update for BTCUSDT depending on the last trend.
We are at this moment on an important whale zone - where we did add before about it. see the chart below. 37.8 is an important whale zone.
For more details check the before view.
We are exactly now on the time frame of whale setups - this could bring us to the expecting target of the ETN tool as you can see below 36K trend.
Same time it's BTC - and manage your risk - as there could be more manipulation trends, but even with TA trend BTC entered a breakdown trend - as we did also add before into this chart.
See this chart view as the last trend on live data of BTC - this could change coming time.
Have a great time.
It's not always a must to be into trading, sometimes no trading zone is a good option.
As always don't expect always fast changes - BTC goes on its way.
# This is not a trading call - manage your risks - and know that BTC is into all sides very risky.
Whales

BTC - NEW WEEKLY CHART ABOUT TO START - WHALE RED TRENDHello trading friends,
The new weekly chart will confirm soon - most of the time is the weekend not the real volume trend of BTC - as more stock market makers enter the trend and leave also when stock markets opening.
The new weekly trend could make a change - and since the whale trend is into the red zone - a new difference change can come.
Depending on the ETN tool update - BTC is expecting are to break down in the coming time.
Further info read the next chart view:
Data:
BTC can play between the 2 ranges that we did add before - but since the whale data are red - it's no trading zone.
# we will wait for the new weekly chart to get a confirmation of the trend.
A real whale trend makes a directly real change - trending with small up and downtrend means not much for the real whale trend, as in most time is that to make a price action for manipulation trend. and False Flags are always a trend for crashes.
Have a great time.
# if you like the content give it a like and follow - Thank you

BTCUSDT 🧿 4H There are endless things beyond what we can see.. 🧿
Chart based on Volume Profile and VWAP :
Value Area : Yellow
High volume node : Red
Entry prices : Green
Follow me on Tradingview if you don't want to miss my next analysis.
Going so far then I'm going so far.. ⏱

BTC/USD At best 2X but is it worth itLooking at the larger time frame of BTC... I am of the belief that Bitcoin is pretty much done.... Best case scenario is we hit the high 70K to low 80K.... I think this 150-250K btc story is just smoke and mirrors to allow whales to unload the bags. I could see BTC do a solid retrace or even slightly beat prior ATH...but the real opportunity is in the ALTS during this time... specially ones that have not really recovered or dont anything monumental. (DASH/XRP/EOS) The ones no one it really talking about outside of its die hard communities.
Also I have no idea what I am talking about

DOGECOIN 1D Clean Chart 📈🐋DOGEUSDT 1D
There are endless things beyond what we can see.. 🧿
Based on Volume Profile and VWAP (48 84 96)
Going so far then I'm going so far.. ⏱
Follow me on Tradingview if you don't want to miss my next analysis.

BTC CONFIRMED REJECTION📊 #BTCUSD ( Bitcoin )
🕒 Time Frame: Daily
➖➖➖➖➖➖➖➖
🟡 #BTC dips to the $42,000 mark, after hitting the dynamic trendline and being rejected from the 46500$ Zone. $42,000 is the zone of major support too and expecting a pump. You can expect some
accumulation/ range before then bounce. Use proper stops in trades as the market may become Volatilein the coming days.
AmirHossein
📅 02.012.2022
⚠️ (DYOR)

ETN - EDUCATION TRENDS - THE CODE OF WHALES.Hello trading friends,
This is an education trend for BTC Depending on backtesting.
Those trading for years know that trading has different cycles - and for those that invest for the long term want to be into the green cycle, and end the trading on the red cycle - their high goal is not to trade but building capital.
Backtesting of the BTC chart shows different cycles, like the ones here below in the cycle model example.
As you can see above into the chart - those following a cycle system wait for some time as months before canceling the cycle, This is also the best investing way. It's also low stress and all are managed before taking any long-term cycle order.
Most will ask how to find a cycle trend this depending on monthly expecting.
If you see for example The next month did make a confirmation above the last month, then it's interesting to check why this happen, this is only a small reason for starting a new cycle, but there is a need for more to confirm.
the cycle like following the interest of the project and also counting with TA.
Month 3 is very important in the cycling world. this month makes in most time a difference into a trend. These are also for the month may as confirmation.
THE CODE OF WHALES.
Every whale wants to connect with other whales to be a powerful whale. some whales know each other. but some whales not, but even then they can meet each other with no word on the trading connecting world. They have learned the code of the chart. what means some times a chart shows a way of trending where the whales get a signal that the trend looks to breakdown or to increase by other whales . I have seen personally many patterns that come seem out, and I believe they work on the chart code.
What I mean with the code is this could be a number, that come by any crash trends, and also on another trend of the way with the star move that a trend makes.
Not anyone can win into trading - because when you win someone else loses. but you can win as a group and that's the goal of whales. so connecting them together is them a most important goal, even they can't see each other.
When its possible to make good profits?
The most users that did make good profits are those who did hold the cycle of the green trend of the crash. this hodl should be not more than 10% of your totally assets. and also most check to the price of coins, it's more important to check to the project and the market cap. also, a trend that ends most time into profit is buying when there is a crash trend. also, dollar cost avenge has a good option for the long term.
We can read more books about how to manage our losses and all things, but if we don't change ourselves it will be always the same. so it's important to change ourselves first.
Hope that I have given a small view about cycles trends, that's interesting to read self more about it.
# The goal of whales into breakdown trends to let you feel there is a new bull trend coming - making fake pump trends that end with crash trends - this happened into backtesting of history more times as the chart shows - so not every pump are real, and not every breakdown trend. but one thing is confirmed more times when there is high fomo know its a very risky zone. because whales - market makers should take the profits. there is not a chart that is going only up.
Have a great day - which you best trades coming time.
If you like this content give it a like - and follow - thank you.

Whales are luring trader to build short positionWe are in the Phase 4 (Refill short fuel) of bulls attacked and whales are luring trader to build short position
COINBASE:ETHUSD
COINBASE:BTCUSD
Phase 4. KD80 -> KD 60-70 (Mild) or KD 40-50 (Aggressive):
Market makers completed the first short-squeeze and most retail investors started to open the long position. Therefore, the price correction will happen in the short term because the fuel of short-squeeze is not enough.
See the Funding Rates of BTC(Ð), the fuel of short-squeeze is not enough.
upload.cc
Thus, we are in the Phase 4 (Refill short fuel) of bulls attacked and whales are luring trader to build short position.
There are two mode to lure trader building the short position:
1. KD from 80-100 fell back to 60-70 (Mild): ETH price 2950-3100USD
or
2. KD from 80-100 fell back to 40-50 (Aggressive): ETH price 2700-2800 USD
Ps: If you want to understand the complete process of strong bulls attack (5 steps), please check my previous articles :D.
----------------------------------
Analyst of cryptocurrency Yu-Shiuan Chen (CQ & Tradingview Taiwan)

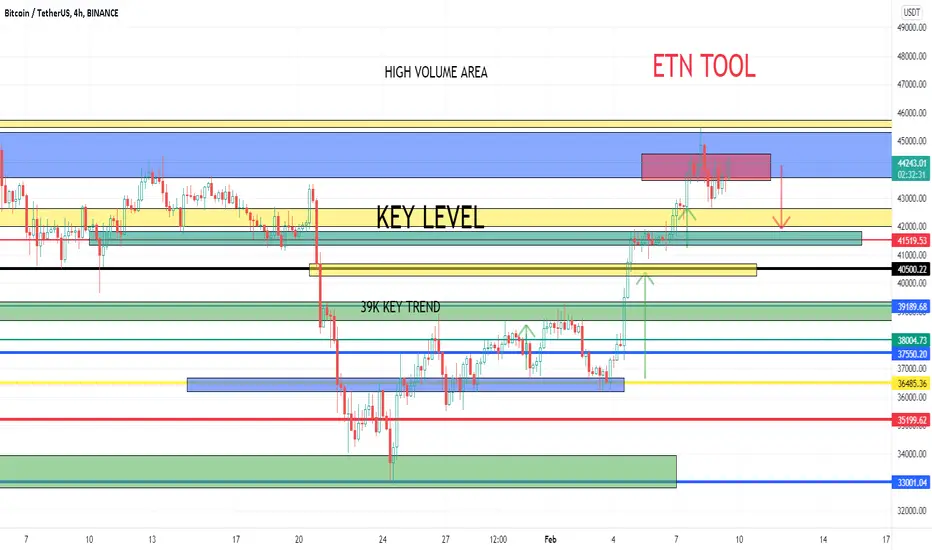
ETN - BTC CRASH TREND EXPECTING 41K and below and explainHello trading friends,
This is the last ETN update for this time with the confirmation of possible crash trends on BTC.
Don't see this as a trading signal, this is just complete from the ETN trend, and you should trade on your way and have riskmanagement as best possible.
This update means not much for those just trading small time frames.
Why this update?
Some did ask about what I mean by low time frame breakdown trend - is that also a BTC crash trend expecting?
Yes depending on ETN live data we could see this as a crash trend expecting - the 41900 are the split zone with time frame.
Know that it does not mean that it should happen right directly, BTC goes on the way, even with more fake increases could happen, but its about the end result. and whales playing very smart to shows all are fine.
I hope I have made clear the update depending on the ETN tool and its not depending on TA.
ETN tool works depending on whale trend.
There is no reason to take an action after this update - as you should trade always depending on your plan.
Have a great time with the last ETN update for this time.
The ETH market is in the Phase 3 (Short-squeeze) of bulls attackThe breakout of ETH market happened as we expected and the ETH price had risen rapidly more than 10% in the past few day.
The order of strong bulls attack (ETH price may up to new high) including 5 Phase. Now we are in the phase 3 (KD 50 -> KD70-80, and KD>70 more than 3 days) that I mentioned in my previous articles.
check the funding rates:
upload.cc
Phase 3 (Short squeeze). KD 50 -> KD70-80, and KD>70 more than 3days:
Market makers carry out the strong short-squeeze ( bullish ), and price rise rapidly. The fuel of short-squeeze decreasing as price rising (see the funding rates).
Wonderful performance may be coming! Good luck!
Ps: If you want to understand the complete process of strong bulls attack (5 steps), please check my previous articles :D.
----------------------------------
Analyst of cryptocurrency Yu-Shiuan Chen

BTC Technical Analysis - 02/07/2022 BTC broke out from its downtrend resistance line 02/04/2022 and will have sustained a breakout for 3 consecutive closes as of today.
We have support at the 40700 level, and resistance at 47000.
A pull back to support would be healthy for this breakout as we are reaching very over bought levels on the RSI momentum indicator.
If the 47000 level is broke, look for resistance at the 200 Day MA.
watch for higher highs, and higher low when trading. Exits for BTC would be if we start to make lower highs, and lower lows.
Further selling off of the SPX would put down pressure on BTC - we still have not broke the downtrend resistance on the SPX.

Bitcoin key levels to watchGo push Like & Subscribe
This the 4H Bitcoin/USDT chart
Here I have placed the most important price levels so we can have a better understanding of where is the price moving.
Yellow: 1D blocks
Purple: 4H blocks
Have a nice weekend fam
Cheers ;D
Go push Like & Subscribe

SOLUSDT 1D with a vision of a whale 🐳This clean chart is based on VWAP and Volume profile.
I think the whales will defend their entry prices.

BTC - Humpback Whale LogicNo explanation needed, it is what it is..
We will stop diving in the deep soon.
Lets fill our bellies before heading up.

2022/1/21 [ETH] Best buy-point will appear!2022/1/21 Best buy-point will appear!
COINBASE:ETHUSD
COINBASE:BTCUSD
The condition of market is still healthy, and the ETH exchange reserve continues to decline, best buy-point will appear.
See the CryptoQuant (ETH reserve) chart that I mapped:
upload.cc/i1/2022/01/21/SfI7hY.png
The market is in the process of long-squeeze, and this long-squeeze is stronger than other cases (2020/3, 2020/9, 2021/5-7), in order to drive out the retail investors.
Generally, the order of strong bulls attack (ETH price may up to new high) including 5 steps:
1. KD indicator (1D) <30 more than 3 days, price keep falling down and retail investors are panic. Market makers do the upward crash, that is market makers wash the retail investors who with less confidence will sell out and leave the market.
2. KD 20 -> KD50. Market makers just completed the upward crash and price started to rise. At this time, most retail investors open the short position, that means the fuel of short-squeeze is enough. Hence, short squeeze will start in the short term.
3. KD 50 -> KD70-80, and KD>70 more than 3days. Market makers carry out the strong short-squeeze (bullish), and price rise rapidly. The fuel of short-squeeze decreasing as price rising.
4. KD70-80 -> KD50. Market makers completed the short-squeeze and most retail investors start to open the long position. Therefore, the price correction will happen in the short term because the fuel of short-squeeze is not enough.
5. KD50 -> KD70-80 again. Two line of KD indicator formed golden fork and KD up to 70-80 more than 3 days again (short-squeeze). Volume and price increase simultaneously, and most retail investors start to open the short position. At this moment, the next bull market is coming, time to appreciate the performance of market makers (whales).
Wonderful performance may be coming! Good luck!
----------------------------------
As an analyst, I think that I can't predict the direction of market, but I am ready for a strategy of bullish or bearish .
Analyst of cryptocurrency Yu-Shiuan Chen

BTC - 45K TARGET FOR THE NEXT DAYS Bitcoin shows price strenght in the last hours from nowhere, must be whales.
retest in 1h/4h are not likley to happen in those situations, at most only ranges and higher highs breaks .
I take profit from my swing trade at 45K.
200ema and strong resistance should reversal the trend.

huge pump coming ))))after break up the trendline above it can pump so far dont miss that folks
push like and follow for more ideas and giving good energy thx :) BINANCE:MATICUSDT

BTC Fakeout or Breakout Bitcoin whales and institutions love to push the price past resistance, where this movement will trigger short stoploss market orders (aka stop buy limit orders) and also buy stop limit orders.
Both of these in tandem creates a low-grade short squeeze used as liquidity to sell into.

$BTC MAJOR PRICE TARGET THIS YEAR we tested the strongest support for this year, which will show if we going to see a bullish momentum if we hold it, and bearish momentum if we break it , that's it ,simple and straight forward .

How long takes for FTM to reach new ATH!!!According to whalestats.com during these days top ETH whales start to accumulate FTM, if it's going to continue next days and the amount of FTM which is hold by Exchanges drop more.
FTM could submit a new ATH. although short correction would be inevitable to gain enough power to break resistances just like what we see with MATIC.

Matic important area A very important area for Matic , which, according to market conditions, will create a good deal of trade in the short positions.

Interesting similarities between BTC phasesBTC current Price Action is starting to appear increasingly similar to the PA we saw throughout the bearish period of Summer 2021 !
Color coded are the similarities i found and they are relatively indifference bar from the yellow markings failing to make a real attempt at recovery.
The PA were currently having has the same tone to the summer where dumps were carefully controlled by whales as they gradually filled their bags awaiting the uptrend to begin. Im overwhelmingly bullish on this PA and feel BTC has found its bottom for now !
An analogy i liked was the comparison to the current PA and a ball held under water ... once the downward pressure stops it will erupt upwards.
My LTF target is : 48k held comfortably
My MTF target is : 52k reached
My Q2 target is : 64k reached

Follow up from my last graph BTC 150kfrom the last chart i believe we are being supported just fear selling is happening at the moment, but i believe the up trend it coming and it on the way if we don't jump from hear i expect a double bottom W pattern to happen and surge prices but we are currently in the last leg of a W pattern just waiting on surge confirmation or jump out chart
i'm no financial advisor, this is just for entertainment purposes and i advise al traders so do their own research.
Comment if you own about 20 Million Shiba and what is your plan in this market?
Enjoy the day, and remember this isn't a place for emotions.
only invest what you can afford to invest
