Wheat Futures potential for further bearish momentum! | 17th MarPrices are on bearish momentum and abiding by a descending trendline resistance. We see the potential for a dip from our sell entry in line with 1069.58 in line with 23.6% Fibonacci retracement towards our Take Profit at 963.67 in line with 161.8% Fibonacci expansion and 61.8% Fibonacci projection. Technical indicators are showing bearish momentum.
Any opinions, news, research, analyses, prices, other information, or links to third-party sites contained on this website are provided on an "as-is" basis, as general market commentary, and do not constitute investment advice. The market commentary has not been prepared in accordance with legal requirements designed to promote the independence of investment research, and it is therefore not subject to any prohibition on dealing ahead of dissemination. Although this commentary is not produced by an independent source, FXCM takes all sufficient steps to eliminate or prevent any conflicts of interest arising out of the production and dissemination of this communication. The employees of FXCM commit to acting in the clients' best interests and represent their views without misleading, deceiving, or otherwise impairing the clients' ability to make informed investment decisions. For more information about the FXCM's internal organizational and administrative arrangements for the prevention of conflicts, please refer to the Firms' Managing Conflicts Policy. Please ensure that you read and understand our Full Disclaimer and Liability provision concerning the foregoing Information, which can be accessed on the website.
Wheat

WHEATFUTURES on bullish momentum! | 16th March 2022Prices are on bullish momentum and abiding to our ascending trendline. We see the potential for a bounce from our buy entry at 1126.86 in line with 23.6% Fibonacci retracement towards our Take Profit at 1192.91 in line with 50% Fibonacci retracement. Prices are trading above our ichimoku cloud support an also RSI is on bullish momentum, further supporting our bias.
Any opinions, news, research, analyses, prices, other information, or links to third-party sites contained on this website are provided on an "as-is" basis, as general market commentary, and do not constitute investment advice. The market commentary has not been prepared in accordance with legal requirements designed to promote the independence of investment research, and it is therefore not subject to any prohibition on dealing ahead of dissemination. Although this commentary is not produced by an independent source, FXCM takes all sufficient steps to eliminate or prevent any conflicts of interest arising out of the production and dissemination of this communication. The employees of FXCM commit to acting in the clients' best interests and represent their views without misleading, deceiving, or otherwise impairing the clients' ability to make informed investment decisions. For more information about the FXCM's internal organizational and administrative arrangements for the prevention of conflicts, please refer to the Firms' Managing Conflicts Policy. Please ensure that you read and understand our Full Disclaimer and Liability provision concerning the foregoing Information, which can be accessed on the website.

Position is open CF CF Industries Holdings, Inc. manufactures and sells hydrogen and nitrogen products for energy, fertilizer, emissions abatement, and other industrial activities worldwide. Its principal products include anhydrous ammonia, granular urea, urea ammonium nitrate, and ammonium nitrate products. The company also offers diesel exhaust fluid, urea liquor, nitric acid, and aqua ammonia products; and compound fertilizer products with nitrogen, phosphorus, and potassium.
It primarily serves cooperatives, independent fertilizer distributors, traders, wholesalers, and industrial users. The company was founded in 1946 and is headquartered in Deerfield, Illinois.

ridethepig | Wheat for the Yearly Close📌 @ridethepig ZW1! Market Commentary 17.12.2020
For buyers the breakout creates the typical starting point, one we have seen many many times before. The fact it is happening on the monthly chart is very telling, this is threatening to impulsive explode to the topside via shortages on the supply side from lockdowns and contractions in globalisation.
Whatever may be the case on the climate side (and I am certainly no expert here) it has been one of the biggest crops on year for Russia. Fertile farming at its best... Tracking closely the 600 support, for a move towards 900 and 1350 ... watch out for any battle against this in the coming weeks as we enter into a commodity cycle.
Thanks as usual for keeping the feedback coming 👍 or 👎

Wheat: Is the bull market over?Hello and Welcome,
We expect wave (3) to end at 1157.6 which at this level wave (3) will equal 3.618 multiply of wave (1).

What you need to know to trade wheat futures in 2022Fears of the impact of Russia-Ukraine war on global inflation and recession have escalated in recent weeks and another major issue looming over the horizon are concerns that the conflict could result in a hunger crisis as both countries account for over a quarter of the world’s wheat exports.
Wheat prices recently surged to a 14-year high, with the price of a bushel of wheat soaring more than 50% to $12.94 on Monday since the Russian invasion of Ukraine began. The price movement on Monday hit the Chicago Board of Trade’s limit for another day.
Reliance on Russia and Ukraine wheat exports
Russia and Ukraine are two of the world’s largest exporters of wheat, accounting for about 30% of the global total. In 2019, Russia was the world’s top wheat exporter, while Ukraine came in fifth next to the US, Canada and France, according to data from the Observatory of Economic Complexity.
The disruption in both countries’ grain harvest and trade could have catastrophic impacts on their biggest buyers in the Middle East including Egypt, which depends on Ukraine’s wheat imports to produce subsidized bread to its poor population and other staples.
These fears intensified on Wednesday after the Ukrainian government said it will ban exports of key agricultural goods like wheat, corn, salt, meat and oilseeds to maintain market stability in Ukraine and “meet the needs of the population in critical food products.
Looming food shortage
Many nations rely on Ukraine and Russia for grain and oilseeds and the crisis could exacerbate the supply of food especially at a time when low-income countries are still reeling from the COVID-19 pandemic.
Some economists have warned that the war could lead to a repeat of the Arab Spring in the past decade when social unrest and armed rebellions led to soaring food prices.
"The fallout from Ukraine will spread across the globe. Russia and Ukraine together export 30% of the world's wheat. As this war heats up, many countries will face: soaring food prices, catastrophic hunger & growing instability,” David Beasley, the head of the United Nations World Food Program said.
Farmers in Russia and Ukraine are tipped to reduce their planting area in the coming seasons as the war intensifies, placing the pressure on other exporters to boost production.
China, India, US work to fill in the gap
Although Russia and Ukraine’s grain trade have not been technically included in sanctions imposed by Western countries, many importers have turned to other sources like China, India and the US to make up for any shortfalls, according to ING Bank, over fears of supply disruptions.
“We would expect to see strong plantings from US farmers over the spring, leaving the potential for an increase in US spring wheat, corn and soybean area,” ING’s head of commodities strategy, Warren Patterson, said in a note on Monday.
Volatility in wheat markets
The lingering crisis in Ukraine has caused wheat prices to be highly volatile in recent weeks as countries work to ensure grain imports to feed their population. The CBOT soft red winter wheat, KC hard red winter wheat and MGEX spring wheat all reached their daily trading limits for another day on Tuesday, while US wheat futures snapped a six-day winning streak the same day.
Investors have been hesitant in making big position moves for the second week in a row last week despite the market volatility, Reuters said.
In the week ended March 1, commodity funds axed only 11,000 futures and options contracts from their CBOT wheat net short, down from estimates, the news outlet reported earlier this week, citing data from the US Commodity Futures Trading Commission.
"Huge speculative interest has flowed into wheat that may have pushed futures past reasonable levels… The export market is difficult to define with many countries banning exports and tenders being canceled,” CHS Hedging was quoted by Bloomberg News as saying.

Mar 8, 22 Wheat Profitable TradeWheat came back up on a tear so I decided to Take Profit at 1315 from 1250 for some nice profit.
My plan now is to wait for wheat to fall back some overnight and buy again either late tonight or tomorrow and ride price up again.
Congrats to all who followed this trade - enjoy your Profits!!
Stay safe.
Heiko

WHEAT SHORTS 📉📉📉📉 Expecting bearish price action on WHEAT as price should retrace back to fill the BULLISH GAP'S, we are in a bullish market strucutre on a HTF but right now i expect the retracement
What do you think? Comment below..

2022 RECESSION (Wheat Price Shock)The price of Wheat is going parabolic and most of you are wondering, does this spell a recession?
Historically, almost every time wheat prices spiked; a recession soon followed.
In the early 1970's when wheat prices peaked, the markets pulled back 41% in about a year.
Then, in the early 1980's, we saw the market pull back 23% in about 600 days.
Interestingly enough, in 1996 when wheat prices soared, there was no recession.
Lastly, in 2008, we see the market pull back 44% in about a year.
For the record, a recession usually follows a wheat price shock but not every time like the one we saw in 1996.
Now the question is will this time be different or WORSE because we a shock in the oil markets, wheat markets, and we have an ongoing war between Russia and Ukraine.
Let me know in the comments below what you think. And if you liked this post, make sure you subscribe for more.
Thank you!

COMMODITIES running wild everywhere. Decade-long cycles in play.The talk of the street, since the war broke out between Russia and Ukraine, has been how aggressively commodities have been rising. Of course this rise hasn't started this month or the previous but is the outcome of inflation running high on historic levels since the March 2020 COVID crash, when global central banks (more importantly the Fed and the ECB) engaged in enormous economic rescue packages through liquidity by money printing at a historic pace.
I have excluded Gold (XAUUSD), which is the obvious counter to inflation and safe haven during times of geopolitical unrest and instead have included WTI Oil, Corn, Lumber and Wheat as representative commodities. I will not go into detail for each one separately, as the charts are pretty much self-explanatory. The goal here is to illustrate their long-term Cycles and how similar today's rise is to those of the previous cycle.
As you see, what is happening today is no different to what happened in the previous Cycle. All commodities seem to be approaching their respective symmetrical tops when compared to their previous Cycle. That is more evident on WTI Oil, Corn and Lumber. When their previous Cycles peaked, the price always went back to the 1M (monthly) MA200 (orange trend-line).
If you are a long-term investor, such charts help at giving a very clear perspective as to what action should be taken in portfolio making.
--------------------------------------------------------------------------------------------------------
** Please support this idea with your likes and comments, it is the best way to keep it relevant and support me. **
--------------------------------------------------------------------------------------------------------

THREAD #2 : Commodities Update ‼️How it works ?
Ask me in comment my chart analysis of the asset you want if it didn't have already done under. If I find something intersting to say and show, I will update the idea with it. A comment of each asset expose will be post under, come react about it or debate.
Before to start I want to remind that we are in a period of conflict and news can emerge at any moment with strong effect and reaction on market. So invest carefully on this hard times and reduce your loss exposition on market when you can. Don't forget to take profit too.
"Making money in trading is math and respect of strategy, so never let your emotions guide you in uncomfortable positions"
As I've already done ideas on copper last months, let's start with it.
COPPER ✅
First of all, if you follow my ideas you can see it's the same chart than the 29th of December when I posted it and the 20th of January for the trade. It is attached under and I invit you to see it because it will be the continuation of these analysis.
So we are always in the Wyckoff Accumulation which have been developped, pullback on creek is done, and SOS too. Unfortunetly SOS failed so for me it's an end of the pattern. By consequence major part of my position have been closed and I will explain next why I keep a little which I not do usually. Why SOS is a fail ? Simply because we have selling volume, on the resistance area, on a primary resistance (yellow line) and because we have also selling pressure in it. The work have been done for the pattern, we took profit but can't project anymore in a term of "Wyckoff accumulation" of a bull continuation. So what to expect now from it ? The standard expectation after a failed SOS is to go back on the support area, usely rapidly and strongly, and invert the pattern in a way that we will now test the buying strenght on support. So we can expect a retest of support with an SOS to see, if it succeed, a bear continuation. That my scenario (a), and technically the most probable for me. BUT we have to live with our time and with the macroeconomic dynamic that we deal with. I will not hide that if the conflict between Russia-Ukraine continu and maybe gets worse, this will be a boost for every metals assets. That why I closed only 80% of my position, I can't advise to take long position anymore but it's could be wise to take profit and keep a part of your position if you are already in it. We can handle the technics evolutions but we can't handle the macroeconomic evolutions. If it this scenario (b) happen, we will see the construction of an LPS around $4.60 before to break up to the target around $5.70 in a first time. Take care of volatility, it will swing.
GOLD ✅
Like for the copper, the chart don't have change since the commodities update of the 20th of January. We are coming to the end of the bull scenario. I invit to take profits on the conjoncture of the resistance area and the (2c) resistance. There is no interest to sell a refuge asset like gold, even more in this time of conflict. So if there is selling signals take it like an opportunity to buy it lower. Especially here, we will wait for buying signals on the (1b) or (1a) support and the best case would be the support area of $1,700 - $1,675 but far from now. For peoples already exposed on it, if it continu is bull movement and breakout the resistance area, we will be in price discovery so it's always hard to find targets in it because of volatility, but I don't expect it to go higher than $2,500 - $2,600 where we will probably find a big selling pressure.
SILVER ✅
Like targeted in the last commodities update we are now on resistances of the downward channel. I don't expect a breakout of (1b) and the resistance area, so for me we will see the construction of a range between them around $27 and $29. The biggest probability for me is a bull outcome of the range to target the (1c) resistance (scenario A) and probably more after. If we reject the resistance strongly after lateralization I expect price to go deeply retest the (1a) support around $20 (scenario B). And finally if we see a reject of (2a) / (1b) soon, we could expect a short consolidation to (2b) before to go back again to the resistance area (scenario C). Like every metals, It would be dumb to expose yourself on the bear side in a period of conflict. More wise to wait consolidation and signals around the orange circles areas.
PALLADIUM ✅
Palladium is another successfull prediction we had in the last commodities update. In term of evolution now it is very close from the copper analysis because we made an SOS which has also failed. So technically, the biggest probability is to see it go down on the (2b) line in a first time (scenario A) maybe more with (1a) before to retest the resistance (1b). If the macroeconomic dynamic bring it higher we could see an interesting area to enter on a buying signal on the pullback on (1b) (scenario B). Else we could go straight to (1c) around $4,500 - $4,600 before to see a strong selling pressure on price discovery.
PLATINUM ✅
Platinum is also targeting the prediction of the last update. In term of perspective now it's more blurry for it. The most interesting pattern that we could see is for me a reject of (2a) to go down to (2b) which could be a nice entry on signal around $950. Else, probabilities to see it continu on the bull side are strong but I'm not confident on any areas, except the support of $860, to target entries once we will reach the resistance area of $1,340 - $1,270.
CRUDE OIL ✅
I said in last update : "If I had an advice to give : stay away or be on short timeframe on this asset. Too much risk to see price manipulated by news on this public interest asset." and so after +30% in a week we have to look back on montly timeframe to search resistances. I believe in the fact that it will fall as rapidly as it surged and I also believe in the fact that we will not stay a long time at this level. Oh .... wait ! Just don't take care of what I just said, like the last commodities update it's just a manipulated asset and price will go where OPEP want to see it. So stay away of it.
For those who really want my technical analysis it is : I think we can do an ATH just to say : "It's all time high !" but we will find a strong selling pressure because of (1b) and fall down rapidly.
WHEAT ✅
Similar to oil technically, boosted by the macroeconomic context we did a new ATH and seen a strong selling pressure. However I don't think it's wise to sell it. We totally outbreak the range we was looking to in the last update, now if we break the resistance it could go really high but you will be attached to macroeconomic news so I advise to also stay away of it in both side.Take profits if you are exposed on it.
SUGAR ✅
Rectification from the last update : we are always in the Wyckoff reaccumulation. I thought it failed because of the candle of the 10th of January but it seems to be an anomaly of market and the structure around the 28th of February confort me in the fact that it is a spring. Now we have jumped over the creek so the best area to target entry is, like for the copper pattern, the pullback on the creek. It's exactly the same pattern that we had on copper now, so just wait signals. If it go straight without pullback just let it go and don't buy in the resistance area before a breakout, there is a lot of resistances which will bring many pressure I think for the SOS.
🛑 Like, follow or comment if you like, it give me some strength to continue! 🛑

WHEAT....to the moon?Good morning Traders
It has come to my attention that people didn't know the fact that Russia is the world's largest exporter of wheat. And Ukraine is the fifth largest exporter.
Anyways, here's the chart. Make your own conclusions.

Wheat Futures - Hit All TIME HIGH after gap up haltsWheat Futures - Hit All TIME HIGH after gap up halts. Wheat is up 75% since January. The conflict around the world has accelerated the movement in the wheat market. What will the US do to bring things back into balance?

Mar 7, 22 Wheat back up - BUY OppWheat came down for the first time in over 5 sessions so I was looking for a pullback and then I could hopefully get into a Buy Order. I did put in a Buy order at 1250 less than an hour ago.
Markets are crazy wild with prices moving a lot. Like I have said all day today, I believe over the next 2 weeks Wheat and Corn will continue to go up. Definately there will be some volatility, but I think price will go up and I will make some money.
I will keep as close an eye as I can on these trades (I have to sleep sometime), but I will keep my stops further away for these trades so I don't get caught.
Trade well and stay safe.
Heiko

Wheat: extreme levels and it will continueIt doesn't matter its overbought, the price continues rising. The war can create one-time only events in the markets. We've seen the Russian Moscow Exchange closed for more than 1 week, USD/RUB skyrocketing and commodities such as Wheat going up completely out of control. We bought Wheat more than a year ago and we've added more volume as the uptrend continued, but seeing these events, we increased even more volume 2 weeks ago and we will continue to do so as this Ukraine-Russia crisis keeps escalating. In European countries, depends a lot on Wheat from Ukraine, and that was completely halted since the beginning of this war. Also, according to some food producers, they have stock for 2 months tops. They don't have an alternative solution for this. Food prices are going up, and if this war continues, many food produces in the EU will not be able to produce wheat-based food in normal figures. The situation is very critical at this point. Disruption could last half a year at minimum. We hold it and add more volume daily as long as this crisis continues.

WHEAT MNT: 100%+ gains and TP 3 000 USD going vertical(NEW)Why get subbed to me on Tradingview?
-TOP author on TradingView
-2000+ ideas published
-15+ years experience in markets
-Professional chart break downs
-Supply/Demand Zones
-TD9 counts / combo review
-Key S/R levels
-No junk on my charts
-Frequent updates
-Covering FX/crypto/US stocks
-before/after analysis
-24/7 uptime so constant updates
🎁Please hit the like button and
🎁Leave a comment to support our team!
WHEAT MNT: TP 3 000 USD going vertical(NEW)(SL/TP)
IMPORTANT NOTE: speculative setup. do your own
due dill. use STOP LOSS. don't overleverage.
🔸 Summary and potential trade setup
::: WHEAT MNT chart review
::: chart is LOG SCALE
::: commodity super cycle in progress
::: 5 waves bullish sequence in progress
::: Price target in 2022 is 3 000 USD
::: global inflation driving prices
::: also global warming heavy impact
::: geopolitics triggering vertical market
::: recommend to BUY/HOLD BUY DIPS
::: 12/24 months as global economy
::: this is a long-term bullish market
::: BULLISH CYCLE is ON BUY DIPS
::: BUY/HOLD get paid / swing trade setup
::: BUY ANY DIPS / final TP BULLS is 3000 USD
::: 150% upside from current market price
::: WAIT for dips and reload (BULLS)
::: recommend to BUY/HOLD
::: recommended strategy: BUY/HOLD
::: bullish super cycle in coffee market
::: SWING trade setup do not expect
::: fast/miracle overnights gains here
::: good luck traders
🔸 Supply/Demand Zones
::: 1000USD fresh demand zone
::: 3000USD fresh supply zone
🔸 Other noteworthy technicals/fundies
::: TD9 /Combo update: N/A
::: Sentiment short-term: BULLS / MORE GAINS
::: Sentiment outlook mid-term: BULLS / SUPER CYCLE
RISK DISCLAIMER:
Trading Crypto, Futures , Forex, CFDs and Stocks involves a risk of loss.
Please consider carefully if such trading is appropriate for you.
Past performance is not indicative of future results.
Always limit your leverage and use tight stop loss.

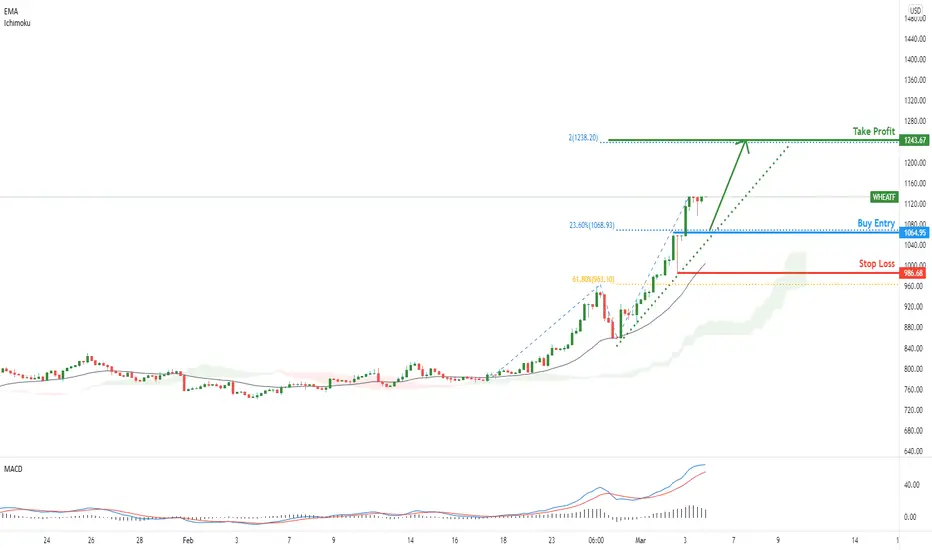
Wheat futures, potential for bullish continuation! | 7th MarchPrices are on bullish momentum and abiding by ascending trendline support. We see the potential for a bounce from our buy entry at 1064.95 in line with 23.6% Fibonacci retracement towards our Take Profit at 1243.67 in line with 200% Fibonacci Projection. Technical indicators are on bullish momentum.
Any opinions, news, research, analyses, prices, other information, or links to third-party sites contained on this website are provided on an "as-is" basis, as general market commentary, and do not constitute investment advice. The market commentary has not been prepared in accordance with legal requirements designed to promote the independence of investment research, and it is therefore not subject to any prohibition on dealing ahead of dissemination. Although this commentary is not produced by an independent source, FXCM takes all sufficient steps to eliminate or prevent any conflicts of interest arising out of the production and dissemination of this communication. The employees of FXCM commit to acting in the clients' best interests and represent their views without misleading, deceiving, or otherwise impairing the clients' ability to make informed investment decisions. For more information about the FXCM's internal organizational and administrative arrangements for the prevention of conflicts, please refer to the Firms' Managing Conflicts Policy. Please ensure that you read and understand our Full Disclaimer and Liability provision concerning the foregoing Information, which can be accessed on the website.
Disclaimer
Weekly Levels Strategies: Support/Resistance Crypto, Stocks, etcBitcoin, Ethereum, Solana, and cryptocurrencies as a whole are caught in consolidation where a breakout to either side will define the trend. Stock market indexes of S&P 500 and Nasdaq have given a bullish signal but where will that change? Commodities like oil, wheat, and corn are ripping. Gold and Silver are giving bullish breakout signals. Tech stocks are teetering on edge while defensive plays like utility stocks are rising.

WHEAT SHORTS 📉📉📉This week i expect bearish short move on WHEAT as price finished its impulsive movement on the bullish market strucutre, price made a lot of bullish gaps on its way to the current price meaning it will go lower soon to fill those gaps.
On a long-term basis i am still bullish and i will look for LONGS once retracement ends, this is kind of a risky counter-trend trade.
What do you think ?


Limit UP!This is what happens when two of the world's largest wheat producers start fighting each other.

WHEATUsing just the Price/Trend indicator on its own, we would have made +40% - we had 2 opportunities to BUY on 4H - however we slept on this as we were too busy trading Crypto to remember that Ukraine is one of the biggest Wheat producers!
Interesting to see where it will fall - Sell the News ...

Wheat Futures - /XW - Parabolic Moves on Monthly ChartWheat Futures - /XW - Parabolic moves to the upside recently - Will it hit all-time highs? Will food prices increase to new levels in the grocery store? Are they already higher? 50% target has been hit in last couple months.
