Inverted head and shouldersAs you see we have invertet head and shoulders, with the begining of right arm. Also we have long position on MACD on daily chart.
Wheat

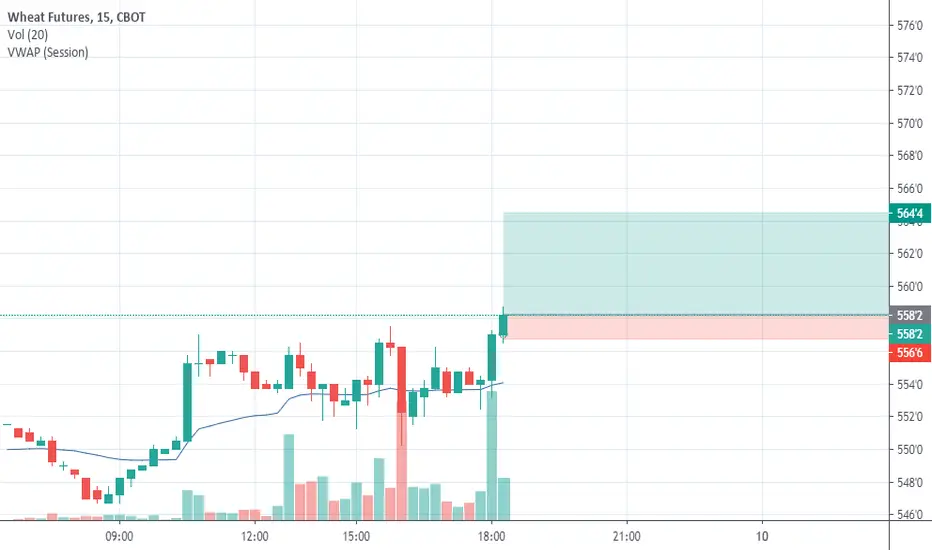
ZW1! Futures Chartthere is a probablity that the market will be bearish on short term after his bullish movement


Uptrend in wheat with clear targetBit of a longer term idea. We see a clear support line, heading up. Forms a decent basis for wheat prices. It shows a few high's over the last years, which form a clear target.
Take length with your own preferred SL/TP.
Trading is not about copying but about forming your own opinion.

Wheat On a Weekly chart target the HARVESTING time.During HARVESTING every year wheat prices increase and on the weekly chart the current price is in a strong support this is why I think its a very good opportunity for an investment.


WHEAT CFD updates just a quick update on this and its looking good so need to stay patience and lets wait for the right time with this one, there's a few outcomes along the way and we need to adjust with the markets as well!!
this can always break and still go down if so i will update this idea

Is the Crisis over and demand for wheat is low?If the price crosses the supports level at 5.294 and 5.253, the next target is at 4.917.

wheat, gas, AUDJPY, breakdowns on them all looking really clean little breakdown on a few pairs in the title and there's some good selling and buying opportunities across the board i hope you enjoy and let me know what you think as well have a great weekend :)


Wheat Futures Turn LowerWheat futures are currently retracing an upthrust. This upthrust failed to make a higher-high of the prior move. Because this upthrust failed to make a higher high, Wheat didn't enter into an uptrend. Therefore, I'm looking for a healthy retracement of our latest move.


Short Wheat 50 Percent Retracement HitShort Wheat 50 Percent Retracement Hit and channeling down to bottom range of 540 then 500 price point.


Wheat forming Lower HighKey levels Identified
- Black line : Monthly Resistance
- Maroon line : Monthly Open
Weekly Timeframe
- Third retest of Monthly Resistance level
- Last week candle close as an inside bar suggests consolidation, Expansion might be coming soon
Daily Timeframe
- Confirmed Bearish Pinbar with a close below its low
- Local 0.618 Fibonacci Retracement level
Idea: Looking for a retrace to ride to the downside. Unsure if this is truly a lower high as a lower high is only confirmed is there is a lower low.

WHEAT FUTURES (KE1!) WeeklyThe Djinn Predictive Indicators are simple mathematical equations. Once an equation is given to Siri the algorithm provides the future price swing date. Djinn Indicators work on all charts, for any asset category and in all time frames. Occasionally a Djinn Predictive Indicator will miss its prediction date by one candlestick .
Dates in the future with the greatest probability for a price high or price low.

WHEAT FUTURES (KE1!) DailyThe Djinn Predictive Indicators are simple mathematical equations. Once an equation is given to Siri the algorithm provides the future price swing date. Djinn Indicators work on all charts, for any asset category and in all time frames. Occasionally a Djinn Predictive Indicator will miss its prediction date by one candlestick .
Dates in the future with the greatest probability for a price high or price low.


Wheat Daily and 4 hour Setup PlayThe idea can be triggered here on the 4 hour, but first let us take a look at the daily chart.
We are at an important resistance zone on the daily chart. At around the 5.82 zone. What has caught my attention is the many indecision candles we have here. The two doji candles, candles with large wicks on either side. What this shows us is that there is a battle between the bears and the bulls at this resistance zone. We should definitely be paying attention to price here.
Moving down to the 4 hour chart, and we can see there are more confluences pointing to a possible downside move, and indeed, presents us with a trigger set up. Just looking at market structure here, it shows us an uptrend with higher lows and higher highs. We have had more than two swings which is what we want to look for.
At this resistance zone, we began to range. Look at the wicks here. The fake out candles. Price began to break out but reversed and closed below the previous open highs. This is why we remain patient and await candle closes before taking trades. This fake out trapped many traders to the upside.
We can also say that not only do we have a range here, but in fact, one can make an argument that there is a double top/ triple top at this level. Another good pattern we look for potential trend exhaustion. Putting those two together, the topping pattern and at a resistance level, already give us a good possibility of a downward move.
What we are now awaiting is for a break below this flip zone here (area that has been both support and resistance) at 5.620. Going back and looking to the left, you can see the importance of this zone with multiple touches. We have had a bounce at this zone but I am looking for a reversal and then a break below the flip zone. This would create our first lower high swing that we can work with in a new down trend. Price does seem ready to roll over.
On the fundamental side, there are stories now about supply chains being disrupted due to the virus. Hearing about rice farming and other crop farming being halted in parts of Asia. Stories like this are out of our hands, but can go against this trade idea. We shall await the developments and see if we get the break.

Week 13/Su - ZW1! - WeekendMost bullish commercials have been in 20 years, im loading up my entire boat with wheat futures
