COT Analysis - Grain SectorThis week, ZL, ZM, ZC & ZW are all setup for shorts based on the COT strategy.
This is a SETUP market, it does not mean short now. It means if I am presented with an entry TRIGGER, I will enter short. Until then, I wait.
Enjoy your weekend.
Wheat

Wheat could be up by at least 7% in the next few daysWheat with little resistance in the zone between 590 and 632 will likely rise 7%.
Any escalation in Ukraine and maintained demand in Egypt will drive the demand up against supply.
This will add an inflationary pressure on most markets and might be an uncontrolled pressure on the USD amongst many others,
BUY!

WHEAT, start planting now for a MASSIVE HARVEST...WHEAT: BOUNTIFUL HARVEST SOON... if you seed at the current price range.
KEY NOTES:
WEEKLY DESCENDING TRENDLINE BREAKOUT.
Monthly shifting price lines. HUGE HINT!
Weekly histogram higher lows.
MONTHLY HISTOGRAM SHIFT -- CLOSING UP TO BREAK SOON.
SEEDED LONG (long term) 628.0
TAYOR.
Safeguard capital always.
-----------------
RELATED NEWS:
WSJ ARTICLE:
Severe Drought Stunts Great Plains Wheat Crops
Harvest in nation’s breadbasket forecast to be the worst in 60-plus years
June 17, 2023 10:09 am ET

Is This the Beginning of a Global Food Crisis?Wheat, a cornerstone of global food security, is facing unprecedented challenges.
Rising temperatures, extreme weather events, and geopolitical tensions are converging to create a perfect storm for wheat production. The result? A significant wheat rally that could have far-reaching implications.
Climate Change's Impact:
As the planet warms, wheat-growing regions are becoming increasingly vulnerable. Extreme heat and unpredictable weather patterns are disrupting harvests and reducing yields. This is especially pronounced in Europe, where persistent rainfall and heatwaves have devastated crops.
Global Supply Chain Disruptions:
The war in Ukraine, coupled with export restrictions and transportation challenges, has further strained global wheat supplies. This has led to a surge in demand for wheat from other regions, exacerbating the price increase.
The Looming Food Security Threat:
The rising cost of wheat, a key ingredient in many staple foods, poses a significant threat to food security, particularly in developing countries. As prices continue to climb, access to affordable food becomes increasingly difficult for millions.
The Road Ahead:
The future of wheat production and global food security is uncertain. The world must adapt to the changing climate, invest in sustainable agricultural practices, and develop strategies to mitigate the risks posed by geopolitical tensions. The stakes are high, and the time for action is now.

Can We Unravel the Mysteries of Wheat Market Stability?In an era of interconnectedness and unprecedented challenges, the global wheat market stands as a critical linchpin of food security. Its intricate interplay of supply, demand, and geopolitical factors has profound implications for the world's ability to feed itself.
The wheat market, a cornerstone of global agriculture, is subject to numerous forces that can disrupt its equilibrium. Climate change, with its increasing frequency of extreme weather events, poses a significant threat to wheat production. Droughts, floods, and heatwaves can devastate crops, leading to shortages and price volatility. Additionally, the geopolitical landscape is fraught with tensions that can impact wheat trade. Conflicts, sanctions, and trade disputes can disrupt supply chains, limiting access to essential food commodities.
Moreover, the growing global population, coupled with changing dietary habits, is placing increasing pressure on wheat production. As incomes rise, consumers are demanding more diverse and protein-rich diets, which can drive up demand for wheat-based products. This increased demand, combined with the challenges posed by climate change and geopolitical instability, creates a perfect storm of uncertainty for the wheat market.
The future of wheat, and by extension, the global food system, hangs in the balance. Can we unravel the enigma of wheat market stability, or will the challenges posed by this vital commodity prove insurmountable? The answer to this question will determine the extent to which we can ensure food security for generations to come.

Grain Market and Bread Prices - Its Potential TrendIn today’s tutorial, we will track the potential prices of this important staple, wheat, which is used to make our bread. In these studies, we will use a combination of technical analysis and fundamental developments to support this view.
Chicago SRW Wheat Futures & Options
Ticker: ZW
Minimum fluctuation:
1/4 of one cent (0.0025) per bushel = $12.50
Disclaimer:
• What presented here is not a recommendation, please consult your licensed broker.
• Our mission is to create lateral thinking skills for every investor and trader, knowing when to take a calculated risk with market uncertainty and a bolder risk when opportunity arises.
CME Real-time Market Data help identify trading set-ups in real-time and express my market views. If you have futures in your trading portfolio, you can check out on CME Group data plans available that suit your trading needs www.tradingview.com

Momentum Trading In Agricultural CommoditiesMomentum trading, a strategy as old as the markets themselves, has found fertile ground in the sprawling fields of agricultural commodities.
As the seasons change, so do the prices of wheat, corn, soybeans, and other staples, tracing patterns as predictable as the migration of birds or the spring blossom.
This paper delves into these seasonal trends, uncovering how they can serve as reliable signals for astute investors looking to harness the power of momentum trading.
SEASONAL TRENDS IN AGRICULTURAL COMMODITIES
Mint Finance has previously highlighted some of these seasonal trends in Corn and Soybean in detail previously
In short, seasonal cycles in crop performance are linked to crop harvest cycles. Pre-harvest, inventory drawdowns tend to drive price higher while post-harvest, a glut of inventory tends to drive prices lower.
Corn
Corn prices start declining in June following the harvest in China (second largest corn producer) and Brazil (third largest corn producer). Prices reach their lowest in October, coinciding with the harvest in the US.
Over the past five years, corn prices have increased in the first half of the year before declining sharply in late June. In 2024, indexed price performance shows prices sharply lagging the seasonal trend as we approach the date on which prices generally declined the last five years.
Wheat
Wheat seasonality is less pronounced than other agri-commodities due to its relatively global distribution. Still, wheat prices generally rise during the first part of the year before declining in late June as all the major producers - China, Indian, EU, Russia, and US harvest crops during this period.
This year, wheat prices started the year off on a bearish note. After bottoming in early-March, prices started to rise sharply peaking in late-May. Mint Finance covered some of the factors behind this rally in a previous paper (Extreme Weather Sends Wheat Prices Surging). Prices have started to normalize in June, a few weeks before the seasonal price decline generally begins.
Soybean
Soybean prices generally rise during the first part of the year. In late-June, as the Brazil harvest reaches its peak, prices decline sharply. Prices remain subdued until September when the US crop is harvested.
This year, prices have sharply lagged their seasonal performance. Despite the rally in early-May driven by flooding in Brazil, prices remain lower than their level at the start of 2024. Moreover, the rally following the flood-driven rally has retraced a few weeks before the seasonal price decline generally takes place.
MOMENTUM TRADING IN AGRICULUTAL COMMODITIES
Investors can execute momentum trading strategies by leveraging these seasonal trends. In this context, momentum trading strategy refers to a relatively simple trading strategy where investors either buy or sell a futures contract at the start of the month based on the seasonal price performance during that month.
For instance, if seasonal trends show that June generally results in a price decline, the strategy would consist of going short on the commodity at the start of June and closing the position at the end of the month.
Although, at face value, this strategy may seem overly simplistic, its return and accuracy are surprisingly high.
The simulations are based on a position in the front-month futures, consisting of one contract of the agricultural commodity, opened at the beginning of the month and closed at the end.
Corn
For Corn, running the momentum trading strategy would have yielded average annual returns of USD 8,500 per year over the past five years (2019-2023). Crucially, performance of this strategy in 2024 is sharply lower as it would yield total PnL of just USD 63 this year.
Wheat
Similarly, for wheat, this strategy returned an average PnL of 4,650 per year during 2019-2023. So far in 2024, this strategy would have yielded USD 6,600 in wheat futures in 2024.
Soybean
In Soybean futures, momentum trading would have been the most successful over the past five years. This strategy would have yielded an average of USD 13,600 per year between 2019 and 2023. However, in 2024, this strategy would not have been successful as it would have resulted in a loss of USD 8,700 so far.
SUMMARY AND 2024 PERFORMANCE
It is clear that although this strategy is successful on a long timeframe, it is not necessarily profitable each month. For instance, the Soybean momentum trading strategy would have resulted in a loss in 2024 while Corn momentum trading strategy would have resulted in flat returns.
The reason behind this divergence from seasonal trend is clear when comparing the seasonal price performance charts at the start of the paper. Fundamental factors can result in broad-based trends throughout the year which can skew returns. For instance, as Soybean prices have been declining for most of 2024, a long position would have resulted in a loss regardless of seasonal trends.
As such, it is crucial to supplement this strategy using fundamental inputs on what the long-term price trend for the crop is. For a crop which is in a down-cycle, a long position would not make sense and vice versa.
In the near-term, all three crop’s prices tend to decline during July based on seasonal trends. However, the outlook for corn is most bearish. The latest WASDE report , suggested that USDA expects global corn production in marketing year 2024-2025 to reach 1,220.5 million metric tons compared to a forecast of 1,219.93 million MT last month. The increase in production comes from forecast for higher output from Ukraine and Zambia more than offsetting the decline in Russia.
Moreover, USDA forecasts a season average price of USD 4.4 per bushel which is lower than the current futures price of USD 4.57. Asset managers are also shifting their view on corn prices bearish once again as COT report showed asset managers increasing net short positioning last week.
Both fundamental and seasonal factors support a price decline in corn over the next month. However, seasonal trends are not exact. Particularly in 2024, seasonal trends have underperformed their usual returns from the last five years.
Investors can opt to use options instead of futures to express the same view of weakening prices. Options provide fixed downside risk and require only an upfront premium, avoiding the need to manage margins as futures prices fluctuate.
A long put position in CME corn options expiring on August 23 (ZCU24) can be used to gain downside exposure.
CME Corn puts are relatively cheaper compared to calls. Moreover, options IV (measured by the CVOL index) is lower compared to the peaks seen during the same time last year. An options position would benefit from both falling prices and rising IV.
Source: CVOL
A long put options position on corn futures presents fixed downside of USD 464 (USc 9.29 x 5000/100) and unlimited upside. A strike price of USc 430/bushel represents delta of -0.29. This position would break-even at USc 420/bushel.
MARKET DATA
CME Real-time Market Data helps identify trading set-ups and express market views better. If you have futures in your trading portfolio, you can check out on CME Group data plans available that suit your trading needs www.tradingview.com
DISCLAIMER
This case study is for educational purposes only and does not constitute investment recommendations or advice. Nor are they used to promote any specific products, or services.
Trading or investment ideas cited here are for illustration only, as an integral part of a case study to demonstrate the fundamental concepts in risk management or trading under the market scenarios being discussed. Please read the FULL DISCLAIMER the link to which is provided in our profile description.

Corn,Price actions didnt hold up last week..Hello fellow traders , my regular and new friends!
Welcome and thanks for dropping by my post.
Turning bearish on this one..wheat could be as well..it seems like trying to push lower with the toppish pattern that you are seeing on h4...
Do check out my recorded video (in trading ideas) for the week to have more explanation in place.
Do Like and Boost if you have learnt something and enjoyed the content, thank you!
-- Get the right tools and an experienced Guide, you WILL navigate your way out of this "Dangerous Jungle"! --
*********************************************************************
Disclaimers:
The analysis shared through this channel are purely for educational and entertainment purposes only. They are by no means professional advice for individual/s to enter trades for investment or trading purposes.
*********************************************************************

Corn and Wheat to look for long...why?Hello fellow traders , my regular and new friends!
Welcome and thanks for dropping by my post.
Why? will share my thoughts in my trading analysis this week.
Technical wise yes,part of it.
Do check it out ;)
Do check out my recorded video (in trading ideas) for the week to have more explanation in place.
Do Like and Boost if you have learnt something and enjoyed the content, thank you!
-- Get the right tools and an experienced Guide, you WILL navigate your way out of this "Dangerous Jungle"! --
*********************************************************************
Disclaimers:
The analysis shared through this channel are purely for educational and entertainment purposes only. They are by no means professional advice for individual/s to enter trades for investment or trading purposes.
*********************************************************************

WheatUSD Oanda Buying Breakout Trend ContinuesRealising my folly from my previous trade, I recognised my faults.
Recap -
1st - I traded with the Higher Time Frame and Entry Time Frame Trends, but I am actually entering on a opposing trend against the Lower Time Frame, and that is why the price never move in my intended direction after hours.
The opposing trend movement is also a sign that price is tanking, and that the Big Boys might not be into this product anymore.
2nd - Trade Breakout Trends was my thang. But I subconsciously/consciously shifted my setups to Trend Following which is to buy high and sell higher. Low winrate, needs to gather a ton of trades before the results show, stressful way to trade. I recognised my fault and now I shifted myself back to Breakout Trends.
I would like to add on also that, I would see this as a price game instead of a time frame game. But I also recognise that 50/60MA on the 15Minutes Time Frame is very powerful, and I called it Duck Hunting and I would be hunting ducks again, on the 15 Minutes Time Frame.
Would I trade on the 4H Time Frame or the Hourly? It's a price game so as long as the price is right, and it aligns with my point 1 and 2, I would.
2019SGT
22052024

Extreme Weather Sends Wheat Prices SurgingWheat plays a critical role in global agriculture and trade. Extreme weather has turned wheat prices bullish, rising more than 22% in a month after having languished for more than two years.
After reaching their lowest level in more than three years in March 2024, prices have rebounded strongly. Wheat rally is driven by extreme weather events in multiple places compounded by supply-demand imbalances.
Wheat rally is far from over. The May 2024 WASDE report painted a surprisingly positive outlook for wheat, suggesting an increase in US production. Outlook may be too optimistic, making revisions likely. Prices face risk to the upside once weather impact is comprehensively reassessed.
This paper posits a long position in wheat options benefiting not only from price appreciation and from expanding volatility.
WASDE PAINTS A POSITIVE WHEAT OUTLOOK
Recent WASDE report provides initial forecasts for 2024/25 marketing year (MY24/25) and updates projections for the current MY. These updates are crucial for estimating ending stocks which will be carried over to the next year.
Global production is expected to grow 1.3% in the upcoming MY to 798.19MT. Projections are even more optimistic for the US crop. USDA expects US wheat production in MY24/25 to be 3% higher YoY and total supplies to be almost 6% higher YoY.
Source: USDA
WHEAT CROPS ARE GETTING IMPACTED BY SEVERE WEATHER
Russia is the largest wheat exporter commanding 24% of total global exports. Russia has been hit by severe frost and cold.
Three of Russia’s key grain producing regions have declared a state of emergency, stating that May frost has caused severe damage to crops, reports Reuters . This year’s crop output will be lower. Frost linked damage follows record hot April which also harmed wheat crops.
The USDA has reduced its outlook for Russian wheat production by 3.5MT which might be an underestimate given widespread damage. WASDE report was released merely two days after Russia declared emergency, leaving USDA with little to no time to assess the impact.
STOCKS-TO-USE NEAR ALL-TIME-LOW
Data Source: PSD
Stocks to Use levels at major wheat exporters is currently at a 16-year low at 13.8%. It is expected to drop further to a record low of 12.4% in the upcoming MY24/25.
Low stocks-to-use ratio suggests that supplies are tight. Ending stocks are low relative to total consumption. Low stock-to-use ratios make prices extremely sensitive to minor shocks in physical markets.
MANAGED MONEY HAVE REVERSED COURSE ON WHEAT BEARISHNESS
Sentiment is shifting rapidly. Asset managers have been net short on wheat futures since 2022. This trend has reversed sharply over the last month with asset managers cutting short positioning by 70%. Net short positioning is at its lowest level since October 2022. Last week, asset managers continued to reduce their short positioning (down 35% over the past month) while also increasing their long positioning.
Source: CME QuikStrike
Bullish sentiment prevails with a put/call ratio of 0.57 in wheat options. Calls dominate both near-term and later contracts. Recent options market trading has been bullish for later expires.
Despite strong rally, implied volatility is lower than the levels seen last year and even during late 2022 signalling potential IV expansion.
Source: CME CVOL
HYPOTHETICAL TRADE SETUP
Wheat faces multifaceted upside risks stemming from weather-driven uncertainty and damage which may not have been factored into USDA’s supply outlook. Wheat supply also faces the risk of disruption from record low stocks-to-use ratio.
Wheat prices are up 22% over the last one month. A long futures position may be impacted negatively by a near-term correction. Instead, a long call position offers limited downside and substantial upside from expanding volatility and rising prices.
TradingView recently launched options suite brings traders a raft of options analytical tools. Wheat options chain can be visualised clearly.
Options IV across a range of expiries to identify key strike levels can also be visualised.
Strategy simulator enables evaluation of various strategies intuitively by visualizing the payoff based on not only price but also expansion or contraction of IV or time-decay.
The above hypothetical trade setup shows the payoff for a simple long call position in OZWU24 contract expiring on 23/August at a strike price of 750.
The premium for this option as of 17/May stood at 33 cents/bushel which results in a premium of USD 1,650 for a full options contract consisting of 5,000 bushels.
The above position breaks even at USc 783. If IV expands by 2%, the position would break even at USc 778.
Assuming constant IV, the:
• trade delivers profit of 1,850, if prices rise to 820.
• option expires worthless leading to a loss of 1,650 if prices remain below strike.
The options simulator features simple and intuitive interface enabling visualization of common options strategies. The tool also enables users to easily create and customize trading strategies.
Alternative to a long call, the bull call spread provides a pre-determined maximum profit and loss. The long call benefits from price rise and volatility expansion.
While short call offsets long call premium reducing potential losses. However, the profit potential is limited because any appreciation beyond the short call strike is negated by equivalent losses from the short position.
Bull Call Spread consists of a long call at a strike of USc 680 and a short call at a higher strike of USc 700. The width of the spread is set at 2 (700-680), a wider range can offer higher upside and reward/risk ratio, but it is only viable when the expected move is large.
MARKET DATA
CME Real-time Market Data helps identify trading set-ups and express market views better. If you have futures in your trading portfolio, you can check out on CME Group data plans available that suit your trading needs www.tradingview.com
DISCLAIMER
This case study is for educational purposes only and does not constitute investment recommendations or advice. Nor are they used to promote any specific products, or services.
Trading or investment ideas cited here are for illustration only, as an integral part of a case study to demonstrate the fundamental concepts in risk management or trading under the market scenarios being discussed. Please read the FULL DISCLAIMER the link to which is provided in our profile description.

Inflation & Agricultural Prices - On the Rise Again Inflation is expected to rise again because the prices of staples such as wheat, rice, corn, and soybean meal have been increasing over the last two months. Additionally, we've seen a 20% increase in soybean meal prices since the low in February.
Chicago SRW Wheat Futures & Options
Ticker: ZW
Minimum fluctuation:
1/4 of one cent (0.0025) per bushel = $12.50
Soybean Meal Futures & Options
Ticker: ZM
Minimum fluctuation:
0.10 per short ton = $10.00
Disclaimer:
• What presented here is not a recommendation, please consult your licensed broker.
• Our mission is to create lateral thinking skills for every investor and trader, knowing when to take a calculated risk with market uncertainty and a bolder risk when opportunity arises.
CME Real-time Market Data help identify trading set-ups in real-time and express my market views. If you have futures in your trading portfolio, you can check out on CME Group data plans available that suit your trading needs www.tradingview.com

Wheat: Bulls are Back! 🐂Wheat is once again showing its bullish side and is taking the first upward step out of the sideways movement of recent weeks. In the further course, the price should now continue the blue wave (c) and complete the superordinate wave A in turquoise. Following this, we expect a sell-off. Within the framework of our alternative scenario, however, it remains 37% likely that the price will once again fall below the support level at USX 495.25 in order to make a lower low of wave Alt. (b).

Wheat Holding at the PCZ of a Bullish Bat Aligning with SupportWheat 2 years after topping out at the PCZ of a Bearish Shark that initiated a downtrend in 2022, has now come back to the top side of the range wheat traded in between the years of 2016 and 2020 before ultimately confirming the bottom at the PCZ of a Bullish Deep Gartley in 2019 and breaking free to the upside of the trading range in late 2020.
Now that wheat has found its way back down here at this previous resistance zone, we can see that it has formed a Bullish Bat structure on the way down which aligns with the old resistance and that it is currently attempting to be supported by the 200-period moving average on the 2-week timeframe. We can likely assume that as the Baltic Dry Index continues higher, wheat will regain it's 2021 highs along with many other agricultural goods and that this will have an inflationary effect overall.
In the related ideas section I will leave a setup for BDRY which is the ETF that tracks the Baltic Dry Index and I will also leave the DBA which is an ETF that holds the futures contracts for various different agricultural goods such as corn, wheat, sugar, and more related items. I will also leave setups for two Dry Bulk and Containership Charterers.
Lastly I will provide my harmonic Inflation Rate projections.

Can wheat break above previous trendline support?Wheat
Technicals (May)
Wheat futures shot higher overnight but got stonewalled by what was previously trendline support (now resistance). A failure to close out above 550-555 keeps the Bear camp in control with a potential retest of the lows still in play. Further escalation in the Middle East could turn the tide back to Bullish.
Bias: Neutral/Bearish
Resistance: 573 1/2-575***, 595 3/4-600***, 608 1/2-611**
Pivot: 550-555
Support: 537-540***, 525**
Fund Positioning
Friday's Commitment of Traders report showed Funds were net buyers of about 5.4k contracts. That trims their net short position to 86,568 contracts.
Seasonal Trends
(Past performance is not necessarily indicative of future results)
Below is a look at price averages for July wheat, using the 5, 10, 15, 20, and 30 year averages. Historically this isn't the most friendly time of year.
Check out CME Group real-time data plans available on TradingView here: www.tradingview.com
Disclaimers:
CME Real-time Market Data help identify trading set-ups and express my market views. If you have futures in your trading portfolio, you can check out on CME Group data plans available that suit your trading needs www.tradingview.com
*Trade ideas cited above are for illustration only, as an integral part of a case study to demonstrate the fundamental concepts in risk management under the market scenarios being discussed. They shall not be construed as investment recommendations or advice. Nor are they used to promote any specific products, or services.
Futures trading involves substantial risk of loss and may not be suitable for all investors. Trading advice is based on information taken from trade and statistical services and other sources Blue Line Futures, LLC believes are reliable. We do not guarantee that such information is accurate or complete and it should not be relied upon as such. Trading advice reflects our good faith judgment at a specific time and is subject to change without notice. There is no guarantee that the advice we give will result in profitable trades. All trading decisions will be made by the account holder. Past performance is not necessarily indicative of future results.

Wheat Breaks Below SupportWheat
Technicals (May)
May wheat futures broke lower yesterday, after struggling to maintian price action above trendline support in the previous two sessions. This has the Bear camp back in the driver’s seat as we officially enter the back half of the week. A close back above 550-555 would neutralize the recent bearish action.
Bias: Neutral/Bearish
Resistance: 573 1/2-575, 595 3/4-600, 608 1/2-611**
Pivot: 550-555
Support: 537-540*, 525
Fund Positioning
Friday’s Commitment of Traders report showed Funds were net buyers of about 5.4k contracts. That trims their net short position to 86,568 contracts.
Seasonal Trends
(Past performance is not necessarily indicative of future results)
Below is a look at price averages for July wheat, using the 5, 10, 15, 20, and 30 year averages. Historically this isn’t the most friendly time of year.
Check out CME Group real-time data plans available on TradingView here: www.tradingview.com
Disclaimers:
CME Real-time Market Data help identify trading set-ups and express my market views. If you have futures in your trading portfolio, you can check out on CME Group data plans available that suit your trading needs www.tradingview.com
*Trade ideas cited above are for illustration only, as an integral part of a case study to demonstrate the fundamental concepts in risk management under the market scenarios being discussed. They shall not be construed as investment recommendations or advice. Nor are they used to promote any specific products, or services.
Futures trading involves substantial risk of loss and may not be suitable for all investors. Trading advice is based on information taken from trade and statistical services and other sources Blue Line Futures, LLC believes are reliable. We do not guarantee that such information is accurate or complete and it should not be relied upon as such. Trading advice reflects our good faith judgment at a specific time and is subject to change without notice. There is no guarantee that the advice we give will result in profitable trades. All trading decisions will be made by the account holder. Past performance is not necessarily indicative of future results.

Wheat Futures Riding a Fine LineWheat
Technicals (May)
May wheat futures traded in a wide range yesterday, on both sides of unchanged. This morning, prices are attempting to firm as the market revisits our pivot pocket from 550-555. The Bulls will want to see consecutive closes back above this pocket to spur a move back towards the recent highs. A failure to do so could put the Bears in the driver's seat.
Bias: Neutral
Resistance: 573 1/2-575***, 595 3/4-600***, 608 1/2-611**
Pivot: 550-555
Support: 537-540***, 525**
Fund Positioning
Friday's Commitment of Traders report showed Funds were net buyers of about 5.4k contracts. That trims their net short position to 86,568 contracts.
Seasonal Trends
(Past performance is not necessarily indicative of future results)
Below is a look at price averages for July wheat, using the 5, 10, 15, 20, and 30 year averages. Historically this isn't the most friendly time of year.
Check out CME Group real-time data plans available on TradingView here: www.tradingview.com
Disclaimers:
CME Real-time Market Data help identify trading set-ups and express my market views. If you have futures in your trading portfolio, you can check out on CME Group data plans available that suit your trading needs www.tradingview.com
*Trade ideas cited above are for illustration only, as an integral part of a case study to demonstrate the fundamental concepts in risk management under the market scenarios being discussed. They shall not be construed as investment recommendations or advice. Nor are they used to promote any specific products, or services.
Futures trading involves substantial risk of loss and may not be suitable for all investors. Trading advice is based on information taken from trade and statistical services and other sources Blue Line Futures, LLC believes are reliable. We do not guarantee that such information is accurate or complete and it should not be relied upon as such. Trading advice reflects our good faith judgment at a specific time and is subject to change without notice. There is no guarantee that the advice we give will result in profitable trades. All trading decisions will be made by the account holder. Past performance is not necessarily indicative of future results.

wheat in strong downtrendwheat is ready to go... excellent RR here... not only 3.5 to first target, but ocasion to build position towards much lower... moving stops to Be or trail
*not financial advise

Wheat Futures IdeaI will monitor price action on this floor and have set alerts for entry.
Wheat futures need a correction to the upside.
Let me know your thoughts.
The Professor

WHEAT Bearish pressure under the 1D MA50 and MA200.Wheat (ZW1!) has been trading within a long-term Channel Down pattenr since July 2022. The price is currently on a bearish sequence below both the 1D MA200 (orange trend-line) and 1D MA50 (blue trend-line). It appears that technically this is a Bearish Leg following the December 06 2023 Lower High rejection, similar to the one that started on the October 10 2022 Lower High.
That sequence reached the Channel Down bottom on the 1.786 Fibonacci extension. As a result, our long-term Target is 455'7.
-------------------------------------------------------------------------------
** Please LIKE 👍, FOLLOW ✅, SHARE 🙌 and COMMENT ✍ if you enjoy this idea! Also share your ideas and charts in the comments section below! This is best way to keep it relevant, support us, keep the content here free and allow the idea to reach as many people as possible. **
-------------------------------------------------------------------------------
💸💸💸💸💸💸
👇 👇 👇 👇 👇 👇

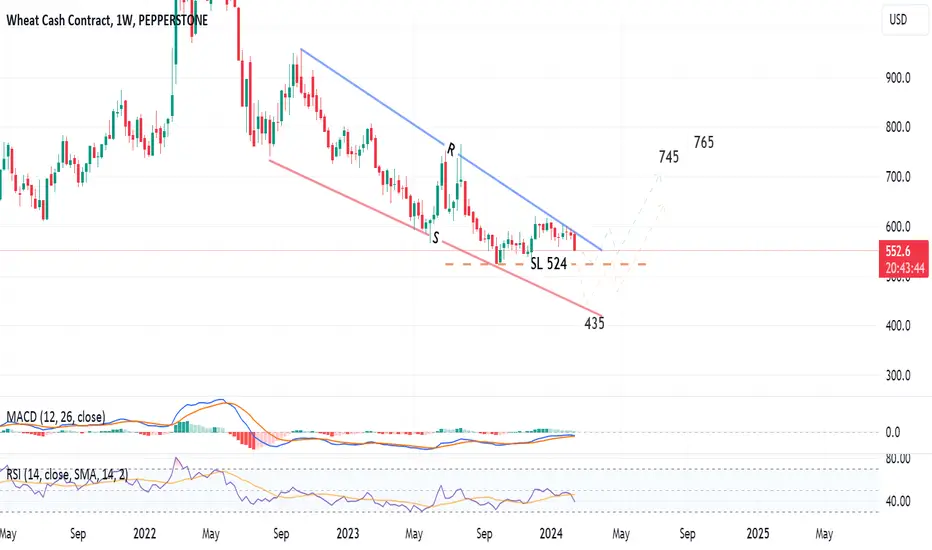
Wheat is trading in a falling wedge!Weekly chart, wheat cash contract is trading in a falling wedge!
Will we see the 435 - 400 price level or rebound upwards from 520 - 525?
It is tough to confirm.. However, this falling wedge pattern has a higher probability that the price will cross the resistance (line R) upwards towards 745 and 765 in the long term.
EU faces pressure to defuse mounting anger as farmers protest aGiven the mounting anger and protests by farmers across Europe, there appears to be a significant challenge stemming from contradictory and potentially detrimental agricultural policies. The grievances include increased costs for agricultural diesel, additional fees for water consumption, complex regulations, and objections to bans on pesticides and herbicides mandated by the EU's Green Deal. The farmers are also concerned about the import of beef from countries like Brazil and Argentina, which they argue have laxer rules on animal welfare, making competition difficult.
This unrest, originating in France but spreading to neighboring countries, signals a broader issue with unpredictable government decisions affecting agriculture. In the Netherlands and Germany, similar protests have arisen over regulations to cut nitrogen emissions and phase out fuel subsidies, respectively. In Germany, there is also resentment over what is perceived as the unfair application of environmental policies.
With protests extending to Poland, Romania, Slovakia, Hungary, and Bulgaria, concerns range from unfair competition from cut-price cereals to high taxes and tight regulations. The impact of droughts, floods, and wildfires, combined with the squeeze from green policies, has fueled discontent.
For investors, this could be a pivotal moment to consider commodities such as cereals, soybeans, and copper. The disruptions in European agriculture may create fluctuations in the market, making these commodities potentially attractive for investment. However, it is crucial to monitor developments closely as tensions continue to grow, and the agricultural sector shapes up to be a major issue in the upcoming European Parliament elections in June.

Will the Wheat futures (CBOT) form a Bullish pattern?Wheat futures (CBOT) is rebounding from the support level, and it seam a bullish pattern is being formed - Cup and Handle!
After complete formation of chart pattern, the target will be 760 US cent/bushel (23.4% increase from current level)
Indicator RSI is positive
