WHEATUSD


Inverted head and shouldersAs you see we have invertet head and shoulders, with the begining of right arm. Also we have long position on MACD on daily chart.


Uptrend in wheat with clear targetBit of a longer term idea. We see a clear support line, heading up. Forms a decent basis for wheat prices. It shows a few high's over the last years, which form a clear target.
Take length with your own preferred SL/TP.
Trading is not about copying but about forming your own opinion.

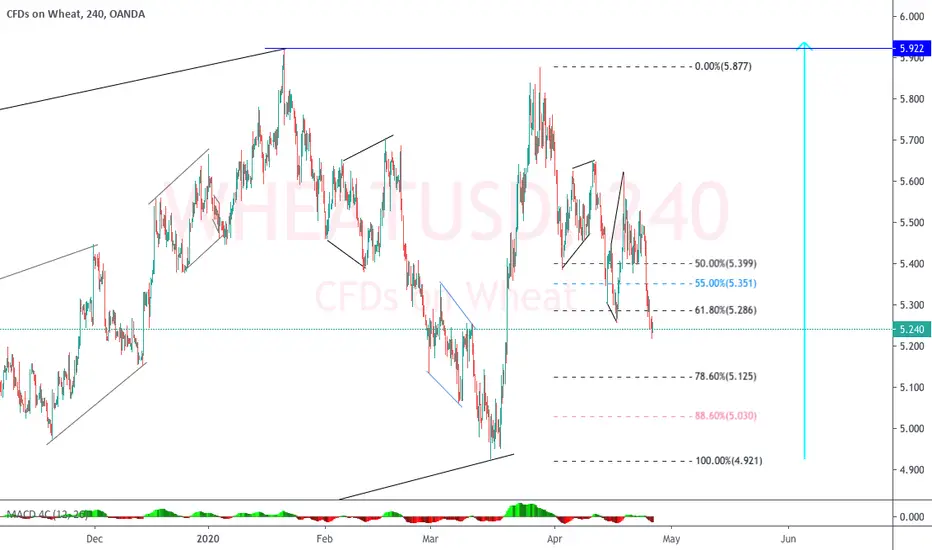
WHEATUSDwheat is coming back down to an area of value clean structure and clean price action is forming on this the area in mind as shown with this breakdown on the charts!

Wheat Daily and 4 hour Setup PlayThe idea can be triggered here on the 4 hour, but first let us take a look at the daily chart.
We are at an important resistance zone on the daily chart. At around the 5.82 zone. What has caught my attention is the many indecision candles we have here. The two doji candles, candles with large wicks on either side. What this shows us is that there is a battle between the bears and the bulls at this resistance zone. We should definitely be paying attention to price here.
Moving down to the 4 hour chart, and we can see there are more confluences pointing to a possible downside move, and indeed, presents us with a trigger set up. Just looking at market structure here, it shows us an uptrend with higher lows and higher highs. We have had more than two swings which is what we want to look for.
At this resistance zone, we began to range. Look at the wicks here. The fake out candles. Price began to break out but reversed and closed below the previous open highs. This is why we remain patient and await candle closes before taking trades. This fake out trapped many traders to the upside.
We can also say that not only do we have a range here, but in fact, one can make an argument that there is a double top/ triple top at this level. Another good pattern we look for potential trend exhaustion. Putting those two together, the topping pattern and at a resistance level, already give us a good possibility of a downward move.
What we are now awaiting is for a break below this flip zone here (area that has been both support and resistance) at 5.620. Going back and looking to the left, you can see the importance of this zone with multiple touches. We have had a bounce at this zone but I am looking for a reversal and then a break below the flip zone. This would create our first lower high swing that we can work with in a new down trend. Price does seem ready to roll over.
On the fundamental side, there are stories now about supply chains being disrupted due to the virus. Hearing about rice farming and other crop farming being halted in parts of Asia. Stories like this are out of our hands, but can go against this trade idea. We shall await the developments and see if we get the break.


Wheat / Trendline RetestIt"s not just grocery shoppers who are hoarding pantry staples.
Some governments are moving to secure domestic food supplies during the
corona virus pandemic . (Bloomberg)
Disclaimer:
We are not registered or licensed in any jurisdiction whatsoever to provide investing advice or anything of an advisory or consultancy nature,
and are therefore are unqualified to give investment recommendations.
Always do your own research and consult with a licensed investment professional before investing.
This communication is never to be used as the basis of making investment decisions, and it is for entertainment purposes only.

Wheat Reversal Pattern FormingA simple idea. Wheat is showing a head and shoulders reversal pattern. On the daily, we did break out but that has not been sustained.
We can see fake out patterns on both the daily chart and the 4 hour chart.
Here on the 4 hour, we are awaiting a break of the neckline. This would also confirm our first lower high swing (the right shoulder of the pattern).
First target would be the flip/demand zone in blue.
For now, we await the break.

Long Term Prospects for WHEATUSDThe WHEATUSD, symbol ZW, is in a rally within a Bear Market with price trading above the 50 week ema and the 200 ema, but below the 800 week ema. The the long term emas are mostly flat, signaling accumulation / distribution. The price action appears to be finishing up the e-wave of a b-wave which should resolve in a c-wave down into late Spring. There is a definite Seasonal aspect to this market with strong rallies that occur around June time frame.
The Market is in a Bull Market on the daily, with price above the 50 ema, which is above the 200 and 800 emas. The 50 ema is in a strong uptrend along with the long term emas.. Price is topping out in the c-wave of a a-b-c rally and looks like it is putting in a M-Top. Price can be considered to be in an uptrend as long as it is above 549’2.
The Market is in a Bull Market on the 4 hour, with price trading back above the 50 ema, which is above the 200 ema, and above the 800 ema. Price is now technically correcting, having pulled back to the 30 ema, which is a warning. This market is out of E-waves. Probably trade up in the back end of the coming week to finish out an M-Top formation, before starting a greater down-trend.
This is my WHEATUSD look ahead for my own trading purposes. FUTURES trading involves risk. Feel free to comment, but trade off of this post at your own peril.


Wheat to rally to 600?Wheat found a bottom and has been trending up, If it could get past the report on monday or better yet rally on it, we could safely call a significant bottom in place. If you're not long from lower, it's probably better to stay on the sidelines until after Monday's report

Wheat analysisWheat prices remain high, despite the supply of relatively good data on the market
High quality spring wheat - higher than winter crop
The quality of spring wheat has been the highest in the United States since 2010, and it may still grow
In some EU countries, rainfall increases the quality of European wheat
Despite the relatively dry weather, the quality of wheat in France is 79%.
In the United States, spring wheat quality has been rated at 83% - the highest level after many years - (Bloomberg)
The price of wheat after the publication of the above mentioned quality data tends to decrease. The next WASDE report is expected next week.

WHEAT vs usd , Long Term perspective on the triangle : Up TrenDWHEAT vs usd , Long Term perspective on the triangle : Up TrenD


WHEAT BOTTOM IS INThere's a reason it bounced 5%+ off the lows today. Running flat correction completed. Look for a flag on hourly timeframe to buy the breakout of. Keep leverage down and think long-term.

WHEAT SELL (WHEAT – US DOLLAR)Hi there. Price is forming a continuation pattern to the downside. Wait for the price to hit the top of the pattern and watch strong price action for sell.

WHEAT SELLHi there. Price is forming a continuation pattern to the downside. Wait for the price to hit the top of the pattern and watch strong price action for sell.
Don’t take a trade if you don’t see clearly when big guys are in.
