White

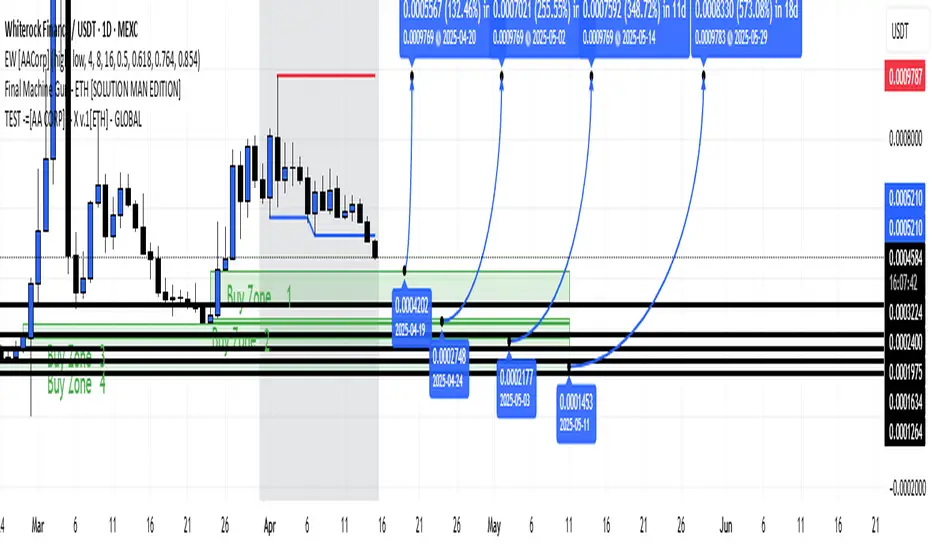
WHITE ROCK's Entry - Buy zone'sThis forecast chart for Ethereum (ETH) against Bitcoin (BTC) on a 4-hour timeframe (EW ) projects potential price movements through 2025. The chart highlights four key "Buy Zones" for ETH/BTC, identified between 0.0001274 and 0.0004022, with specific entry points dated from 2025-04-19 to 2025-11-14. The price is expected to consolidate within these zones before a breakout, targeting a global high of 0.0009797 around 2025-05-29. The forecast also marks a significant resistance at 0.0005210, labeled as the "Final Machine Gun," which aligns with historical highs. The chart suggests a strong bullish trend for ETH/BTC, with a potential 573.8% increase from the lowest buy zone to the peak, spanning an 18-month period. However, the "SOLUTION MAN ENTITY" label and test notation indicate this is a hypothetical or algorithmic projection, not a guaranteed outcome.
Entry: Long at $1,675 (current price on 1m).
Target: $1,839 (FVG and resistance, +9.8% move).
Stop-Loss: $1,650 (below the order block, -1.5% move).
WBT / USDTWBT / USDT
WBT show perfect descending triangle :
– The trigger for bulls is breaking out the resistance line of triangle in my chart
– Trigger for bears is breaking down green support line in my chart
Best of wishes


Bullish One White Soldier ConfirmedWIth OGI closing 4.17 in its previous session, the white candlestick opened above the previous day's close and closed above its open. Similar to a Bullish Harami pattern but with the second day closing higher, which stops the engulfing of the white body by the preceding red body. Short term traders will wait for a daily pullback to buy into strength with higher lows confirmed. More aggressive traders might want to look at other patterns to determine whether a large swing trade picking up the lows might be appropriate.

MNST printing 3 white soldiersNASDAQ:MNST is showing 3 white soldiers. Bouncing up from recent support line.
Can get long here, potential to go 66.49

Bullish Marubozu CandlestickThis is called a Bullish "Marubozu" Candlestick. This candle is considered a weak indicator. Depending on what comes after this candle , this could be a bullish continuation or bearish reversal. This candle usually have no wicks on either end. The color of this candle is either Green or White. Check your charts and search for them everywhere and see what comes after this type of candle.

WhiteCoin Range TradingRecently WhiteCoin has found the bottom at $0.075, where it has rejected 161.8% Fibonacci retracement applied to the corrective wave up after the $0.1 support breakout. Since then price went up and formed the resistance at $0.091, that is 38.2% Fibonacci retracement level.
Overall, XWC/USD stuck between the support and resistance, which mean that range trading is in progress. The consolidation is likely to continue and only break and close above the $0.1 resistance or below the $0.075 support could establish further direction.
Break below the support could push price down towards next support at 261.8% Fibs, that is $0.065, while break above the psychological resistance at $0.1 could be the confirmation of the trend reversal and potentially result in a strong growth.

Long Term View This is my basic view how I look at the market.
I see there basic trends and trading ranges.
I also apply Fibonacci Retracement.
I have to look at minutes timeframes to say up or down.

XBCBTC 4H Three white soldiers very bullishI was just checking the charts today and found this very powerful pattern which is driving the financial market since ancient time. Three white soldiers’ formation. Based on my calculations I can found out in very precise manner take profit area. It is hard to say the exact time when it will happen but it is almost certain that this level will be reached. We can observe on the daily chart very big caffeine candle which created nice support area close to the 50% of the body of the candle(shadows aren't consider) which is marked with black line. In my opinion this pair has big chance to go as high as 0.240000.
I will post next part of the chart in next idea.
