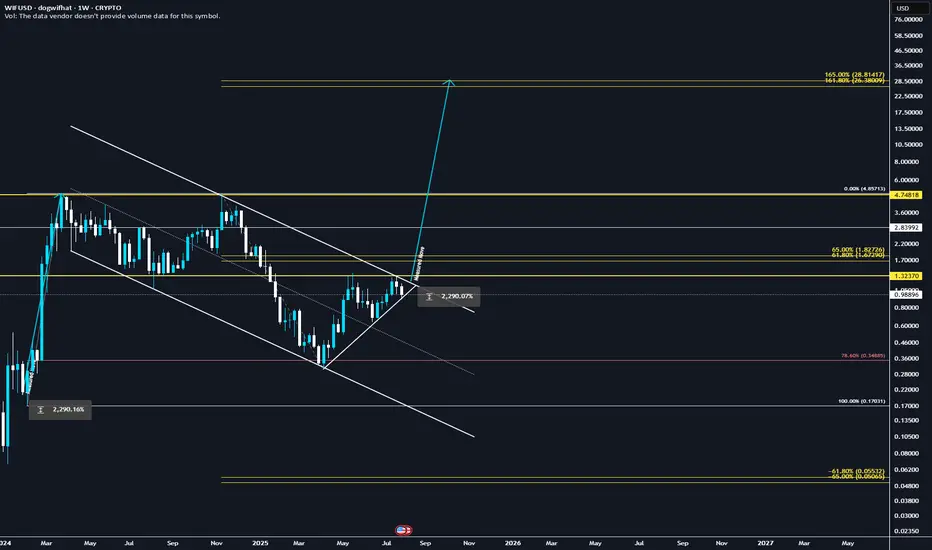
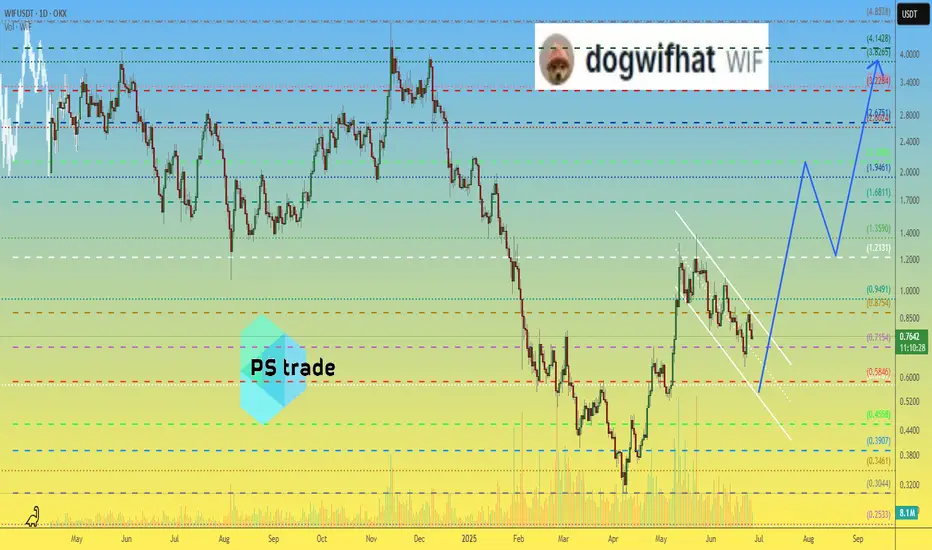
They're lying! WIF will explode to 28.8$ ✅ Golden Pocket Extension: $28.80 aligns with the 1.618–1.65 fib extension (golden pocket zone) from the last major impulse.
✅ Measured Move: Breakout from the prior downward consolidation projects to ~$28.80 when using the height of the range added to the breakout point.
✅ Confluence = High Probability: Both fib extension and measured move target the same zone, increasing confidence.
✅ Momentum + Meme Rotation: If broader meme coin rotation continues, WIF has narrative + volatility fuel.
Wif
Dogwifhat Poised For 22% Growth Toward $1.50Hello✌
Let’s analyze Dogwifhat’s upcoming price potential 📈.
📈 BINANCE:WIFUSDT is currently sitting near a strong daily support and trendline. At the same time, the Fibonacci Level support lines up closely with this key level. This convergence suggests a potential upside of about 22%, aiming for a target price of $1.50. 🔥
✨We put love into every post!
Your support inspires us 💛 Drop a comment we’d love to hear from you! Thanks , Mad Whale

Memecoin with potential for purchase.Hello friends🙌
Considering the decline we had in the weekly timeframe, you can now see that with the good growth we had, it gives us a good signal to buy, of course in a stepwise manner and with capital and risk management.
🔥Follow us for more signals🔥
*Trade safely with us*

Bullish Cup & Handle Pattern Formed 🚨 SEED_WANDERIN_JIMZIP900:WIF Testing Red Resistance – Bullish Cup & Handle Pattern Formed 📈
SEED_WANDERIN_JIMZIP900:WIF is currently testing the red resistance zone and has formed a bullish cup and handle pattern on the chart.
If a breakout occurs, potential upside toward:
✅ First Target: Green line level
✅ Second Target: Green line level
Wait for breakout confirmation before entering long. 📊
Patience is key—watch this closely! 💼💸
WIFUSDT: Mid-Term AnalysisI know the prices I want are very cheap.
But I believe this market can give me those prices if I’m patient.
Until then, I’m watching calmly. If price comes to my levels, I will look for:
✅ Footprint absorption
✅ CDV support
✅ Structure reclaim for confirmation
If it aligns, I’ll take the trade with clear risk. If not, I’ll keep waiting.
No rush. The right price, or no trade.
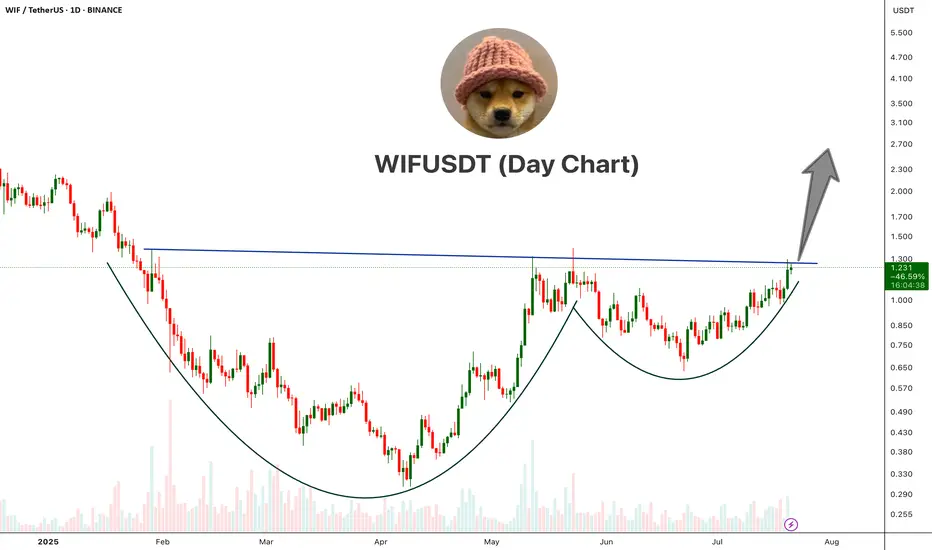
WIFUSDT Cup And Handle PatternWIF is showing a classic Cup and Handle pattern on the daily chart, a strong bullish reversal setup.
The price has broken above the neckline resistance around the $1.25–$1.30 area with bullish momentum. This breakout, if sustained with volume confirmation, could open the doors for a major upside move.
Cheers
Hexa
BINANCE:WIFUSDT
$WIF just gearing for a new ATH! Not expecting much of a retrace on BINANCE:WIFUSDT — more likely we get consolidation against resistance.
This current level is crucial, and likely to form the base for either:
• A new ATH, or
• At minimum, a third retest of the $4.5–5 zone.
The broader market continues to push higher, and with Bitcoin Dominance breaking down, things could get very interesting in the coming months.
📌 Plan:
• Waiting on a clean retrace (as per second entry... previous post)
• Or a reclaim of the purple block to add to the position

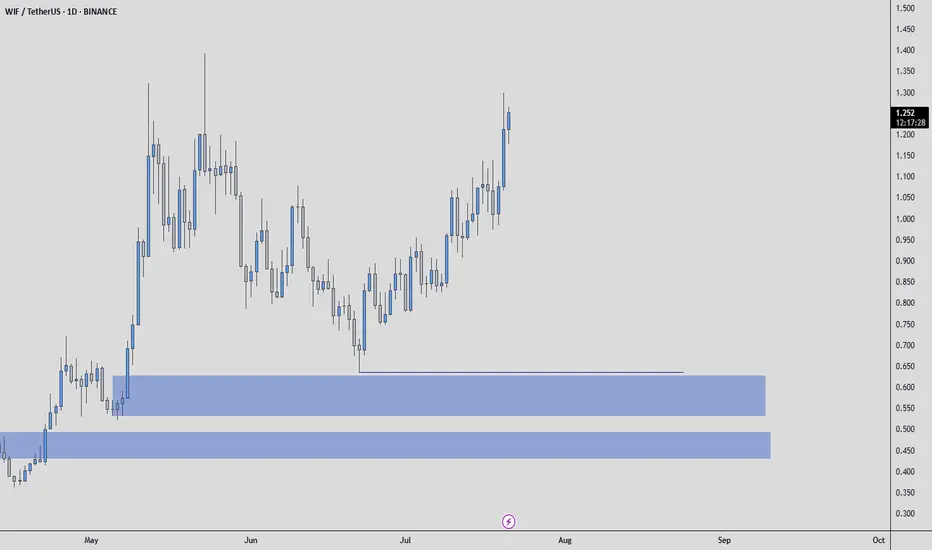
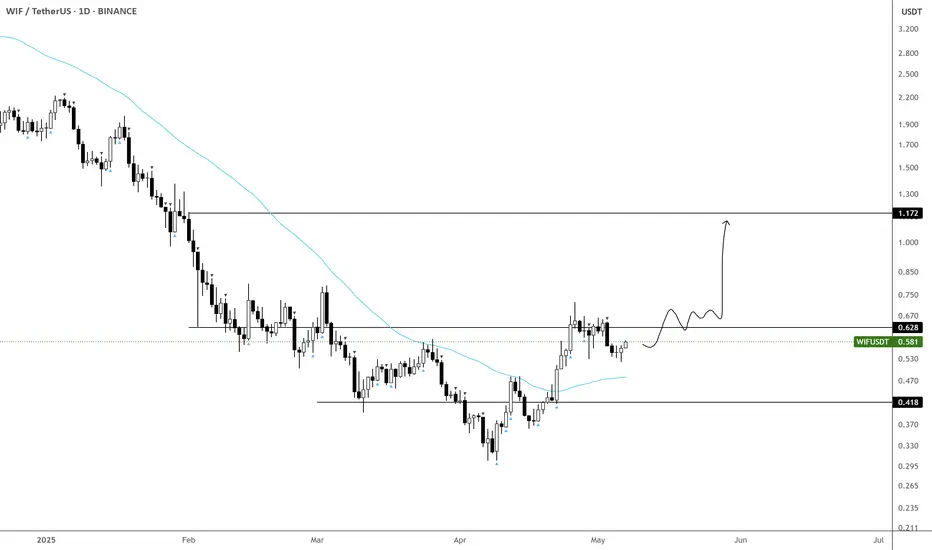
Time to Accumulate $WIF - $1.2 is NextWIF finally showing signs of life.
Starting to build a position below 60c—this looks like an optimal entry given how well it's behaving.
Accumulation zone remains between 40–50c, as long as price holds there.
Targeting the 1.2 area on a break and hold above 65c.
BINANCE:WIFUSDT SEED_WANDERIN_JIMZIP900:WIF
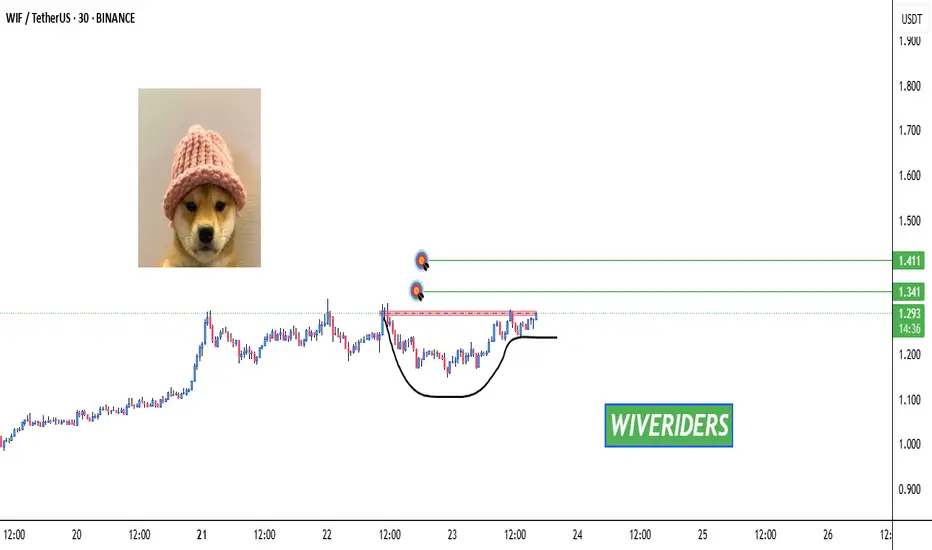
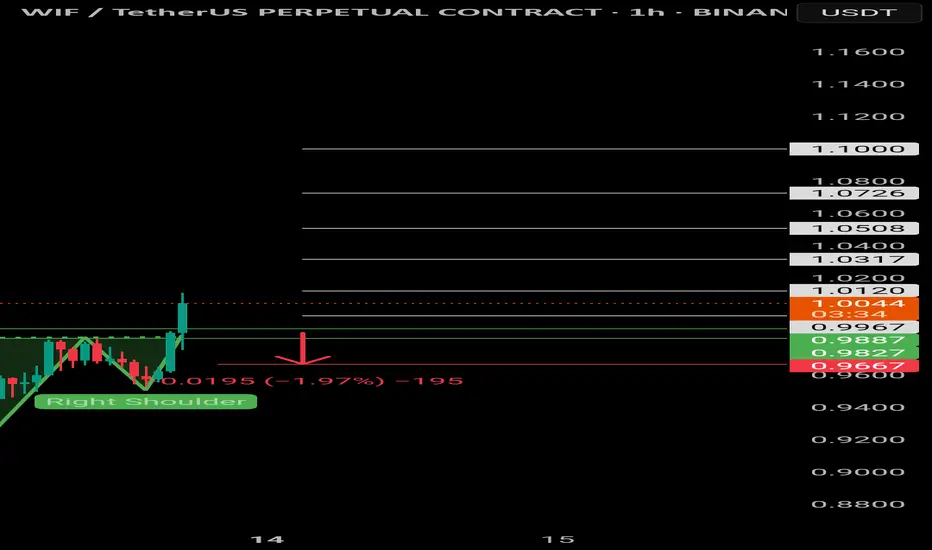
$WIF | Inverted head and shoulders $Wif/Usdt
BINANCE:WIFUSDT.P
The price is formed the Inverted head and shoulders pattern and did a breakout of the neckline, expecting the price to retest green lines (neckline).
If 1H CC hit and bounce above the green lines, it'll be a long opportunity.
Entering at current price will increase the SL, it's suggested to wait for a retest, to have better entry and a good risk management.
Use only 1-2% of your portfolio.
NFA, DYOR
TP:
Price explosion is coming?Read carefullyhello friends👋
We have come to analyze a popular Kuwaiti meme that you have asked to analyze a lot.
🌟Well, according to the drop we had, it can be seen that the buyers came in and formed a good upward wave, and after that, Femt entered a channel, which can be said to be a flag pattern...🧐
Now, according to the formed channel, we can enter into a purchase transaction with capital and risk management in case of a valid failure of the channel.
🔥Follow us for more signals on Bolran.🔥
*Trade safely with us*

WIF - One COIN TWO MOVES!SO the moves are for you to be seen, I am as usual saying half things so you come to me and ask whats it hahahha
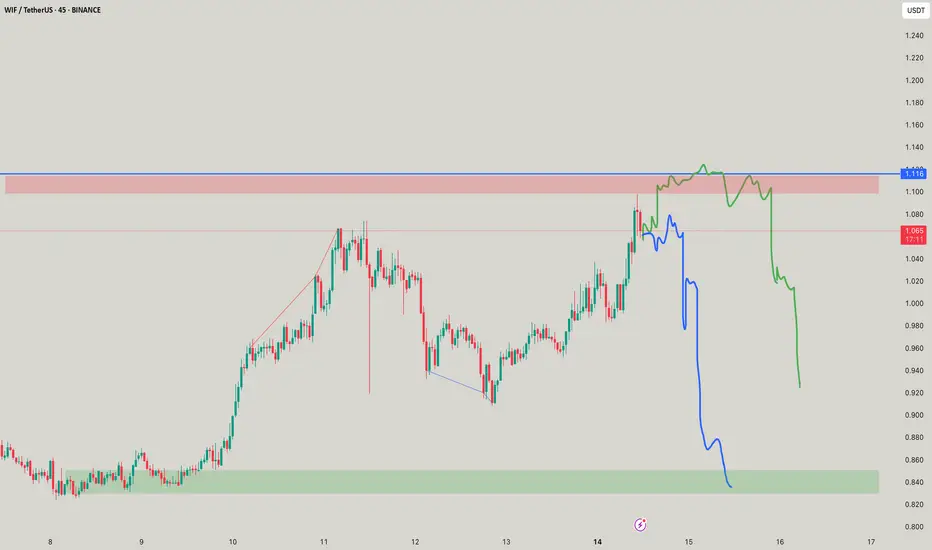
MEW MEW - WIF is here!So yet again a very probable trade to the mark and you see something is better than nothing! The moves as said and marked!


When the bark is louder than the bid - WIFWIF looks problematic, fall is there, but it would take shorters with them! so wait for that time!

WIFUSD - dogwifhat Crypto Analysis$WIF.X $1.18 PT over the course of the next month if we can break that higher level of resistance. Entry at $0.93 with a $0.85 Stop Loss on the 3:1 RRR. IF we hold that long at least... Will position a shorter stop to be conservative so If we lose momentum, we would look for re-entry at the smaller compression zone which also rest at the $0.85 Price Levels. #WIF #MyMIWallet #TradeAnalysis

WIF will now say Uff!WIF and FART had same patterns but just have got out of the phase on conjunction, little steep moves to the tops then it starts to mend down, observe for momentum and then take a play

WIF back to $3Complete look at Dog WIF Hat
We had some pretty nice technical setups on this meme.
#HVF
#DoubleTop
#InverseHeadandShoulders
#BullFlag
Currently it has two active patterns ...

WIF - MAKE or BReak?Okay make or break area, most likely make, looks promising for another move unless bTC slips out of hand

WIF/USDT – Major Breakout Incoming! Potential Upside Over +400%!Technical Analysis:
The WIF/USDT (dogwifhat / Tether) pair on the 1D timeframe is currently showing signs of a bullish breakout from a well-defined descending channel that has formed over the past few months.
📌 Key Highlights:
Price has been consolidating within a descending channel since March 2025.
It is now attempting to break out above the upper boundary of the channel – a strong bullish signal.
The breakout is forming after a strong bounce from the $0.70–$0.75 support zone, indicating accumulation and potential trend reversal.
📈 Resistance Levels (Target Zones):
1. $1.0251 – first key resistance to watch.
2. $1.2008 – minor resistance, ideal short-term target post-breakout.
3. $1.8468 – major historical resistance level.
4. $2.1772 – key psychological and technical level.
5. $2.9503 – extended bullish target.
6. $4.1525 – maximum bullish projection in case of parabolic move.
📉 Support Levels:
$0.8627 – current price level.
$0.70–$0.75 – previous strong support zone and lower channel base.
📊 Strategy Insight:
A potential entry could be considered on a confirmed breakout and retest around $1.02.
Targets can be scaled based on resistance levels mentioned above.
Use proper risk management and stop-loss below the channel to avoid fakeouts.
Conclusion:
WIF/USDT is showing a strong bullish reversal structure, breaking out from a mid-term descending pattern. This could be the beginning of a massive upward impulse, with over +400% potential gain if key targets are reached. A critical moment for traders and investors to pay attention!
#WIFUSDT #WIFBreakout #CryptoAnalysis #AltcoinSeason #Dogwifhat #BullishSetup #BreakoutAlert #CryptoTrading #CryptoSignals #WIFArmy

dogwifhat WIF price analysis🤪 "They" are trying to breathe "new life" into #WIF . And if they manage to keep the price of OKX:WIFUSDT above $0.55, this plan will have a chance of success.
So what do we have:
◆ #WIF holders need to keep their fingers crossed that everything will work out and there will soon be growth, and with it a chance to get out of a prolonged "draw fall"
◆ Traders need to wait for confirmation that the price of #WIFUSD is holding steady above $0,55.
And no large trading leverage, because this is a fairly volatile meme coin, even x5 leverage, which allows for a -19% error, or x3, which forgives a “miss” of -32% from the entry point, can liquidate your deposit when trading volatile assets.
⁉️ Do you believe that the price of #dogwifhat can still return to the $4 range with a corresponding project capitalization of $4 billion?
_____________________
Did you like our analysis? Leave a comment, like, and follow to get more
WIF WIF - He is back!WIF looks good for a straight move and mostly due to hype of liq hunting hahhahahaa

WIF - NEw Day New WifsAs suggested if a certain liquidity surge comes then we can plan for longs, but looks like 15MIns PoC will be magnet for that to 0.768

WIF WIF! _ Its done!So as said and mentioned about WIF in my previous chart, smooth moves as usual!!
