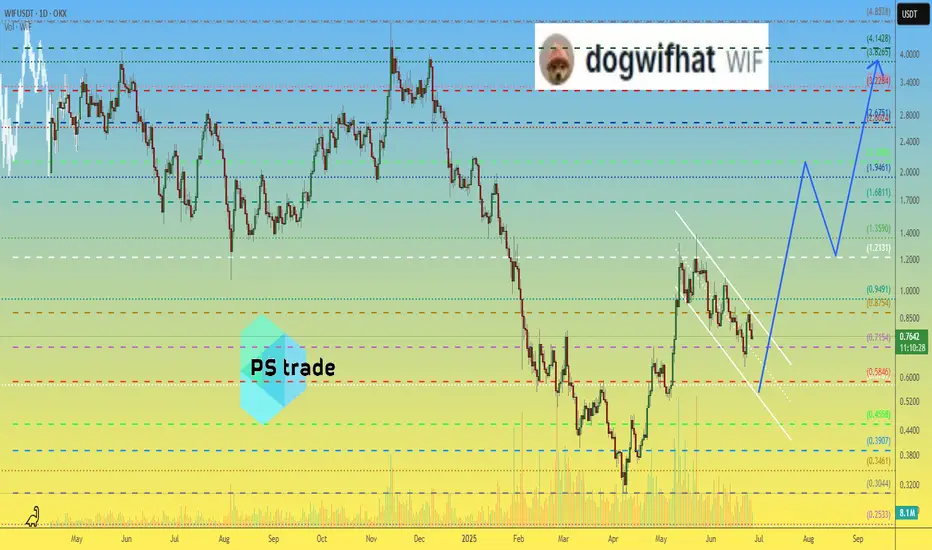
dogwifhat WIF price analysis🤪 "They" are trying to breathe "new life" into #WIF . And if they manage to keep the price of OKX:WIFUSDT above $0.55, this plan will have a chance of success.
So what do we have:
◆ #WIF holders need to keep their fingers crossed that everything will work out and there will soon be growth, and with it a chance to get out of a prolonged "draw fall"
◆ Traders need to wait for confirmation that the price of #WIFUSD is holding steady above $0,55.
And no large trading leverage, because this is a fairly volatile meme coin, even x5 leverage, which allows for a -19% error, or x3, which forgives a “miss” of -32% from the entry point, can liquidate your deposit when trading volatile assets.
⁉️ Do you believe that the price of #dogwifhat can still return to the $4 range with a corresponding project capitalization of $4 billion?
_____________________
Did you like our analysis? Leave a comment, like, and follow to get more
WIFUSDT
WIF WIF - He is back!WIF looks good for a straight move and mostly due to hype of liq hunting hahhahahaa

WIF - NEw Day New WifsAs suggested if a certain liquidity surge comes then we can plan for longs, but looks like 15MIns PoC will be magnet for that to 0.768

WIF WIF! _ Its done!So as said and mentioned about WIF in my previous chart, smooth moves as usual!!

WIF to the destiny!SO i didnt posted here but on my channel - not advertisng admin!!!
SO This is what you can observe or play to the lower ob marked in green!

WIFUSDT Forming Classic Wedge WIFUSDT has recently formed a classic wedge pattern, a powerful technical indicator often associated with upcoming breakouts. Wedge patterns, especially those with tightening price action and consistent volume, suggest a coiled market preparing for a strong directional move. In the case of WIFUSDT, this wedge structure is showing all the right characteristics for a bullish breakout, supported by growing trading volume and increasing investor interest.
The price structure within the wedge is narrowing, indicating a possible compression before expansion. This typically precedes a sharp breakout, and current market behavior around WIFUSDT suggests bulls are positioning themselves for a significant upside move. Technical projections show a strong potential for gains ranging between 140% to 150%+, especially if the breakout is accompanied by momentum confirmation on higher timeframes.
What adds to the bullish thesis is the noticeable uptick in trading volume, which confirms that accumulation might already be underway. When volume supports a pattern breakout, it often adds strength and sustainability to the move. With market sentiment slowly shifting and capital rotating into altcoins, WIFUSDT stands out as a high-potential candidate in the current environment.
WIFUSDT is quickly becoming a favorite among breakout traders and short-term investors looking to ride explosive setups. If the wedge breaks to the upside as expected, it could mark the beginning of a strong rally phase. Traders may want to monitor closely for entry signals as the breakout unfolds.
✅ Show your support by hitting the like button and
✅ Leaving a comment below! (What is You opinion about this Coin)
Your feedback and engagement keep me inspired to share more insightful market analysis with you!

Call an Ambulance - But for Shorters - WIF WIFWIF is in such a position that all orders(sell) has been observed by the buyers, on accumulation on darvas box and soon to slice of the sellers! wait and watch!

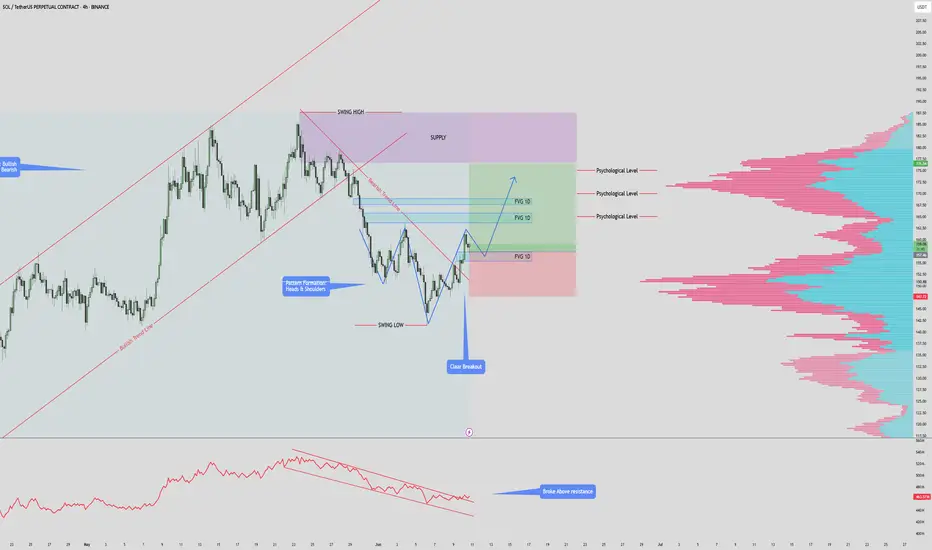
$SOLANA $180 PUMP INCOMINSOL/USDT – 4H Chart Summary
Market Structure:
HTF: Bullish trend remains intact.
LTF: Previously bearish, now showing early signs of a bullish reversal.
Pattern Formation:
Potential Inverse Head & Shoulders forming.
Neckline at $157 — must hold for pattern to complete.
Break above previous high will invalidate Inverse Head & Shoulders.
Trendline & Breakout:
Price has broken above the descending bearish trendline.
Indicates a momentum shift from bearish to bullish.
Fair Value Gaps (FVG):
1D FVG below current price – potential retest & long entry zone.
2x 1D FVG above price – act as targets or supply areas.
Psychological Levels & Volume:
Key levels at $165, $170, $175.
Volume profile shows high liquidity at each of these levels – strong TP zones.
OBV Indicator:
OBV has broken above resistance – supports bullish continuation.
Trade Scenarios:
Bullish Setup:
Long on retest of lower FVG zone ($142–$145).
Target TPs: $165 → $170 → $175 (align with psychological & high-volume areas).
Invalidation:
Break below FVG support or failure to hold above $142.
WIFUSDT Long Setup – Falling Wedge Breakout Incoming?Hey Traders — if you're into high-conviction setups with real momentum, this one’s for you.
WIF has been consolidating inside a falling wedge structure and is now showing signs of strength from the major horizontal support zone around $0.77. The structure is tightening, and the recent bounce from support could be the early signal of a breakout.
Here’s the trade idea:
Entry Zone: $0.77 – $0.81
Breakout Confirmation: 4H close above the wedge trendline (~$0.87)
Targets:
Target 1: $0.95
Target 2: $1.10
Target 3: $1.35
Invalidation / SL: Below $0.74
Risk-Reward: High (3R+ depending on entry)
Strategy:
Wait for a confirmed breakout with volume. Early entries around current support with tight SLs offer favorable setups if you’re comfortable with added risk.
Keep an eye on Bitcoin’s volatility and global macros, as they may influence alt momentum.

You saw a meme. I saw imbalanceWIF doesn’t need to be serious — because I am. This move isn’t about hype. It’s about inefficiency, reclaimed structure, and a clear delivery path.
The logic:
Price swept the lows and gave a clean reaction off the OB. From there, it filled the local FVG but didn’t expand — it paused. That tells me it’s not finished building. The first push wasn’t the move. It was the positioning.
The real draw is layered above:
TP1: 0.9591 — inefficiency midpoint
TP2: 1.0469 — external liquidity and high-volume cluster
The FVG-OB combo below (0.8736–0.8565) is the reload zone. That’s where Smart Money buys. Not above. Not late.
Execution:
Entry: 0.857–0.875 zone
SL: Below 0.825
TP1: 0.959
TP2: 1.046
Let retail react to candles. I’m reacting to context.
Final thought:
“You can laugh at the ticker. Just don’t laugh at the R/R.”

Price collapsed. I didn’t flinch. Here’s whyThat wick didn’t scare me — it confirmed the setup. Volume spiked, price swept an equal low, and printed the reaction I was waiting for.
The logic:
Clean FVG formed on the drop
Price returned to rebalance
Reaction from that FVG confirms Smart Money intent
It’s not about chasing the reversal — it’s about understanding the anatomy of one. And that’s exactly what just unfolded here.
Below price? An untouched EQ level. Above? A full inefficiency gap into 0.99. That’s the delivery map.
Trade framework:
Re-entry: Into the FVG zone (~0.825–0.807)
SL: Below EQ (~0.79)
TP1: 0.91 POC sweep
Final objective: Full push into 0.99
This isn't hype. This is precision. You don't need magic indicators when price gives you the story in volume and imbalance.
Final words:
“I don’t chase the move. I identify where it started — and wait for it to return.”

They brought it down for the fill — now it's time to see who’s rBINANCE:WIFUSDT just reacted perfectly off the 0.618 golden zone at 0.827 with bullish intent. The STB 1D and FVG 1D combo formed a high-probability demand zone that Smart Money won't ignore lightly.
Here’s the bullish roadmap:
Entry: 0.788 (bottom wick through 0.618 fib)
Structure: Clear higher low with mitigation of FVG 1D
Volume: Climax candle into key levels — classic absorption
Targets:
TP1: 0.921 (mid-level fib and consolidation ceiling)
TP2: 1.015 - 1.132 (FVG to OB 1D imbalance fill)
TP3: 1.321 (full expansion target — optimal trade entry delivery)
Moonshot: 1.393 if bulls dominate past OB retest
Invalidation: Daily close below 0.692 (STB 1D)
Price doesn’t just reverse — it transfers power. This is that shift.
For more plays just like this — all based in structure and timing — check the profile for setups that speak precision, not prediction.

I didn’t chase the high. I waited for the reclaim.WIF ran the 1.048 liquidity, reversed, and now it's offering the kind of structure I don’t second-guess. This isn’t about trend — this is about reclaiming control.
Here’s the map:
Price retraced cleanly into the BPR zone between 0.944 and 0.920 — right in the middle of the fib rebalancing zone
0.618 fib sits at 0.920, which makes this entire region a Smart Money entry block
Below that is the 1H OB at 0.840 — a worst-case sweep zone if liquidity gets run
Current structure suggests a tight range building beneath the previous high — a classic setup before a displacement move into 0.999 → 1.048
Hold above BPR and reclaim 0.969? That’s your greenlight.
Execution plan:
Entry: 0.944–0.920
TP1: 0.969
TP2: 1.048
Invalid below: 0.885 — or full re-entry from the 1H OB near 0.840
The move already happened. This is the retest. You either planned for it — or you're reacting late.
Precision like this lives in the profile. Setup-first. Noise-free.

This wasn’t a bounce. It was a reclaim.BINANCE:WIFUSDT.P hit the daily OB at 0.8330 and snapped back — not with hope, but with intent.
Smart Money didn’t panic on the drop. It positioned.
Here’s the structure:
Price tapped a clean D OB, aligned perfectly with 0.618 fib — the algorithm’s comfort zone
The bounce reclaimed 1.00 fast, and the market is now flirting with internal liquidity near 1.0178 and 1.1339
Above, the real draw sits at 1.3965 — a void yet to be filled
Below, we still have W OB liquidity near 0.7260 if this rotation fails
This move doesn’t need hype. It needs follow-through. If we consolidate above 0.9299 and break into 1.0178 clean, the next phase unlocks — straight into the 1.13–1.32 range.
Execution plan:
Bias remains bullish above 0.92
Pullbacks into 0.89–0.83 are still valid long zones as long as 0.7260 doesn’t get breached
Target 1.1339 first — then 1.3965 as the higher timeframe liquidity magnet
This setup isn’t emotional. It’s engineered. You don’t need to guess when price is built to deliver.
More trades like this — real levels, real invalidations — are in the profile description.

A 35% fall in WIF from its current price levels is possibleWIF has just broken below the 200 EMA on the H4 timeframe and reacted to an imbalance area.
From here, it’s possible for a pullback to form in an ABC pattern with low volume on the upward move, potentially testing the resistance zone where the 200 EMA may also act as resistance.
Looking at the BTC chart, there’s still room for further downside, which supports our thesis.
Using the RSI across the M15 and H1 timeframes to identify overbought areas with divergence could serve as the entry trigger.
Let’s see what this week brings!

WIF sniffs!WIF looks to sniff a bit but the OB looks very delicious atm, 35% buys at cmp but buys at the orange box looks more like a delicaisies where two instances are marked what can happen!

WIF WIF, whose there?Bit late to post as i posted it late, but however wif looks weak to break even the black line!

#WIF/USDT#WIF
The price is moving within a descending channel on the 1-hour frame, adhering well to it, and is heading for a strong breakout and retest.
We are seeing a rebound from the lower boundary of the descending channel, which is support at 1.06.
We have a downtrend on the RSI indicator that is about to be broken and retested, supporting the upward trend.
We are looking for stability above the 100 Moving Average.
Entry price: 1.068
First target: 1.115
Second target: 1.157
Third target: 1.211

WIF/USDT About to Explode or Collapse?Yello Paradisers, have you prepared yourself for what’s about to unfold on SEED_WANDERIN_JIMZIP900:WIF ? Because this setup is screaming opportunity but only for those who are ready to act with precision and patience.The current price structure is forming a classic descending wedge, a pattern that historically resolves with explosive moves. But here’s where it gets really interesting.
💎#WIFUSDT is now grinding toward a key demand zone between 0.82 and 0.87, where there is a high probability of a strong rebound. This zone aligns perfectly with the 50 EMA, further reinforcing the potential for a bullish reversal.
💎If the demand holds, we could easily see price break out from this compression pattern and push toward the moderate resistance near 1.22. Above that, the major resistance zone around 1.42 to 1.45 remains the next magnet a zone where large players are likely to take profit or even reverse positions.
💎However, we’re not ignoring the bear case either. If this demand fails to hold, and the price we are expecting for a bullish rebound from the lower demand at $0.719 closes below 0.642, the setup becomes invalidated, and the door opens for a deeper correction—possibly driving price toward or even below the 0.50 level. That would flush out overleveraged positions and trap breakout traders on the wrong side once again.
Patience and precision will be your edge in this volatility. Be a pro. Trade smart. Stay disciplined.
MyCryptoParadise
iFeel the success🌴

WIF NEXT In my opinion, this is the likely scenario.
* The purpose of my graphic drawings is purely educational.
* What i write here is not an investment advice. Please do your own research before investing in any asset.
* Never take my personal opinions as investment advice, you may lose your money.

WIFUSDT 1D Analysis WIF ~ 1D Analysis
#WIF Buy gradually after successfully breaking through this resistance line with a short-term target of at least 15%++

WIF WIF, whose there?WIF looks dope for this moment as of now holding can blast of to the point stated and stipulated!!

WIF/USDT - Fresh meme coin. Trading setup in chanal. Popular fresh meme coin – Dogwifhat
📊 CoinMarketCap Rank: #102
🐦 Twitter (X) : 152K followers
💬 Telegram : 50K members
✅ Highly liquid meme coin – traded on many major exchanges, including Binance.
After the hype phase , the coin is now declining along with the overall crypto market —no exceptions. Essentially, it broke below multiple channel supports , and the price is now sitting at the support of the outer channel.
I also notice a non-textbook Head & Shoulders pattern, which suggests a potential -64% breakdown . The last squeeze happened around this level.
Currently, we are seeing consolidation with increased volume , along with high-wick price action in this zone.
I've marked potential downside support zones as well as upside resistance targets on the chart. Consider this in your trading strategy!
