Memecoin with potential for purchase.Hello friends🙌
Considering the decline we had in the weekly timeframe, you can now see that with the good growth we had, it gives us a good signal to buy, of course in a stepwise manner and with capital and risk management.
🔥Follow us for more signals🔥
*Trade safely with us*
Wifusdtanalysis

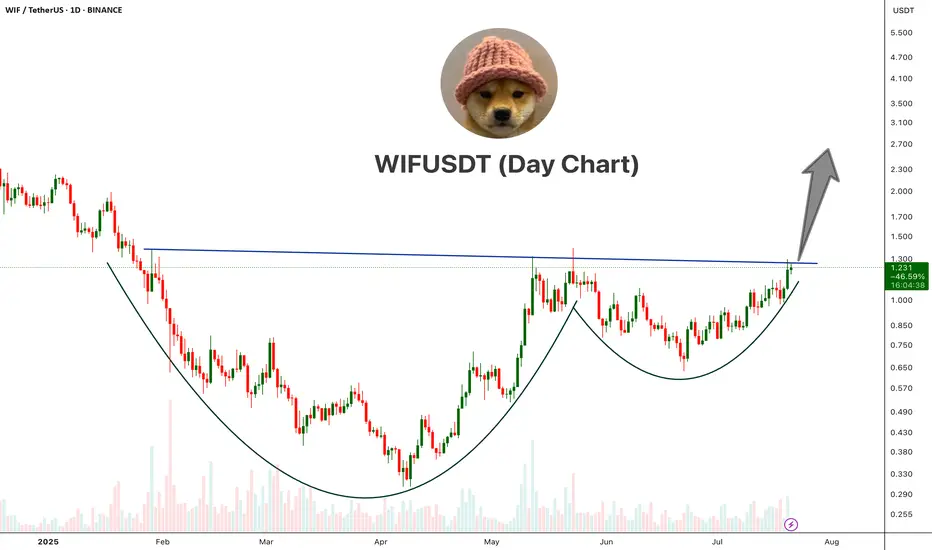
WIFUSDT Cup And Handle PatternWIF is showing a classic Cup and Handle pattern on the daily chart, a strong bullish reversal setup.
The price has broken above the neckline resistance around the $1.25–$1.30 area with bullish momentum. This breakout, if sustained with volume confirmation, could open the doors for a major upside move.
Cheers
Hexa
BINANCE:WIFUSDT
Price explosion is coming?Read carefullyhello friends👋
We have come to analyze a popular Kuwaiti meme that you have asked to analyze a lot.
🌟Well, according to the drop we had, it can be seen that the buyers came in and formed a good upward wave, and after that, Femt entered a channel, which can be said to be a flag pattern...🧐
Now, according to the formed channel, we can enter into a purchase transaction with capital and risk management in case of a valid failure of the channel.
🔥Follow us for more signals on Bolran.🔥
*Trade safely with us*

Skeptic | Dogwifhat (WIF): Precision Triggers for Spot & FuturesWelcome, traders, Its Skeptic! 😎 Is Dogwifhat (WIF) the next meme coin rocket or a risky gamble? I’m diving into a pro-level breakdown of WIF, the Solana-based meme coin with a $882.06M market cap, ranked #75 globally. This analysis covers recent performance, ecosystem strengths, and technical triggers for spot and futures trading, grounded in cycle-based strategies. Trade with no FOMO, no hype, just reason. Let’s dissect WIF! 🚖
📰 Recent Performance & Key Events
Dogwifhat (WIF) , a Solana-based meme coin launched in late 2023, trades at 0.886 with a $882.06M market cap, ranking #75 globally. Featuring a Shiba Inu in a pink beanie, it leverages Solana’s high-speed, low-fee blockchain and a deflationary burn mechanism with a 998.9 million token supply. Listed on major exchanges like Binance, KuCoin, and Gate.io, WIF enjoys strong liquidity. In July 2025, it’s up 5.26% in 24 hours and 24.57% over 7 days, with a 24-hour trading volume of $450M. However, it’s down 80.94% from its all-time high of $4.84 (March 31, 2024), reflecting meme coin volatility :)
Technical & Market Position
WIF benefits from Solana’s scalable ecosystem, a hub for DeFi and NFTs, with 160,000+ TPS and low fees, outpacing slower networks. Its community-driven appeal, active on X, Reddit, and Discord, fuels its momentum, with posts highlighting a cult-like following. Compared to Pepe ($4.08B market cap, 456,000+ holders, 37% holding over a year), WIF’s smaller but vocal community shows dedication. However, its lack of real-world utility and reliance on social media hype mirror Pepe’s 25.7% year-to-date drop, raising concerns about sustainability.
Risks : Speculative volatility, pump-and-dump schemes, and dependence on Solana’s performance and social media sentiment make WIF a high-risk bet. Use stop loss to manage swings.
📈 Technical Analysis
Daily Timeframe
The Weekly (HWC) is bearish, entering a major bearish trend after forming a double bottom and breaking support. However, the Daily (MWC) started an uptrend, achieving 350 % growth before correcting to the 0.5 Fibonacci retracement —a healthy correction without breaking the uptrend momentum. Key support zones are $0.635–$0.679 . A break below could resume the Weekly bearish trend, so stay alert.
Spot Trigger (Long): Break above resistance at $ 1.047 , confirmed by a volume surge (ideally 2x the average of the prior 5–7 candles). Volume is critical—technical analysis is an art, not a science, so don’t fixate on exact numbers.
Key Insight: The Daily uptrend holds, but a volume spike is essential to confirm bullish moves and avoid fakeouts.
4-Hour Timeframe (Futures Triggers)
On the 4-hour chart (LWC), for longs:
Trigger: Break of the downward trendline and resistance at $ 0.958 , with volume confirmation (strong volume seen in the prior uptrend leg). Additional confirmation: RSI re-entering overbought.
Shorts: No short trigger currently. Despite the Weekly bearish HWC, the Daily MWC uptrend and strong support at $0.635–$0.679 make shorting illogical. Wait for a support break and MWC turning bearish for a safer short with better R/R.
Pro Tip: Longs are viable with volume and RSI confirmation. Avoid shorts until the MWC aligns bearish to minimize fakeout risk. Always use MAX 1%–2% risk per trade.
Final Vibe Check
This WIF breakdown delivers precise triggers for spot ($1.047) and futures ($0.958 long, no short yet), leveraging cycle-based strategies. With a bearish Weekly but bullish Daily, prioritize volume confirmation to navigate meme coin volatility. Solana’s ecosystem and exchange listings give WIF an edge, but its hype-driven nature demands caution. Want more cycle setups or another pair? Drop it in the comments! If this analysis sharpened your game, hit that boost—it fuels my mission! 😊 Stay disciplined, fam! ✌️
💬 Let’s Talk!
Which WIF trigger are you watching? Share your thoughts in the comments, and let’s crush it together!

WIF/USDT – Major Breakout Incoming! Potential Upside Over +400%!Technical Analysis:
The WIF/USDT (dogwifhat / Tether) pair on the 1D timeframe is currently showing signs of a bullish breakout from a well-defined descending channel that has formed over the past few months.
📌 Key Highlights:
Price has been consolidating within a descending channel since March 2025.
It is now attempting to break out above the upper boundary of the channel – a strong bullish signal.
The breakout is forming after a strong bounce from the $0.70–$0.75 support zone, indicating accumulation and potential trend reversal.
📈 Resistance Levels (Target Zones):
1. $1.0251 – first key resistance to watch.
2. $1.2008 – minor resistance, ideal short-term target post-breakout.
3. $1.8468 – major historical resistance level.
4. $2.1772 – key psychological and technical level.
5. $2.9503 – extended bullish target.
6. $4.1525 – maximum bullish projection in case of parabolic move.
📉 Support Levels:
$0.8627 – current price level.
$0.70–$0.75 – previous strong support zone and lower channel base.
📊 Strategy Insight:
A potential entry could be considered on a confirmed breakout and retest around $1.02.
Targets can be scaled based on resistance levels mentioned above.
Use proper risk management and stop-loss below the channel to avoid fakeouts.
Conclusion:
WIF/USDT is showing a strong bullish reversal structure, breaking out from a mid-term descending pattern. This could be the beginning of a massive upward impulse, with over +400% potential gain if key targets are reached. A critical moment for traders and investors to pay attention!
#WIFUSDT #WIFBreakout #CryptoAnalysis #AltcoinSeason #Dogwifhat #BullishSetup #BreakoutAlert #CryptoTrading #CryptoSignals #WIFArmy

WIF to the destiny!SO i didnt posted here but on my channel - not advertisng admin!!!
SO This is what you can observe or play to the lower ob marked in green!

WIF/USDT About to Explode or Collapse?Yello Paradisers, have you prepared yourself for what’s about to unfold on SEED_WANDERIN_JIMZIP900:WIF ? Because this setup is screaming opportunity but only for those who are ready to act with precision and patience.The current price structure is forming a classic descending wedge, a pattern that historically resolves with explosive moves. But here’s where it gets really interesting.
💎#WIFUSDT is now grinding toward a key demand zone between 0.82 and 0.87, where there is a high probability of a strong rebound. This zone aligns perfectly with the 50 EMA, further reinforcing the potential for a bullish reversal.
💎If the demand holds, we could easily see price break out from this compression pattern and push toward the moderate resistance near 1.22. Above that, the major resistance zone around 1.42 to 1.45 remains the next magnet a zone where large players are likely to take profit or even reverse positions.
💎However, we’re not ignoring the bear case either. If this demand fails to hold, and the price we are expecting for a bullish rebound from the lower demand at $0.719 closes below 0.642, the setup becomes invalidated, and the door opens for a deeper correction—possibly driving price toward or even below the 0.50 level. That would flush out overleveraged positions and trap breakout traders on the wrong side once again.
Patience and precision will be your edge in this volatility. Be a pro. Trade smart. Stay disciplined.
MyCryptoParadise
iFeel the success🌴

WIFUSDT 1D Analysis WIF ~ 1D Analysis
#WIF Buy gradually after successfully breaking through this resistance line with a short-term target of at least 15%++

WIF WIF, whose there?WIF looks dope for this moment as of now holding can blast of to the point stated and stipulated!!

WIF Bulls Charge After Breakout – Can It Hit $2?SEED_WANDERIN_JIMZIP900:WIF has broken above the descending trendline, a key structure that had been capping price for several weeks. This breakout, paired with today’s nearly +10% surge, suggests bullish momentum is building.
The price is now approaching the 50 EMA, which may act as short-term resistance. A clean breakout and close above this level could trigger a strong upside move toward higher zones, as marked on the chart.
Targets remain open toward $0.80, $1.30, and possibly $1.97 if momentum holds.
DYOR, NFA

WIFUSDT 1WWIF ~ 1W Analysis
#WIF Buy back from here with a short-term target of at least 15%+.
This is a very strong support level for now.

WIF / USDT : Retesting Trendline after breakout WIF/USDT: Retesting Trendline Support After Breakout – Bullish Continuation Ahead?
WIF/USDT is in a crucial phase 📈 as it successfully broke above a key trendline resistance and is now undergoing a retest 📊. This retest could confirm the breakout’s strength, paving the way for further bullish momentum 🚀. If buyers step in at this support level, we could see an explosive move to the upside. Keep a close watch 👀 on how the price reacts to this level.
Key Insights:
1️⃣ Trendline Retest: WIF/USDT has broken out and is now testing the previous resistance as support. Holding this level is critical for confirming a sustained bullish move.
2️⃣ Volume Confirmation: A strong bounce with increasing volume 🔥 would indicate renewed buyer interest and validate the breakout.
3️⃣ Bullish Indicators: RSI and MACD remain in bullish territory ⚡, supporting the potential for further upside if the retest holds.
Steps to Confirm the Retest:
✅ Look for a strong 4H or daily candle bounce from the trendline support.
✅ A surge in volume at the retest level strengthens the bullish case.
✅ If WIF/USDT flips the trendline into solid support, it could trigger a strong upward push.
⚠️ Be wary of failed retests or price closing back below the trendline, which could indicate weakness.
Risk Management Strategies:
🔒 Use stop-loss orders to protect against unexpected reversals.
🎯 Adjust position sizing based on overall risk tolerance.
This analysis is for educational purposes only and not financial advice. Always DYOR 🔍 before making investment decisions.

WIFUSDT 2DWIF ~ 2D Analysis
#WIF If this support block is tested, This will be a very good place of buy. with a minimum target of 20%+.

WIF/USDT – Was That a Fake Breakdown? WIF/USDT – Was That a Fake Breakdown?
WIF showed signs of a breakdown, but it might have been a fake move.
I expect the price to rise soon for the short term. No need to wait for dips, buy and hold. WIF is ready to break out of this zone.
DYOR and trade accordingly.

WIFUSDT: Is This the Last Stand Before a Breakout?A Critical Moment for WIFUSDT: Buyers or Sellers—Who Wins?
WIFUSDT is teetering at a pivotal point, currently priced at $0.9981, reflecting a staggering -79.56% deviation from its all-time high of $4.8848 just 81 days ago. Meanwhile, the asset remains a massive 486% above its absolute low recorded nearly a year ago, underscoring its extreme volatility.
Technical indicators are flashing mixed signals:
📉 RSI14 is hovering around 32.19, signaling that WIFUSDT is approaching oversold conditions, but not quite there yet.
📊 Moving Averages are still bearish, with MA50, MA100, and MA200 sitting well above the current price, reflecting lingering downside pressure.
However, the latest candle patterns suggest growing instability:
✅ Buyers attempted a takeover in the last session, driving prices from $0.9807 to $0.9981 with a high of $1.0194.
❌ Prior bearish volume dominance, where increased selling pressure pulled the price down from $0.9966 to $0.9807, remains a concern.
So, what’s next? Is WIFUSDT on the brink of reclaiming key resistance levels at $1.2916 and beyond, or will it succumb to seller dominance and revisit its lower support zones? Your move, traders.
WIFUSDT Roadmap: Tracking the Market's Next Big Move
VSA Manipulation Sell Pattern 3rd (Jan 31, 18:00 UTC)
Heavy sell-off triggered a sharp decline $1.2625 → $1.1371, with a low at $1.1082. A textbook VSA manipulation move, where weak hands were shaken out. The key question: will buyers step in at this level, or is more downside ahead?
Increased Buy Volumes (Jan 31, 19:00 UTC)
Buyers made an aggressive comeback, pushing the price $1.1371 → $1.1813. A solid confirmation of demand, but resistance at $1.1990 remains a critical barrier. Will this be a continuation or just a liquidity grab before another dump?
VSA Manipulation Buy Pattern 3rd (Feb 1, 10:00 UTC)
This was the true test of bullish strength. Price surged from $1.0916 → $1.1021, closing above the trigger point—a classic signal for an extended move. But will bulls hold their ground, or will sellers take over again?
Increased Sell Volumes (Feb 2, 03:00 UTC)
Trap alert! After a brief rally, sellers stepped back in, pushing the price down $0.9966 → $0.9807. Bears are showing dominance, but they failed to break below the key level of $0.9773.
Sell Volumes Takeover (Feb 2, 04:00 UTC)
This was the moment of truth—bears tried to push lower, but bulls fought back, sending the price $0.9807 → $0.9981. This reversal hints at potential upside, but confirmation is needed with a break above $1.0194.
Conclusion: The market has been heavily manipulated by both sides, but the last pattern suggests sellers are losing steam. If $1.0194 is broken, expect further upside momentum. However, a drop below $0.9773 could signal another bearish wave. Time to watch closely!
Technical & Price Action Analysis
When it comes to trading WIFUSDT, key levels are everything. If buyers can’t hold support, those same levels will flip into resistance—classic market behavior. Here’s the roadmap:
Resistance Levels:
$1.2916 – First real test for bulls, flipping this opens the door for momentum plays.
$1.3355 – A historical supply zone; break and hold above confirms bullish intent.
$1.5553 – Major liquidity level; failure here could mean distribution.
$1.8968 – If price gets here, it’s game on for breakout traders.
$2.0384 – Last known battleground before an aggressive trend shift.
Powerful Support Levels:
$1.4167 – Critical bounce zone; failure turns it into a major resistance.
$2.0848 – If this gets tested, expect big bids or a deep dive.
Powerful Resistance Levels:**
$0.8363 – The biggest wall for any dip buyers; reclaiming flips the script.
$0.35 – If price ever touches this, it’s bargain-bin shopping or full collapse mode.
Smart money watches these levels closely. If support holds, it’s a dip-buying opportunity. If not, those same levels will act as ceilings, trapping breakout traders. Play it right, and don’t get caught on the wrong side of the move.
Trading Strategies Based on Rays
Concept of Rays:
My analysis method is based on VSA Rays, constructed using Fibonacci principles. These dynamic levels define movement channels, allowing us to track price behavior at key zones. The price will either bounce or break through these rays, signaling a reversal or continuation, but only after confirming with volume dynamics and key patterns.
Instead of guessing exact price levels, we focus on probability zones where price interaction with rays gives us trading opportunities. The Moving Averages (MA50, MA100, MA200, MA233) serve as dynamic resistance/support, interacting with these rays and enhancing trade setups.
Optimistic Scenario (Bullish Playbook):
If price confirms interaction with a bullish VSA Ray, we enter long positions targeting the next resistance level. Each new level serves as a potential profit zone or a point of reevaluation.
Entry: Above $0.9981 (confirmed breakout from VSA Ray + bullish candle close)
Target 1: $1.2916 (first ray extension)
Target 2: $1.3355 (higher liquidity zone)
Target 3: $1.5553 (major supply area, strong resistance)
Invalidation: If price drops below $0.9773 and confirms with volume shift
Pessimistic Scenario (Bearish Playbook):
If price rejects from a bearish VSA Ray or fails to hold above dynamic support, shorting opportunities emerge with key downside targets.
Entry: Below $0.9807 (confirmed rejection + bearish volume surge)
Target 1: $0.8363 (first support level, possible bounce)
Target 2: $0.3500 (strong liquidity absorption zone)
Target 3: Below $0.1702 (if major breakdown occurs)
Invalidation: If price reclaims $1.0194 with strong bullish volume
Key Takeaways:
Trade only after confirmation of interaction with rays
Expect movement from one ray to the next—each level acts as a stepping stone
Use MAs for additional confluence—failure to break a moving average signals continuation
Volume always matters—no volume = no conviction, wait for a real move
The market is dynamic, but VSA Rays + Key Levels give us the edge to stay ahead. Watch for interaction and execute with precision.
Let’s Talk Trading—Drop Your Thoughts Below!
Got questions? Want to dive deeper into the setups? Drop a comment! I always check and reply, so let’s discuss the best trading opportunities together.
If this breakdown helped you, hit Boost and save this idea—watch how price respects these levels over time. Trading is all about understanding key reaction zones, and this analysis gives you the exact roadmap.
By the way, my custom VSA Ray indicator automatically maps all these levels and updates in real-time. It’s private, but if you want access—DM me and we’ll talk.
Need analysis for another asset? I can chart anything! Some breakdowns I share publicly, but if you want something private and exclusive—we can arrange that too. Just let me know in the comments what you need.
My rays work on all markets—crypto, forex, stocks—you name it. If you want a custom markup for your asset, just Boost this post and comment below, and I’ll do my best to make it happen.
Most importantly—follow me on TradingView to stay ahead of the market moves. Let’s trade smart, not blind! 🚀

Dogwifhat (WIF) Surges 14% in 4 Hours – Is a Bigger Move Coming?Dogwifhat (WIF) has jumped over 14% in just 4 hours, reaching $1.34 by 12 p.m. EST, as investor interest in this Solana-based meme coin picks up. However, despite this rapid surge, WIF is still battling broader market struggles, having dropped over 7% in the past week and more than 30% in the last month.
According to GeckoTerminal, WIF recently broke through its $1.2451 support level, signaling renewed buying momentum. If it successfully pushes past $1.40, it could trigger a fresh buying wave, potentially sending the price toward $1.7045 and even $2.1221.
However, indicators are painting a mixed picture. While the EMA trend suggests downward movement, the MACD shows signs of buyers stepping in. The MACD lines are inching closer, meaning the next few hours could determine whether WIF sustains its gains or reverses course.
For now, WIF traders are eyeing the $1.40 breakout. If momentum holds, this meme coin could see another leg up. But if resistance remains strong, further consolidation may be in store.

WIFUSDT 2DWIF ~ 2D
#WIF So far it continues to maintain this support block. It looks like this support block is a very good Accumulation zone for now. with a minimum target of 20%+

WIF - LONGRisky but high profit entry. We're going to try another WIF entry. Be very careful as it's risky. You can extend the stop loss if needed as it is a bit tight.
TP 1: 2.4
TP 2: 2.9
SL 1: 1.6
SL 2: 1.5
SL 3: 1.3

Dogwifhat (WIF) price drops 11% – analysisDogwifhat (WIF) price reached its highest levels since March 2024 earlier this month, reflecting an astonishing 1386% gain for the year. However, WIF has faced a correction, declining roughly 11% in the last 24 hours as bearish signals intensify.
Momentum indicators like the Ichimoku Cloud and ADX show strong bearish trends, with sellers firmly in control of the market. Whether WIF can hold key support levels or recover enough strength to test resistance zones will define its short-term trajectory.
Since early December, the price action has consistently made lower highs and lower lows, with the latest movement showing an aggressive bearish drop.
ADX is currently at 47, up from 36 yesterday, signaling a strong and growing trend. However, with WIF in a downtrend, the rising ADX indicates strengthening bearish momentum. This suggests the downward movement is likely to continue, as sellers remain dominant in the market.
On the chart, EMA lines currently display a bearish configuration, with short-term EMAs positioned below long-term ones. This setup suggests continued downward pressure, and WIF is likely to test the support at $2.19.
If this level fails to hold, WIF price could decline further, potentially reaching $1.88 as the next significant support.
On the other hand, if WIF price manages to reverse its downtrend and regain positive momentum, it could challenge the resistance at $2.91.
A successful breakout above this level could pave the way for further gains, with targets at $3.47 and possibly even $4 if the uptrend gains strength.

WIF - Good opportunity for LONG (Re-entry)Very good shopping site, this can go up a lot soon. We are in excellent support.
T1: 3.15
T2: 3.50
T3: 3.95 - 4

WIF - Good opportunity for LONGVery good shopping site, this can go up a lot soon.
T1: 3.15
T2: 3.50
T3: 3.95 - 4

WIFUSDT last dip before $10 !!Join our community and start your crypto journey today for:
In-depth market analysis
Accurate trade setups
Early access to trending altcoins
Life-changing profit potential
Let's analyse WIFUSDT on HTF for Spot trade set-up.
TECHNICAL ANALYSIS:
Wif has broken out of a wedge pattern, suggesting a potential bullish trend. The recent market dip appears to be a retest of the daily support level, which aligns with the 200-day EMA. With a 160% increase in 24-hour volume, a significant rally of up to 300% is anticipated.
Entry: CMP to $2.569
Target:
$4.1,
$5.09,
$10.12
If you find this analysis helpful, please hit the like button to support my content! Share your thoughts in the comments and feel free to request any specific chart analysis you’d like to see.
Happy Trading!!

#WIF - Next leg up loading -> Min 40% Are you ready for the next leg up for BINANCE:WIFUSDT ?
Price is now inside the massive bullish swing retrace:
1. Just hit 0.618 retrace
2. Is forming a huge 4h hidden bullish divergence on both RSI and Stochastic RSI (continuation pattern for beginners)
3. There is plenty of liquidity above those juicy high wicks
Pack your bags now, you don't want to miss this one, it's close to 50% to break the nearest high!
Follow for more ideas and drop me a comment with what other charts you want to see!
