Taming the Trend: Mastering the Williams Alligator IndicatorEver wondered how to spot when the market is sleeping or ready to roar? At Xuantify , we use the Williams Alligator Indicator to decode market behavior with precision. Whether you're trading crypto, forex, stocks, or indices — this tool adapts across all markets. Let's take a closer look using BINANCE:BTCUSDT
🧠 How We Use It at Xuantify
We treat the Alligator as a trend confirmation and timing tool . We don’t just look for crossovers — we analyze the distance , angle , and alignment of the lines to gauge market momentum and trend maturity. It’s especially powerful when combined with volume and volatility filters.
⭐ Key Features
Three Smoothed Moving Averages
Jaw (Blue) : 13-period, shifted 8 bars forward
Teeth (Red) : 8-period, shifted 5 bars forward
Lips (Green) : 5-period, shifted 3 bars forward
Visual Trend Clarity :
The spacing and direction of the lines reveal trend strength and direction
Built-in Delay :
Forward shifting helps anticipate rather than react
💡 Benefits Compared to Other Indicators
Trend Clarity
Alligator : Strong — bold trend visualization
Moving Averages : Moderate — can lag or overlap
MACD : Good — clear histogram and signal line
Noise Filtering
Alligator : Excellent — smooths out market noise
Moving Averages : Low — sensitive to short-term fluctuations
MACD : Good — filters minor moves
Early Signals
Alligator : Moderate — waits for confirmation
Moving Averages : Fast — quick crossovers
MACD : Fast — early divergence signals
Visual Simplicity
Alligator : Clear — easy to interpret trend phases
Moving Averages : Cluttered — multiple lines can overlap
MACD : Complex — requires interpretation of histogram + lines
⚙️ Settings That Matter
For shorter timeframes : Reduce periods (e.g., 8-5-3) for faster signals
For longer timeframes : Stick with defaults or increase smoothing for clarity
Shift values : Keep them forward-shifted to maintain predictive edge
📊 Enhancing Signal Accuracy
Wait for clear separation between the lines
Confirm with volume spikes or breakouts
Use price action (e.g., higher highs/lows) as confirmation
🧩 Best Combinations with This Indicator
Fractals : For entry/exit signals
ATR : For dynamic stop-loss placement
RSI or Stochastic : To avoid overbought/oversold traps
Volume Profile : To validate breakout zones
⚠️ What to Watch Out For
Flat Alligator = No Trade Zone : Avoid trading when lines are tangled
Lag in Fast Markets : In high-volatility assets, the Alligator may react late
Over-reliance : Always combine with other tools for confirmation
🚀 Final Thoughts
The Williams Alligator isn’t just an indicator — it’s a market behavior model . At Xuantify, we use it to stay aligned with the market’s rhythm, avoid chop, and ride trends with confidence.
🔔 Follow us for more educational insights and strategy breakdowns!
Williamsalligator

Falling Wedge Pattern For ZCash??When a security's price has been falling over time, a wedge pattern can occur just as the trend makes its final downward move.
The trend lines drawn above the highs and below the lows on the price chart pattern can converge as the price slide loses momentum and buyers step in to slow the rate of decline.
Before the lines converge, the price may breakout above the upper trend line.

When in doubt, ZOOM OUT!!! GIANT Ascending Triangle Breakout!!BTC broken flush to the upside of a GAINT Ascending Triangle & is consolidating into a horizontal channel.
We have noticed a move below the baseline support of the horizontal channel, but it appears to be a fake-out/shake-out.
This pattern is referred to as a Bullish Expanding Triangle highlighted in red.
Next stop, $300k USD.

Bull Flag breakout for SWFT!!!SWFT appears to be showing bullish strength over these recent months..
Sell offs get gobbled up....
The williams alligator is trending upward which is inherently bullish.
SWFT is consolidating into a bullish flag or bear flag.
The downward sloping resistance has been tested over half a dozen times, the base of the pattern coincides with the previous high...
Price target of 4c in the near term.

Bear Flag or Bullish Flag for ZcashZcash appears to be consolidating into a bearish flag or a bull flag after breaking to the upside of an ascending triangle.
The horizontal resistance of the macro ascending triangle has turned into the baseline support of a micro bear flag or bull flag.
The RSI is very low on a 1 year chart.
Zcash has made over half a dozen higher lows until recently we have seen a neutral low coinciding with the previous.
The williams alligator has turned downward which is bearish.

Ascending Triangle Breakout For ZCashDec 8 Private Post-
With privacy continuing to erode globally at an alarming rate we will continue to see an influx of capital allocated to assets like Zcash, Roger Ver & other OG Crypto investors will Ape into privacy coins due to an alarming enforcement.
Zcash is showing multiple bullish indicators.
The Williams alligator is trending upwards in a bullish fashion, the bands are widening to the upside and the price is bouncing off the bands displaying strong support to the upside at the upward sloping support of the pattern.
We could see a retrace to the blue band of the Williams alligator at approximately $52 USD.
But why penny pinch, $370 USD incoming in 2025, Alt season hasn't even started yet and Zcash is going to go from an Alt coin to one of the main cryptos due to privacy features.
Zcash has tested the upward sloping support of the ascending triangle over half a dozen times and each time the price increases to create a micro higher high & lower low.

$140K USD for Bitcoin in 2025!!! It appears as though Bitcoin is trading in a descending channel, with a potential breakout happen in the near term.
BTC has tested the downward sloping resistance of a descending channel pattern multiple times, each time BTC is creating a lower high & a lower low, which is inherently bearish.
The williams alligator is also displaying a bullish cross & the bands are widening in an upward direction, which is a bullish indicator.
Bullish cross on the KST as well. I have placed upward arrows at each bullish cross in the recent past showing a direct correlation to upward price swings.

$78k Incoming for BTC by September 2024!!!Bullish cross on the KST.
Bullish cross on the Williams Alligator.
Bitcoin is showing several bullish indicators suggesting a move higher in the near term...

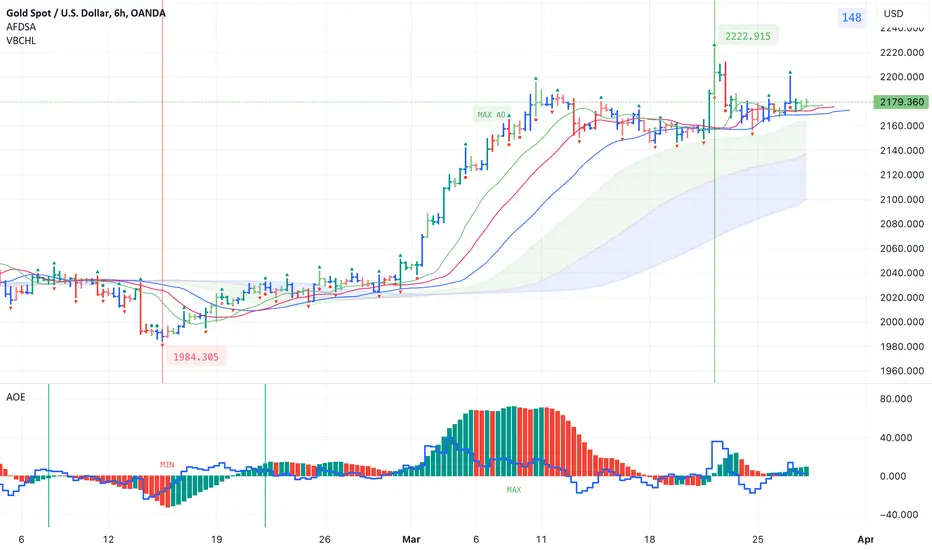
Indicators for trading using Bill Williams' Profitunity strategyI published 3 indicators for trading using Bill Williams' Profitunity strategy. For each indicator, I have added a visual and detailed description in English and Russian. In this post I will briefly describe these indicators and how I use them together.
AFDSA indicator (Alligator + Fractals + Divergent & Squat Bars + Signal Alerts)
Includes Williams Alligator, Williams Fractals, Divergent Bars, Market Facilitation Index, Highest and Lowest Bars, maximum or minimum peak of the Awesome Oscillator, and signal alerts based on Bill Williams' Profitunity strategy:
Bullish and Bearish Divergent Bar Signal + Squat Bar + Green Bar + Fake Bar + Awesome Oscillator Color Change + AO Divergence.
Crossing the green line (Lips) of an open Alligator.
Formation of a fractal.
Signal about the breakdown of the last upper or lower fractal.
Signal about the appearance of a new maximum or minimum peak of AO in the interval of 140 bars from the last bar.
I also added an Alligator display for the higher timeframe, for example, if the chart timeframe is 1 hour, then the higher timeframe will automatically be 4 hours, if the chart timeframe is 4 hours, then the higher timeframe will be 1 day, etc.
AOE Oscillator (Awesome Oscillator + Bars count lines + EMA Line)
Includes the Awesome Oscillator with two vertical lines at a distance of 100 and 140 bars from the last bar to determine the third Elliott wave by the maximum peak of AO in the interval from 100 to 140 bars according to Bill Williams' Profitunity strategy. Additionally, a faster EMA line is displayed.
I also added display of the AO line for the lower timeframe instead of the EMA line if the Moving Average Line values (method, length and source) are equal to the Awesome Oscillator values in the indicator settings. For example, if the chart timeframe is 1 day, then the lower timeframe will automatically be 4 hours, if the chart timeframe is 4 hours, then the lower timeframe will be 1 hour, etc.
VBCHL indicator (Visible bars count on chart + highest/lowest bars, max/min AO)
The indicator displays the number of visible bars on the screen, including the prices of the highest and lowest bars, the maximum or minimum value of the Awesome Oscillator. The values change dynamically when scrolling or changing the scale of the chart, but with a delay of several seconds, so this feature is included in a separate indicator so as not to slow down the work of other indicators.
Indicator settings
In the AFDSA indicator I use the following settings:
By default, the Squat Bar is colored blue, and all other bars are colored to match the Awesome Oscillator color, except for the Fake bars, which are colored with a lighter AO color. But I also enable the display of "Green" Divergent bars in the "Green Bars > Show" field.
I enable the display of Alligator for higher timeframes in the "Alligator for higher timeframe > Enable" field.
In the indicator style settings, I disable the display of the highest and lowest bars, maximum and minimum AO peak labels, because these labels are also displayed by the VBCHL indicator depending on the number of visible bars in the chart window.
Only after opening a position, I enable all additional alerts in the “Enable all additional alerts” field (after changing this field, you need to re-create the alert for the current chart): crossing the green line of an open Alligator, formation of a fractal, appearance of a new maximum or minimum AO peak.
In the settings of the AOE oscillator, I enable the display of the AO line for the lower timeframe instead of the EMA line, setting the same values in the fields for the Moving Average Line (method, length and source) and Awesome Oscillator.
In the VBCHL indicator settings, I only enable the simple display text style for labels in the "Simple display text style for labels" field.
As a result, when analyzing the current chart, I immediately see all the signals on the chart, the location of the bars relative to the Alligator on the higher timeframe and changes in the Awesome Oscillator on the lower timeframe. And thanks to the VBCHL indicator, I quickly select the desired timeframe for analyzing the 5-wave Elliott impulse, focusing on the interval of 140 bars, and immediately see whether there is divergence between the maximum AO peak and the following lower AO peak in this interval.
Ascending Triangle breakout for CRSP....It appears as though CRSP is forming a micro ascending triangle that is likely to result in bullish momentum....
The Williams Alligator is widening to the upside and there was recently a bullish cross.
This is inherently bullish, but could always change in an instant....

TSLA 120 minutes Chart Moving Average pullbacks for Short EntryTSLA has been trending down in a channel since it marked the first trading day of this new year.
The chart is set up on a 120-minute time frame with the Williams Alligator indicator of
SMA10 SMA20 and SMA50 ( offsets 10, 5, & 2). In a strong downtrend, the averages are parallel
with SMA50 higher then SMA20 and SMA 10. For a good short entry, the price should pullback (
and up) through the SMA10 but not through the SMA20. An entry is taken when price falls
back through the SMA10. The supertrend may be reversing if any of the lines cross in a
golden fashion or price crosses the SMA20 or SMA50. On the chart, red down arrows mark the
best six entries YTD. There have been no exits despite any shorting pullbacks such as the past
day or so more or less from some news catalyst delivered by a certain fund manager to protect
her glut max and maybe wallets of clients. This strategy is well suited for a low intensity low
effort & minimal screen time type trader of shares or options to strike a balance overall and
profitable one at that with more simplicity and less complexity with noise and indicator
overload tuned out.

You don't need Heikin AshiHeikin Ashi is a popular trend indicator.
The open values of Heikin Ashi point out the potential trend reverse price level.
However, not all chart services privide Heikin Ashi.
In fact, there is an another way to estimate the open values of Heikin Ashi.
It is SMMA.
William Alligator uses 3 SMMA at a time.
We can set
Offset = 0
Lips = 2
Teeth = 8
Jaw = 32
Lips , also SMMA(2), estimate the open values of Heikin Ashi of the current timeframe.
Teeth and Jaw are the preview of the open values of Heikin Ashi in higher timeframes.

Structure: False OutNotice the Alligator overlay, and the declining High fractals while the Alligator increases (Lower Price/Higher Indicator). With the steepe Low above the Teeth, a bear exit requires standard divergence: not reverse bearish. With this exit being flawed, price should return to the false out...the Highs become the bull buy line...the false Low exit is now the bull stop line.

Renko: SweetSweetLuciaThis indicator is good, it can be utilized for timing entries and exits.
The Cross symbol, is the opening (Bearish or Bullish).
The Square symbol, is a pivot crossing (Bearish or Bullish).
The moving averages, aide the price wave identification.
The settings for Renko:
Seven Bars: a recent wave count with a line graph, on Bollinger Band breaches.
Traditional: seems more responsive.
OHLC: to include inside bars.

Acreage is flirting with the resistance of a descending channel Bullish cross on the KST & Williams alligator.
The stock is getting very close to the 200DMA.

JSDA is showing bullish momentum! Ascending Triangle?Bullish cross on the KST where I've placed a blue thumb up.
Bullish cross on the Williams alligator with widening brands to the upside, inherently bullish indicator.
Playing peekaboo with the 200DMA.
A break above the 200DMA & 55c to 70c incoming real quick, maybe entering the cannabis sector is the type of move that will eventually attract volume to the newly CSE listed ticker for Jones Soda. Lots of great reviews on Mary Jones IN California.
Expect strong resistance at 80c if bullish momentum continues into the new year.

The trend is your friend, let it run!!The bullish momentum is undeniable since breaking above the 200 DMA in September.
Bullish cross on the William Alligator in September coinciding with the 200 DMA bullish cross.
On the Williams alligator, the bands expanding/widening in an upward motion, inherently bullish. But if I am commenting on the stock a Grizzly bear is lurking in the bushes...
8-dollar resistance, 18-dollar resistance, then 28, trade-ups and downs, it's. going to be a rollercoaster!

Descending Broadening Wedge for TSLA?!?Bearish cross on the Williams Alligator.
Bullish Cross on the KST.
$25.00 by 2025 unless TSLA pulls another Solar City-type deal with SpaceX.
If the stock does a 360 it'll only be to $360USD.

H&S - Double top.The bands of the Williams alligator are expanding to the downside, inherently bearish, you want to see the bands trending upward and expanding similar to before the bearish shift in momentum.
EOM.

QQQ Decade-Long Trend BrokenThe Nasdaq 100 has closed under the blue gator (SMMA) for the first time in over a decade. This means we're likely to see several months of downtrend following until the AO has had a zeroline cross and possibly a hidden divergence with the '08 lows. Minimum price target is around the "covid lows" with wave-e ending around June of next year.

Biil Williams Aligator Indicator Explanation on BTC MarketCapHello Friends.
Today we will explain Aligator indicator on BTC Marketcap Chart.
this post has 2 purpose:
1)BTC marketcap analyze
2)Learn how Bill Williams Aligator indicator works
First lets see how this indicator works:
The Alligator indicator is composed of three smoothed moving averages.
It is named ‘alligator’ because it mimics the feeding habit of the animal and can help traders
pick out the best times to ‘feed’ on the pips available in a trending market.
Here are the lines that constitute the Alligator indicator:
Alligator’s Jaw
This is a 13-period smoothed moving average.This line is typically visualised in blue.
Alligator’s Jaw = SMMA (median price, 13, 8)
Alligator’s Teeth
This is an 8-period smoothed moving average. This line is typically visualised in red.
Alligator’s Teeth = SMMA (median price, 8, 5)
Alligator’s Lips
This is a 5-period smoothed moving average. This line is typically visualised in green.
Alligator’s Lips = SMMA (median price, 5, 3)
Trading Rules:
When the lines are intertwined or converging, it implies that the market is ranging (the ‘alligator’ is sleeping).
The longer the alligator sleeps, the hungrier it will wake up; prolonged consolidation will imply a massive breakout.
The alligator’s lip will be the first to move (crossing above or below the jaw) when it is waking up, which denotes the
Begining of a new trend.
An upward movement implies an uptrend might be forming, whereas a downward movement implies that a potential downtrend is starting.
A trend will be confirmed when the alligator’s teeth cut through the lips.
This will be the signal to buy in a confirmed uptrend or to sell in a confirmed downtrend.
The signal to take profits will come when the lines start to converge again, which will mean that the alligator is now about to repeat the sleep cycle.
Now lets see what happened in BTC marketcap According to this Strategy:
We can see awakening of aligator from 9 march 2020 untill 12 april 2021.
it shows a strong uptrend and aligator lines divergence.
I show it with a Green Ellipse in chart.
after that aligator go to sleep for a while from 12 april 2021 to 18 jan 2022.
so we can see a Range in price and aligator lines converging.
I show that with a Yellow Ellipse in chart.
after that we see aligator lips and teeth breaks jaw and aligator awake in a downward trend
so we approch a bearish market and i show that with a Red Ellipse.
no one know how much this cycle last.
after this section i think aligator go to sleep again and after that awake upward.
please protect your capital and know about market cycles.
we could see new bottoms so we must manage our risk.
after that when diffrent conditions confirm uptrend we can buy again.
Remember:
Buy expensive but confident
!!!NOTE!!!
MY POSTS ARE NOT TRADING AND INVESTING ADVISE.
SO DO ON YOUR OWN OPINION AND CONSIDER MARKET RISKS.
Thank you all for reading this article hope that be useful for you.
share me your opinion in comment please.

Is 100k still in play? A rising wedge forms when the price’s movement consolidates between two sloping trend lines collectively displayed as a triangle.
These sloping lines are basically support and resistance levels that move in a converging pattern (the lower line is the support line, while the upper one is the resistance line).
The support and resistance lines both point towards an upwards direction. The support line usually has to be a bit steeper than the resistance one.
The lines are constructed by connecting two or more separate highs and lows.
Bearish cross on the KST.
Bearish cross on the Williams Alligator.
If the lower trendline doesn't hold 20k is likely the next support level.
If the lower trendline does hold 80k is the next higher high in the long-term trend, sell at the upward resistance.
It's hard to consider this an ascending triangle but I've drawn a dark blue line to represent the horizontal resistance, it's moderately crude

Is Bitcoin trading in a Giant Descending Triangle?On the RSI there appears to be a noticeable divergence, there's a series of higher lows forming an ascending triangle.
The price is displaying a series of lower highs forming a descending triangle.
A bullish divergence or bearish divergence?
A bullish divergence occurs when prices fall to a new low while an oscillator fails to reach a new low. This situation demonstrates that bears are losing power, and that bulls are ready to control the market again—often a bullish divergence marks the end of a downtrend.
Bearish divergences signify potential downtrends when prices rally to a new high while the oscillator refuses to reach a new peak. In this situation, bulls are losing their grip on the market, prices are rising only as a result of inertia, and the bears are ready to take control again.
On the KST there has been a bearish cross on a 1-year chart. In this 5-year chart, it appears as though a bearish cross is on the verge of occurring near term on the Williams alligator.
It's always possible this pattern plays out as a Giant Bullish Flag, expect to see a re-test of the baseline of support & possibly a fake-out to the downside before breaching the horizontal resistance and re-testing ATH's.
