Calibrating Trading Indicators for Different MarketsCalibrating Trading Indicators for Different Markets: A Beginner's Guide
(Simple Steps to Adjust RSI , MACD , and Other Tools for Better Results)
Key Idea : Just like you'd tune a guitar differently for rock vs. classical music, trading tools like RSI or MACD need adjustments depending on what you're trading (stocks, crypto, forex) and how it moves. This guide shows you how to tweak these tools using price swings (pivot points) to make them work better for your specific asset.
---
Why "One Size Fits All" Doesn't Work
Most traders use default settings for indicators (like RSI's 14-day period). But these defaults were created for "average " markets. Real markets aren't average!
Example:
- Crypto ( CME:BTC1! ) : Super volatile → Needs faster, more sensitive indicators.
- Blue-Chip Stocks ( NASDAQ:AAPL ) : Less wild swings → Needs slower, smoother indicators.
If you use the same RSI settings for both, you'll get bad signals. Calibration fixes this.
---
The Pivot Point Method for Calibration
One effective approach to calibration is measuring the natural rhythm of price swings between high and low points. Here's how to do it step by step:
Step 1: Find Pivot Points on Your Chart
Pivot points are like "price turning points." Use TradingView's ZigZag indicator (or draw them manually) to spot these swings.
How to Add ZigZag on TradingView :
1. Open your chart.
2. Click "Indicators" → Search " ZigZag " → Select it.
3. Adjust settings (defaults work fine for starters).
The ZigZag will draw lines between significant highs (peaks) and lows (valleys).
---
Step 2: Measure the "Rhythm" of the Market
Count the bars (candles) between pivot points to find the market's natural cycle.
Example :
- If Bitcoin swings from peak to peak every 14 bars on average, its "cycle" is 14 bars.
- If Apple does this every 16 bars, its cycle is 16 bars.
In the picture above, we used the Williams Fractal to identify pivots.
Formula for Indicator Settings :
- RSI Period = Half the average cycle → If cycle = 16 bars → RSI = 8 days.
- MACD Settings : Fast EMA = ¼ cycle, Slow EMA = ½ cycle → Cycle = 16 → Fast EMA = 4, Slow EMA = 8
---
Step 3: Test Your Calibrated Indicators
Backtest on TradingView :
1. Add your indicator (e.g., RSI) with the new settings.
2. Use the Strategy Tester (click "Add to Chart" → " RSI Strategy ") to see if signals improve.
Look For :
- Fewer false signals (e.g., RSI saying "oversold" too early).
- Clearer trends (MACD crossovers matching price moves).
---
Calibrating Popular Indicators (Simple Rules)
1. RSI (Relative Strength Index)
- Default : 14 days.
- Calibrated : Half the average cycle length.
- Example : Cycle = 16 bars → RSI = 8 days.
Why It Works : Shorter RSI reacts faster to volatile markets (like crypto).
2. MACD
- Default : 12, 26, 9.
- Calibrated :
- Fast EMA = ¼ of cycle.
- Slow EMA = ½ of cycle.
- Signal Line = ⅙ of cycle.
- Example : Cycle = 20 → Fast = 5, Slow = 10, Signal = 3.
Why It Works : Matches the asset's natural momentum shifts.
3. Williams %R
- Default : 14 days.
- Calibrated : Same as RSI (half the cycle).
---
How to Avoid Common Mistakes
Mistake 1 : Overfitting (Making It Too Perfect for the Past)
- Problem : If you calibrate too precisely to old data, it might fail in the future.
- Fix : Test on 2 types of data:
1. Training Data : First 70% of your chart (to calibrate).
2. Testing Data : Last 30% (to check if it still works).
Mistake 2 : Ignoring Market Changes
- Problem : What works today might not work next month.
- Fix : Recheck your settings every 3 months or after big news (e.g., Fed rate hikes).
---
Free Tools to Help (No Coding Needed)
1. TradingView's "Auto-Detect Cycle" Scripts
Search for indicators like "Cycle", "RSI Adaptive" or " Rainbow Adaptive RSI " in TradingView's public library. These automatically calculate cycle lengths (Not tested).
2. Adaptive MACD/RSI Indicators
Try pre-built adaptive indicators like:
- Adaptive MACD : Adjusts itself based on volatility.
- Dynamic Pivot : Uses pivots to set stop-loss and take-profit levels.
---
Building a Simple Pivot Calibration System
Basic ZigZag Calibrator Method :
1. Add ZigZag to your chart.
2. Manually count the bars between 5 recent swings.
3. Calculate the average → Divide by 2 → Use that number for your RSI/MACD.
Example :
- Swings: 12, 14, 16, 10, 8 bars → Average = 12.
- Calibrated RSI = 6 days.
---
Why This Works (Without the Math)
Markets move in waves. By matching your indicator's speed to the wave length, you "surf" the trend instead of fighting it. Research shows adaptive methods like this beat default settings.
The Science Behind It
When you calibrate to an instrument's natural rhythm:
- Oscillators (RSI, %R) catch extremes at the right time
- Trend indicators (MACD) signal changes faster
- Volatility bands (Bollinger Bands) expand and contract appropriately
---
A Step Further: Multi-Timeframe Calibration
For even better results, calibrate across timeframes:
1. Calculate cycles on daily charts for swing trading
2. Calculate cycles on 4-hour charts for day trading
3. Use both calibrated indicators together for confirmation
---
Final Tips for Beginners
1. Start Small : Calibrate one indicator (like RSI) first.
2. Use Free Tools : TradingView has thousands of free scripts to automate calculations.
3. Keep Records : Document what settings work for which assets.
4. Be Patient : Finding the right calibration takes time, but the results are worth it.
Calibration isn't about being perfect—it's about making your tools work better for specific markets . Happy trading!
Williamsfractals

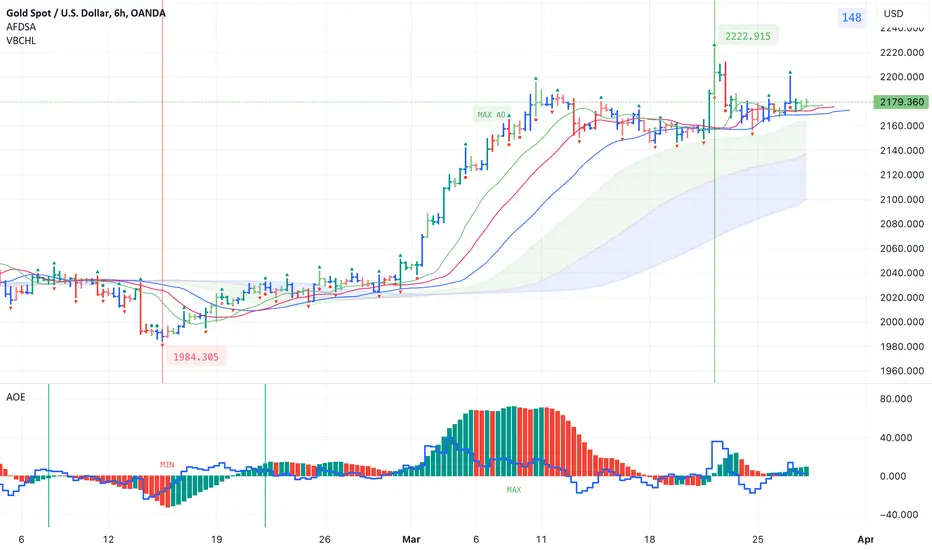
Indicators for trading using Bill Williams' Profitunity strategyI published 3 indicators for trading using Bill Williams' Profitunity strategy. For each indicator, I have added a visual and detailed description in English and Russian. In this post I will briefly describe these indicators and how I use them together.
AFDSA indicator (Alligator + Fractals + Divergent & Squat Bars + Signal Alerts)
Includes Williams Alligator, Williams Fractals, Divergent Bars, Market Facilitation Index, Highest and Lowest Bars, maximum or minimum peak of the Awesome Oscillator, and signal alerts based on Bill Williams' Profitunity strategy:
Bullish and Bearish Divergent Bar Signal + Squat Bar + Green Bar + Fake Bar + Awesome Oscillator Color Change + AO Divergence.
Crossing the green line (Lips) of an open Alligator.
Formation of a fractal.
Signal about the breakdown of the last upper or lower fractal.
Signal about the appearance of a new maximum or minimum peak of AO in the interval of 140 bars from the last bar.
I also added an Alligator display for the higher timeframe, for example, if the chart timeframe is 1 hour, then the higher timeframe will automatically be 4 hours, if the chart timeframe is 4 hours, then the higher timeframe will be 1 day, etc.
AOE Oscillator (Awesome Oscillator + Bars count lines + EMA Line)
Includes the Awesome Oscillator with two vertical lines at a distance of 100 and 140 bars from the last bar to determine the third Elliott wave by the maximum peak of AO in the interval from 100 to 140 bars according to Bill Williams' Profitunity strategy. Additionally, a faster EMA line is displayed.
I also added display of the AO line for the lower timeframe instead of the EMA line if the Moving Average Line values (method, length and source) are equal to the Awesome Oscillator values in the indicator settings. For example, if the chart timeframe is 1 day, then the lower timeframe will automatically be 4 hours, if the chart timeframe is 4 hours, then the lower timeframe will be 1 hour, etc.
VBCHL indicator (Visible bars count on chart + highest/lowest bars, max/min AO)
The indicator displays the number of visible bars on the screen, including the prices of the highest and lowest bars, the maximum or minimum value of the Awesome Oscillator. The values change dynamically when scrolling or changing the scale of the chart, but with a delay of several seconds, so this feature is included in a separate indicator so as not to slow down the work of other indicators.
Indicator settings
In the AFDSA indicator I use the following settings:
By default, the Squat Bar is colored blue, and all other bars are colored to match the Awesome Oscillator color, except for the Fake bars, which are colored with a lighter AO color. But I also enable the display of "Green" Divergent bars in the "Green Bars > Show" field.
I enable the display of Alligator for higher timeframes in the "Alligator for higher timeframe > Enable" field.
In the indicator style settings, I disable the display of the highest and lowest bars, maximum and minimum AO peak labels, because these labels are also displayed by the VBCHL indicator depending on the number of visible bars in the chart window.
Only after opening a position, I enable all additional alerts in the “Enable all additional alerts” field (after changing this field, you need to re-create the alert for the current chart): crossing the green line of an open Alligator, formation of a fractal, appearance of a new maximum or minimum AO peak.
In the settings of the AOE oscillator, I enable the display of the AO line for the lower timeframe instead of the EMA line, setting the same values in the fields for the Moving Average Line (method, length and source) and Awesome Oscillator.
In the VBCHL indicator settings, I only enable the simple display text style for labels in the "Simple display text style for labels" field.
As a result, when analyzing the current chart, I immediately see all the signals on the chart, the location of the bars relative to the Alligator on the higher timeframe and changes in the Awesome Oscillator on the lower timeframe. And thanks to the VBCHL indicator, I quickly select the desired timeframe for analyzing the 5-wave Elliott impulse, focusing on the interval of 140 bars, and immediately see whether there is divergence between the maximum AO peak and the following lower AO peak in this interval.
Small Squeeze: Breakout Notice the vertical line: spx finds a bullish closing violation with matching volume...the bar closes bullish with huge volume support (strike bullish and ride the gap?).

$PEPE is range-boundCrypto prices continue to bleed across my watchlist...frog is trying to establish bottom. Price is in the bottom of the rectangle.
Looks like it will range here for a while or dump further. Needs volume to move imo.
FWB:PEPE is range-bound, poor volume; 1h.
Set fractal alerts,
Bearish breakout: 0.00000177
Bullish breakout: 0.00000214

