WLDUSDT at a Critical Level: Valid Breakout or Just a Fakeout?WLDUSDT is catching traders' attention after successfully breaking above a long-term descending trendline that has capped price since late 2024. But the big question now is — is this the start of a real trend reversal, or just a classic bull trap fakeout?
---
📌 Detailed Technical Breakdown
🟡 1. Major Trendline Breakout
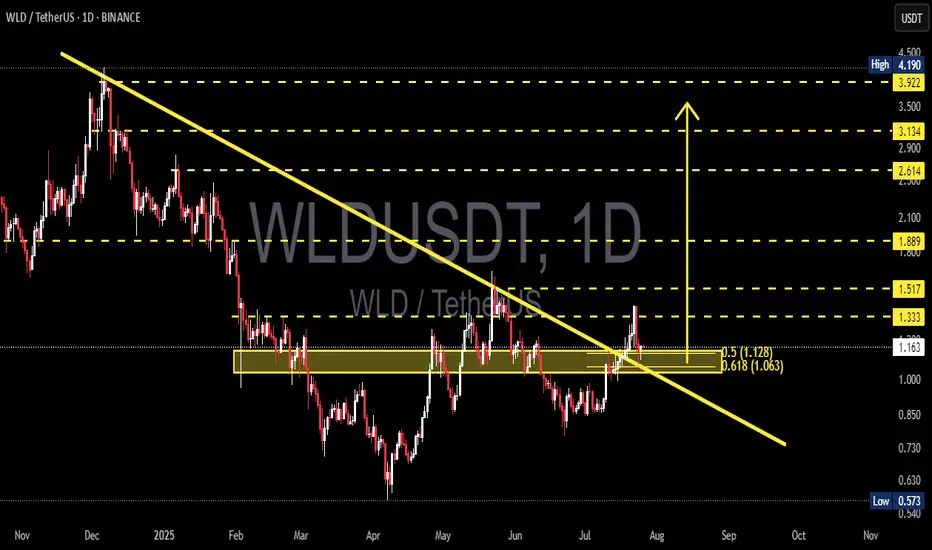
The yellow trendline drawn from November 2024 has finally been broken to the upside.
This is a potential signal that bearish momentum is weakening significantly.
🟨 2. Key Demand Zone (Horizontal Yellow Box)
The area between 1.063 – 1.128 USDT has acted as a strong demand/support zone since March 2025.
Price is currently retesting this zone, which makes it a decisive level for validating the breakout.
🔁 3. Fibonacci Retracement Levels
Price is retesting the 0.5 (1.128) and 0.618 (1.063) retracement levels.
These fib levels could serve as a launchpad for a bullish continuation if held.
🧱 4. Layered Resistance Structure
If the bounce holds, WLD could target:
🔹 1.333 – Psychological resistance
🔹 1.517 – Previous structural resistance
🔹 1.889 – Key horizontal level
🔹 2.614 – 3.922 – Medium-term targets based on historical structure and fib extension
---
🟢 Bullish Scenario (Increasing Probability)
Price holds above the 1.063 – 1.128 zone and confirms a rebound.
A daily close above 1.333 would further confirm bullish continuation.
Formation of higher highs and higher lows would validate trend reversal.
🔴 Bearish Scenario (If Breakdown Occurs)
Price loses support at 1.063, invalidating the breakout and retest.
Possible targets to the downside:
Minor support: 0.85 – 0.75
Major support: 0.573 (Previous macro low)
---
📈 Interesting Chart Pattern
Potential formation of an Inverse Head and Shoulders, with the neckline around 1.333.
A confirmed breakout above the neckline could trigger a strong bullish impulse.
---
🎯 Conclusion
WLD is now in a golden zone that will decide its medium-to-long-term trend.
The 1.063 – 1.128 area is make-or-break. If bulls defend this zone, it confirms trend reversal. If it fails, WLD could slide back into a distribution range.
📌 Traders who wait for confirmation at this stage may have the strategic edge.
#WLDUSDT #WLDAnalysis #CryptoBreakout #TrendlineBreak #TechnicalAnalysis #InverseHeadAndShoulders #FibonacciSupport #AltcoinSetup #CryptoTrading #CryptoUpdate
WLDUSD
#WLD/USDT Approaching Breakout After Long-Term Downtrend!#WLD
The price is moving within a descending channel on the 1-hour frame, adhering well to it, and is on its way to breaking strongly upwards and retesting it.
We have support from the lower boundary of the descending channel, this support is at 1.28.
We have a downtrend on the RSI indicator that is about to be broken and retested, supporting the upside.
There is a major support area in green at 1.26, which represents a strong basis for the upside.
Don't forget a simple thing: ease and capital.
When you reach the first target, save some money and then change your stop-loss order to an entry order.
For inquiries, please leave a comment.
We have a trend to hold above the 100 Moving Average.
Entry price: 1.30
First target: 1.34
Second target: 1.38
Third target: 1.43
Don't forget a simple thing: ease and capital.
When you reach your first target, save some money and then change your stop-loss order to an entry order.
For inquiries, please leave a comment.
Thank you.

#WLD/USDT Approaching Breakout After Long-Term Downtrend!#WLD
The price is moving within a descending channel on the 1-hour frame, adhering well to it, and is on its way to breaking strongly upwards and retesting it.
We have support from the lower boundary of the descending channel, at 1.200.
We have a downtrend on the RSI indicator that is about to be broken and retested, supporting the upside.
There is a major support area in green at 1.170, which represents a strong basis for the upside.
Don't forget a simple thing: ease and capital.
When you reach the first target, save some money and then change your stop-loss order to an entry order.
For inquiries, please leave a comment.
We have a trend to hold above the 100 Moving Average.
Entry price: 1.250.
First target: 1.288.
Second target: 1.321.
Third target: 1.373.
Don't forget a simple thing: ease and capital.
When you reach your first target, save some money and then change your stop-loss order to an entry order.
For inquiries, please leave a comment.
Thank you.

WLDUSDT Approaching Breakout After Long-Term Downtrend!WLD is currently trading inside a descending channel on the 3-day chart. The price has recently shown strong bullish momentum and is approaching the upper boundary of the channel as well as a key resistance zone.
A breakout above this zone could lead to a significant bullish continuation. Volume has started to pick up, indicating increasing interest. If the price manages to flip the resistance into support, we could potentially see a rally towards the $5.00 - $10.00 zone.

#WLD/USDT Builds Pressure Inside Long-Term Range#WLD
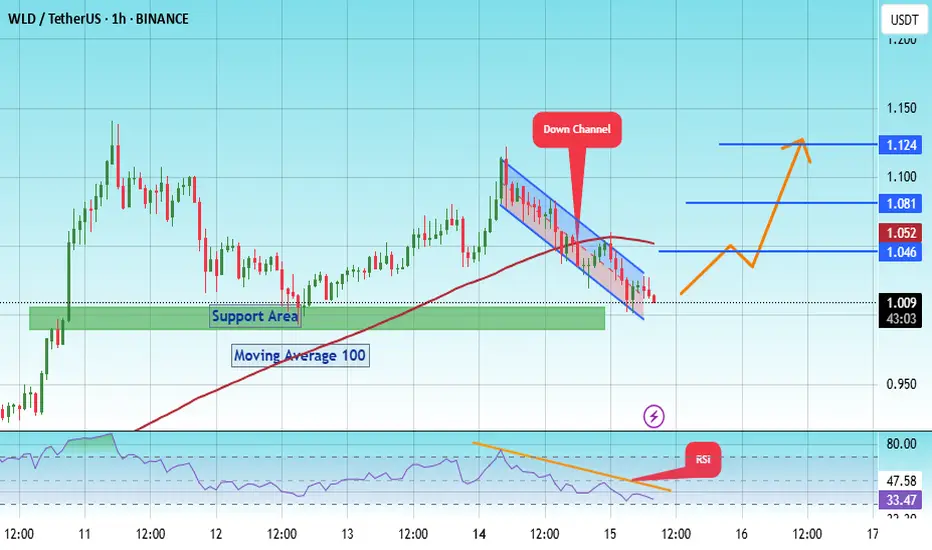
The price is moving within a descending channel on the 1-hour frame, adhering well to it, and is on its way to breaking it strongly upwards and retesting it.
We have a bounce from the lower boundary of the descending channel. This support is at 1.00.
We have a downtrend on the RSI indicator that is about to break and retest, supporting the upside.
There is a major support area in green at 0.990, which represents a strong basis for the upside.
Don't forget a simple thing: ease and capital.
When you reach the first target, save some money and then change your stop-loss order to an entry order.
For inquiries, please leave a comment.
We have a trend to hold above the 100 Moving Average.
Entry price: 1.01
First target: 1.04
Second target: 1.08
Third target: 1.12
Don't forget a simple thing: ease and capital.
When you reach the first target, save some money and then change your stop-loss order to an entry order.
For inquiries, please leave a comment.
Thank you.
#WLD/USDT Builds Pressure Inside Long-Term Range#WLD
The price is moving within a descending channel on the 1-hour frame and is expected to break and continue upward.
We have a trend to stabilize above the 100 moving average once again.
We have a downtrend on the RSI indicator that supports the upward break.
We have a support area at the lower boundary of the channel at 0.992, acting as strong support from which the price can rebound.
We have a major support area in green that pushed the price upward at 0.930.
Entry price: 1.00
First target: 1.036
Second target: 1.073
Third target: 1.111
To manage risk, don't forget stop loss and capital management.
When you reach the first target, save some profits and then change your stop order to an entry order.
For inquiries, please comment.
Thank you.

#WLD/USDT#WLD
The price is moving within a descending channel on the 1-hour frame, adhering well to it, and is heading for a strong breakout and retest.
We are experiencing a rebound from the lower boundary of the descending channel, which is support at 1.08.
We are experiencing a downtrend on the RSI indicator, which is about to break and retest, supporting the upward trend.
We are looking for stability above the 100 moving average.
Entry price: 1.143
First target: 1.190
Second target: 1.236
Third target: 1.300

#WLD/USDT , How Long Will It Take For A $ 1.14 Target?#WLD
The price is moving within a descending channel on the 15-minute frame and is expected to break and continue upward.
We have a trend to stabilize above the 100 Moving Average once again.
We have a downtrend on the RSI indicator that supports the upward break.
We have a support area at the lower boundary of the channel at 1.06, acting as strong support from which the price can rebound.
We have a major support area in green that pushed the price higher at 1.05.
Entry price: 1.08
First target: 1.09
Second target: 1.117
Third target: 1.14
To manage risk, don't forget stop loss and capital management.
When you reach the first target, save some profits and then change the stop order to an entry order.
For inquiries, please comment.
Thank you.

#WLD/USDT#WLD
The price is moving within a descending channel on the 1-hour frame, adhering well to it, and is heading towards a strong breakout and retest.
We are experiencing a rebound from the lower boundary of the descending channel, which is support at 0.950.
We are experiencing a downtrend on the RSI indicator that is about to be broken and retested, supporting the upward trend.
We are looking for stability above the 100 moving average.
Entry price: 1.20
First target: 1.04
Second target: 1.07
Third target: 1.10

#WLD/USDT#WLD
The price is moving within a descending channel on the 1-hour frame and is expected to break and continue upward.
We have a trend to stabilize above the 100 moving average once again.
We have a downtrend on the RSI indicator that supports the upward move with a breakout.
We have a support area at the lower limit of the channel at 0.900, acting as strong support from which the price can rebound.
Entry price: 0.913
First target: 0.944
Second target: 0.971
Third target: 1.004

Worldcoin (WLD/USDT) Breakout Potential – Bullish Setup in PlayThis chart illustrates a potential breakout setup for Worldcoin (WLD) against USDT on the 2-day timeframe (2D), published on June 25, 2025. Key technical insights are as follows:
🔍 Technical Structure:
Strong support zone (accumulation area): Formed in the range of $0.9300 – $0.5728 (highlighted in yellow box). Price is currently consolidating within this zone, which has been tested multiple times and held, indicating a potential bottom formation.
Descending trendline: Has been broken with a bullish candle, suggesting an early signal of a potential trend reversal from bearish to bullish.
Key resistance levels (potential targets):
$1.4824 – initial breakout validation level
$2.4242 – mid-term resistance
$3.8198 – psychological and previous distribution zone
$6.0189 – major resistance before ATH
$10.7997 – $11.9650 – All Time High zone
📈 Projected Price Movement:
Bullish scenario depicted:
1. A possible retest of the breakout zone around $0.93
2. Gradual price rally toward $1.48 and $2.42 as initial targets
3. If momentum and volume support the move, a further rally toward $3.81 and $6.01 is possible
4. Ultimate long-term target lies near previous highs at $10.79–$11.96
💡 Additional Notes:
This setup is still unconfirmed and requires further breakout confirmation and supporting volume for reliability.
Trade remains high risk, as price is still near the final support zone before potential breakdown.

#WLD/USDT#WLD
The price is moving within a descending channel on the 1-hour frame and is expected to break and continue upward.
We have a trend to stabilize above the 100 moving average once again.
We have a downtrend on the RSI indicator that supports the upward move with a breakout.
We have a support area at the lower limit of the channel at 0.825, acting as strong support from which the price can rebound.
Entry price: 0.846
First target: 0.871
Second target: 0.898
Third target: 0.926

WLD Sparks Panic Here’s Why the Worst Might Still Be AheadYello Paradisers, have you seen how #WLDUSDT just collapsed out of nowhere? After weeks of slow, grinding price action inside a dangerous ascending broadening wedge, #Worldcoin has finally snapped, and this breakdown could be the start of something much bigger.
💎We had this move on the radar well in advance, as the structure continued maturing. The wedge was perfectly defined by rising support and resistance levels, and price got smacked down with precision from the top of that range. When #WLD printed a clear Change of Character (CHOCH), breaking beneath the wedge’s lower boundary, it wasn’t noise it was a direct signal of weakening momentum and a confirmed shift in market structure toward the downside.
💎What followed was a textbook retest of the breakdown level, which now aligns with a powerful supply and resistance zone between $1.069 and $1.125. As long as the price remains trapped below this zone, the bearish momentum stays in full control. Right now, the next area we’re eyeing is $0.847, where price might see a temporary pause. But make no mistake if the selling continues, #WLD is likely heading toward $0.580, and in the most extended bearish case, we’re watching the major support base at $0.347.
💎Any invalidation of this bearish setup would require a full breakout above $1.623, but with the current market structure, that kind of reversal seems extremely unlikely without a strong macro or fundamental catalyst flipping the narrative.
Trade smart, Paradisers. This setup will reward only the disciplined.
MyCryptoParadise
iFeel the success🌴

WLDUSDT 3D AnalysisWLD ~ 3D Analysis
#WLD Buy gradually from here if you still have confidence in this coin with a short term target of at least 15%+ from here.

where to buy ?Hello friends
Given the good growth of this currency, we are witnessing a price correction and this is an opportunity to buy in the price correction in the support areas and move with it to the specified goals, of course with capital and risk management.
*Trade safely with us*

#WLD/USDT#WLD
The price is moving within a descending channel on the 1-hour frame and is expected to break and continue upward.
We have a trend to stabilize above the 100 moving average once again.
We have a downtrend on the RSI indicator that supports the upward move with a breakout.
We have a support area at the lower limit of the channel at 0.410, acting as strong support from which the price can rebound.
Entry price: 0.500
First target: 1.568
Second target: 1.691
Third target: 1.818

#WLD/USDT#WLD
The price is moving within a descending channel on the 1-hour frame and is expected to break and continue upward.
We have a trend to stabilize above the 100 moving average once again.
We have a downtrend on the RSI indicator that supports the upward move with a breakout.
We have a support area at the lower boundary of the channel at 1.15, which acts as strong support from which the price can rebound.
Entry price: 1.16
First target: 1.19
Second target: 1.23
Third target: 1.28

#WLD/USDT#WLD
The price is moving within a descending channel on the 1-hour frame, adhering well to it, and is heading for a strong breakout and retest.
We are experiencing a rebound from the lower boundary of the descending channel, which is support at 1.18.
We are experiencing a downtrend on the RSI indicator that is about to be broken and retested, supporting the upward trend.
We are looking for stability above the 100 moving average.
Entry price: 1.26
First target: 1.316
Second target: 1.36
Third target: 1.408

#WLD/USDT#WLD
The price is moving within a descending channel on the 1-hour frame, adhering well to it, and is heading for a strong breakout and retest.
We are experiencing a rebound from the lower boundary of the descending channel, which is support at 1.03.
We are experiencing a downtrend on the RSI indicator, which is about to break and retest, supporting the upward trend.
We are looking for stability above the 100 Moving Average.
Entry price: 1.12
First target: 1.15
Second target: 1.19
Third target: 1.250

#WLD/USDT#WLD
The price is moving within a descending channel on the 1-hour frame, adhering well to it, and is heading for a strong breakout and retest.
We are seeing a bounce from the lower boundary of the descending channel, which is support at 0.
We have a downtrend on the RSI indicator that is about to break and retest, supporting the upside.
We are looking for stability above the 100 moving average.
Entry price: 0.878
First target: 0.946
Second target: 0.984
Third target: 1.03

Worldcoin WLD price analysisSam Altman has officially launched the World ID project in the United States, a digital identity system based on iris scanning.
Users are scanned using the Orb device and receive a digital ID (World ID) and 14 #WLD tokens
Last time then the price of OKX:WLDUSDT has been actively growing , when more than 12 million people from 100+ countries "sold" their "scanned eye" for a reward in #Worldcoin
Do you believe that history will repeat itself and the price of #WLDUSD will rise, at least to $3.75?

#WLD/USDT#WLD
The price is moving within a descending channel on the 1-hour frame and is expected to continue upward.
We have a trend to stabilize above the 100 moving average once again.
We have a downtrend on the RSI indicator, which supports the upward move by breaking it upward.
We have a support area at the lower limit of the channel at 0.750.
Entry price: 0.0764
First target: 0.0782
Second target: 0.800
Third target: 0.829

#WLD/USDT#WLD
The price is moving within a descending channel on the 1-hour frame, adhering well to it, and is heading for a strong breakout and retest.
We are seeing a bounce from the lower boundary of the descending channel, which is support at 0.725.
We have a downtrend on the RSI indicator that is about to be broken and retested, supporting the upward trend.
We are looking for stability above the 100 moving average.
Entry price: 0.747
First target: 0.769
Second target: 0.788
Third target: 0.812
