WMT Daily TimeframeSNIPER STRATEGY (new version)
It works ALMOST ON ANY CHART.
It produces Weak, Medium and Strong signals based on consisting elements.
NOT ALL TARGETS CAN BE ACHIEVED, let's make that clear.
TARGETS OR ENTRY PRICES ARE STRONG SUPPORT AND RESISTANCE LEVELS.
ENTRY PRICE BLACK COLOR
TARGETS GREEN COLOR
STOP LOSS RED COLOR
DO NOT USE THIS STROTEGY FOR LEVERAGED TRADING.
It will not give you the whole wave like any other strategy out there but it will give you a huge part of the wave.
The BEST TIMEFRAMES for this strategy are Daily, Weekly and Monthly however it can work on any timeframe.
Consider those points and you will have a huge advantage in the market.
There is a lot more about this strategy.
It can predict possible target and also give you almost exact buy or sell time on the spot.
I am developing it even more so stay tuned and start to follow me for more signals and forecasts.
START BELIEVING AND GOOD LUCK
HADIMOZAYAN
WMT

WALMART Daily TimeframeSNIPER STRATEGY
This magical strategy works like a clock on almost any charts
Although I have to say it can’t predict pullbacks, so I do not suggest this strategy for leverage trading.
It will not give you the whole wave like any other strategy out there but it will give you huge part of the wave.
The best timeframe for this strategy is Daily, Weekly and Monthly however it can work any timeframe above three minutes.
Start believing in this strategy because it will reward believers with huge profit.
There is a lot more about this strategy.
It can predict and also it can give you almost exact buy or sell time on the spot.
I am developing it even more so stay tuned and start to follow me for more signals and forecasts.

wmt wave 5 setupwallmart recently put in a smaller degree wave 3, and just finished a wave 4 correction. it was a pretty deep wave 4, but it fits the picture nicely.
so long as the price doesn't violate the top of wave 1, we should see a nice move up to complete this final fifth wave.
wave 5 target = $156

Walmart To Dropping Quarterly Bonuses, To Increase Wages...Good, baaa... nevermind or just ugly??? So employee wages getting ready to increase so why isn't that good news for Walmart? In my opinion this minor employee benefit comes off the "backs", I say that sarcastically, of these "hardworking" multimillion dollar babies. So there is the ugly coming right from it's won company. Where employee wages should come as a morale boost and a potential push we see the babies selling off.
LIKE, FOLLOW, SHARE.
THIS IS NOT FINANCIAL ADVICE.

WMT - REMAINS A BUYLooking for WMT to continue to push higher into this wave 5.
Resistance: 148.60 and 157.20
PT for this leg up for me is 176-177.
Volume remains bullish as Friday selling failed to close below Thursday low and was less than the relative volume from the buyers on Thursday. Also, we got a nice wick up candle from Friday low that signals the bears are still relatively weak in comparison to the bulls.

deep esotericism $WMTif we are to look at a sizeable nine-figure gub contract for turning certain locations into FEMA camps for the unvaccinated, then we should expect the market to price in both the extra liquidity provided to the small-scale american business owned by the Walton family and the kiss of the state from said gub contract all together most rapidly, and with a 2.88 IV percentile at entry, who can think of a better setup to pay attention to for this fiscal quarter into the holidays!

$WMTWalmart’s earnings was spectacular. It reported an adjusted second-quarter profit of $1.78 a share, easily beating forecasts for $1.56, on sales of $141.05 billion, topping estimates for $136.88 billion. It offered full-year guidance of $6.20 to $6.35 a share, above the consensus for $6.02. Walmart said it’s taking share in groceries and that same-store sales rose every month during the quarter and yet it finished Tuesday, the day of the release, down slightly, and then fell 1.1% on Wednesday.
It closed the week at $151.45, roughly unchanged from where it had been before the release—and still below its November all-time high of $152.79.
When you look at the technical side of things, it looks like Walmart will eventually have its time soon.
Walmart’s in a nice clear uptrend on the weekly chart forming an ascending triangle with a double top.
Give this time with a to rest before it retests previous high but it’s very clear where this stock is heading.
I’m bullish.
- Factor Four

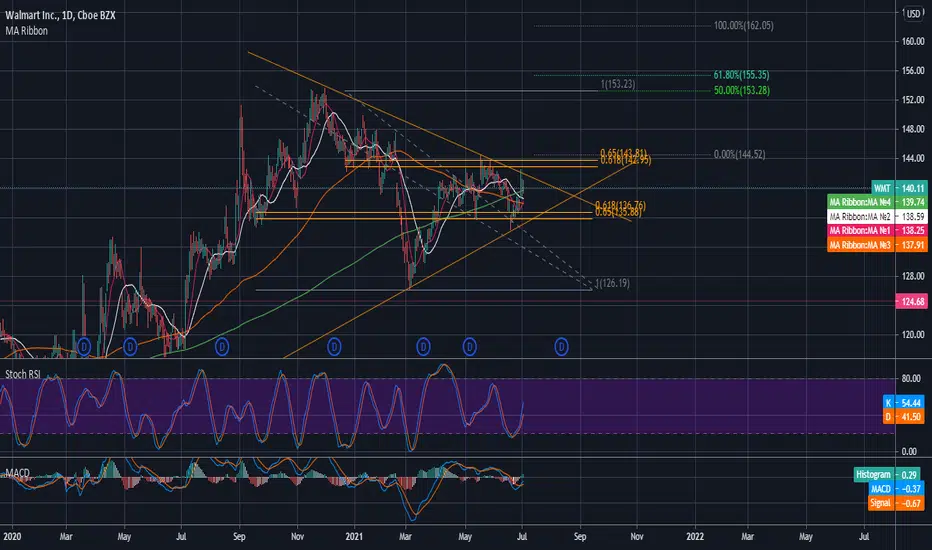
WMT shortEntry price: 151-153$
1st target price: 142.5-144$
2nd target price: 134-136$
RSI: broke 70 level, the asset is overbought
Stochastic: both lines above 80 level, the asset is overbought
Bollinger bands: the price is inside of Bollinger bands, approaching the upper band
Conclusions: The asset is overbought, approaching strong resistance level around the price 152, thus the trend reversal is very likely. The short position is recommended with the two potential targets.
Above analyse is just for an informative/educational use and should not be treated as a professional financial advice.

WMT BULLS!-looking for that first resistance break than the second break.
-depending how we open will dictate our entry
-there is a lot of bullish sentiment and we also bounced off the cloud

Bull Run SoonWe may see WMT pull back slightly to make up for the overbought RSI and it being right at resistance on the daily, however, once it gets to the end of the trend triangle there, if it breaks past resistance, we could see it rip upward. These are my thoughts.


Needs to Break $143If WMT breaks $143 we could see it enter an uptrend to the top of the trend channel

$WMT Chart IdeaThe breakout to the upside of desc. triangle is a healthy setup for a bullish trend channel. We will probably see some dancing around in here if we are lucky... that would mean more day plays.

$WMT Descending Triangle Breakout IdeasBeen watching for the past week, getting closer to a move now so I thought I'd publish a chart. Obviously a great stock, my leading theory is we will see a double top sending it back to support before the final leg up/breakout.


Sector early indicator? Retail sector - not much (but watch WMT)The general Retail Sector (as opposed to retailing of hardware home improvements by Home Depot and Lowes - studied in an earlier chart) - here represented by the VanEck Vectors Retail ETF (RTH, in green), and the mighty Walmart (WMT, in blue) - only occasionally (more often by WMT) acts as an early indicator against the broader market (here represented by the DJIA in gray, and the NASDAQ in black)... falling from peaks... WMT peaking on 29 Dec 1999, WMT falling from a peak in Jun 2007, WMT fading from a peak in Jan 2011, WMT in Jan 2015, WMT in Dec 2019.


Long | WMT | Minimum 100% Profit NYSE:WMT
Possible Scenario: LONG
Evidence: Price Action
TP1~ 144$,
Call options, Strike 144$, 05/14/21 Contract Price: 0.17$
Call options, Strike 145$, 05/14/21 Contract Price: 0.11$
Call options, Strike 146$, 05/14/21 Contract Price: 0.08$
* I'm not a financial advisor and it could be wrong 100%.


WMT - BOUNCE OF DEMAND ZONEWMT hit and bounced where we found a demand zone now should head higher to the trend line resistance
1) Break trend line resistance and make it to 145 for a gap fil
2) Reject the trend line resistance and bounce back down

WMT. Looking for high quality setups.This isn't super clean as of today, but it is setting up nicely to my eyes.
For the long term buy and holders I'd say go ahead and hop in.
For those of us cursed with the necessity of using stop losses, I'd like it to get a little closer to a lower level, or to show some more upward momentum before I can find a sensible risk ratio.
For the most part I am just training my daily trend trading muscles. Hopefully doing so with quality repetitions. I see there are no earnings for two weeks so massive volatility should be out of our mind.
Cons: The 50 crossed under the 200 to the downside in what people call the death cross. I see price action is behaving very bullishly in this recent rally. It looks to me like price bottomed following negative earnings expectations, and is now on its way back up in classic bull fashion. The 200 is still sloped upward, so one could also argue this is a terrific time to buy.
**EDIT**
The markings I did on the 4HR time frame, then published on the daily. So some of the lines won't match up perfectly. But, the markings were made on the 4HR chart, not the daily.

WMT - 4HR SUPPLY AND DEMANDWhenever the WMT hit my demand lines it went up while when it hit my supply lines it went down
