WMT 1Q Earning Target 2021WMT flopped its fourth quarter earnings in 2020 announcing -.74 cents a share. I expect a report with a lot more strength with integration of E-commerce into it online store models as well as less fear surrounding COVID-19 creating boost in sales. With only 1% of shares floating short, The slow grind up, which has been evident since the middle of March, is likely to continue without any strong resistance. Being the largest retailer in 2019 boasting 523 B in sales (NRF.com) doubling AMZN sales, this stock is a solid frontrunner as we move into a post pandemic economy. The NFP report on April 2nd of 916k (almost double the previous month report) compared to the 652k estimate is also encouraging as this could lead to more consumer spending. Still to come this month are MOM retail sale reports on the 15th and 16th which will could potentially back this thesis. Furthermore, with the market creating new highs quickly, there could be a tinge of uncertainty or heightened volatility as the rally hasn't really had much catalyst other than jobs, but with WMT's Beta of .47 (Zachs) this stock is relatively safe. With a debt to equity ratio at a 2 year low as well, this stock is definitely a strong buy in my opinion and I have set my post earnings target for 160 with this stock. This would be an all time high and about a 2% increase from current highs which is definitely within reason all things considered.
WMT
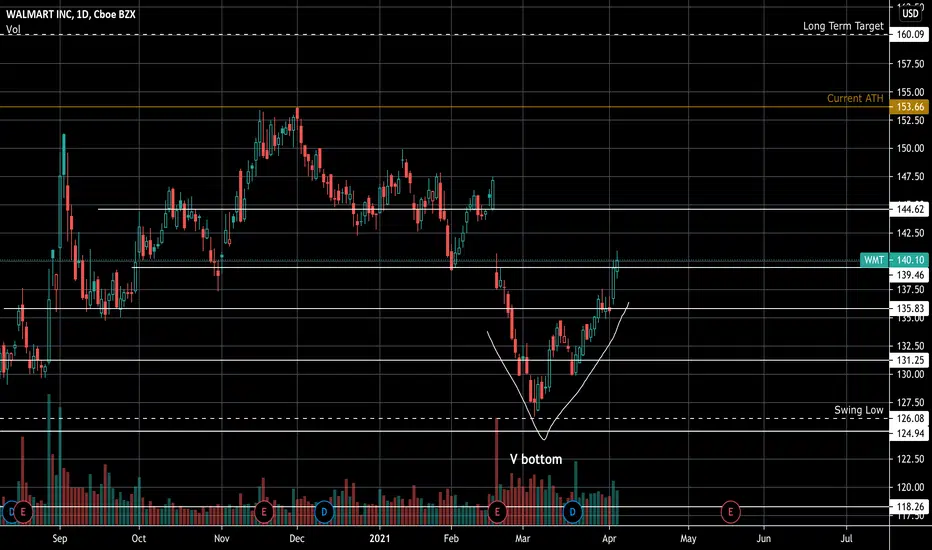
WMT nice V shape Recovery! WMT 1HR CHART...
WMT looking nice for a recovery play to retest ATH and a nice gap fill to the upside. In a steady up trend channel looking to retest that downtrend resistance line and a possible breakout to fill the gap, also currently in a bull pennant, look out for a gap up and retest for an entry if it does.


WMT Bullish PT $138This is not a recommendation to buy or sell.
Based on the chart I had from last week, WMT is following my prediction so far.
Nice dip today to filter through any weak hands and opportunistic. Based on the volume pick-up going into EOD, I'm seeing bullish signs towards the next fib level with a price target of$138.
Like and comment if you agree.

Green light on WMT: fibo and trend linesWallMart can be a good candidate for a long position. I suppose it will touch again 131.30$ before shooting up to 139.50$.
On the next trading day (Monday the 15th of March), I will try to buy some stocks @131.30$: Stochastic RSI is in overbought area and RSI is ha three falling highs. My target is 139.50$ in profit and 126.20$ in loss.
The expected Win/Loss ratio of this trade is 1.60.

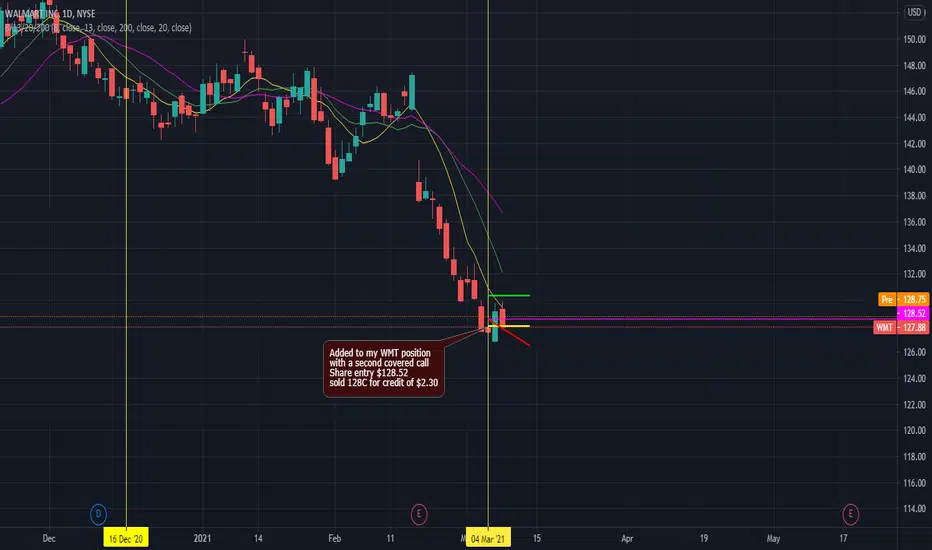
WMT Covered Call (Adding a second position)I am still holding my original WMT shares form my first covered call series of trades and hope to continue that trade soon with a new call. This trade is a second position of the same caliber. I bought 100 more share of WMT at $128.52, and sold a 128 call with expiration of 3/12/21 for a credit of $2.30 last week.
Break even for the trade is currently $126.46 and max profit in relation to entry of $130.82
WMT PT $138 by 3/15This is not a recommendation to buy or sell. Please do your own DD, this is an idea of what I think is going to happen.
WMT MACD on the daily just crossed the signal line. Volume has been increasing the past 2 weeks.
1 week Price Target = $138
2 week Price Target = $140+
Like and comment if you like this idea!

KSS - Strong online retail salesKohl's raised earnings expectations heading into Tuesday morning from previous quarter. Revenue expectations are $6 billion, March 2020 was $6.54. The options put call ratio is bullish at .30 . There are 2200 $ 57.50 calls sitting in March 19 open interest. Good luck this week!

Walmart 5% Gap Fill and a potential 31% upsideLong term this stock has plenty of room to make it back to the highs, which I believe it will by the end of 3rd quarter, and as it builds out its e-commerce and digital ad's business further, investors will see the true potential of Walmart as a platform and not only as retailer.

Weekly Outlook! 2/15 - 2/19Here we go over our last video to see how out setups ended up and we go over what setups we like for this coming week! Happy trading!

$WMT Bullish before earnings$WMT looks bullish headed into ER. $WMT has had some great previous reports and I expect a nice move prior to the announcement. The stock is in a beautiful bull flag and a break of this could send it back to the $150+ range.
Check out my profile for more ideas!

A potential reverse H&D pattern on $WLM stock before ERIt seems that WLM share price will likely rise right after the ERs. Even though it has been trending downward over the past few months, the situation may be reverse if it hits the neckline of the potential head and shoulders pattern pictured above.
Feel free to share your thoughts.


Walmart Inc. Accurate AnalysisThis stock is recovering from its shorts and we may see a bull back for a more bullish race. The pull back will confirm the buy for me. Buying now may be risky. As the pattern develops i will keep this idea updated, so like, comment, follow so you don't miss any update. Thank you.

Weekly Outlook! 2/1 - 2/5 Here i go over last weeks video as well as some stocks i'm looking at in the coming week!
NASDAQ:SBUX
NYSE:MCD
NYSE:WMT

TOP 5 STOCKS TO WATCH NEXT WEEK! $SHOP, $KO, $AMD, $WMT 1/30/21NASDAQ:AMD NYSE:SHOP NYSE:KO NYSE:V NYSE:WMT


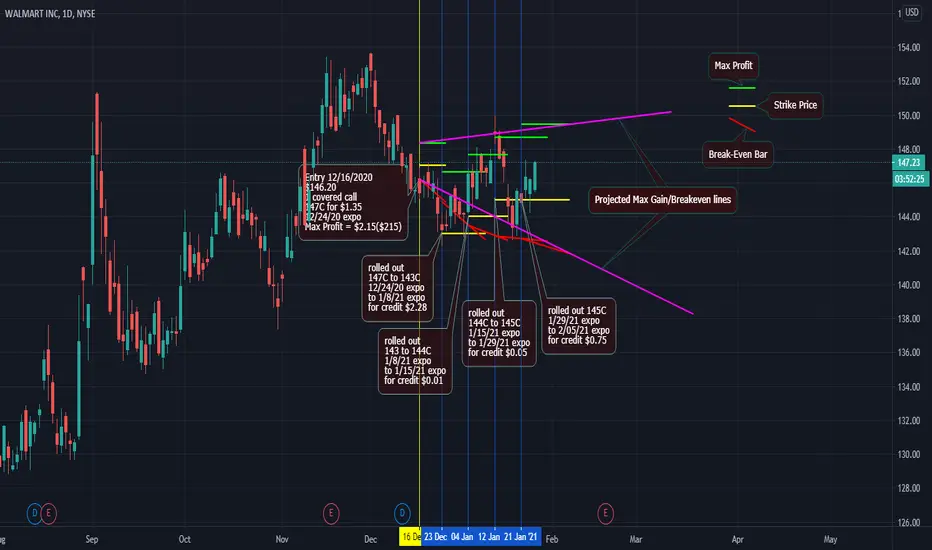
WMT Covered CallBeen holding this trade for a few weeks now. This is my first post related to options trading. I'm using the lines to show a visual of how selling a Call has helped create a range of profitability and risk management.
GREEN LINE - Max Profit - This green line is in relation to the original share price entry point, the Call strike price, plus any premium collected.
YELLOW LINE - Strike Price - I will adjust this often in an effort to continue to manage the risk, while maximizing profits. I try to stay under the stock price to maximize risk management.
RED LINE - Break-Even - This line is a proposed break-even price of the covered call. It is a linear sloped line, but is not accurate. This line give a rough estimation of what my break if is based on each expiration date.
PINK LINES - rough projections based on the last Max Profit and Break-Even potential. I'm using this to show what might potentially happen to the range, the longer I hold on to this trade.
wmr walmart trading idea based on supply n demand wmr walmart trading ideas supply n demand trading ideas


COST-2.525*WMT $WMT Walmart Inc. vs. $COST Costco Wholesale CorpQuantamental Tools for Proprietary and Retail Investors.
Statistical Arbitrage Opportunities Delivered to Your Inbox.
QuantChart. io
Long 1000 $COST
Short 2525 $WMT
Mean Reversion Time: 12 Trading Days
