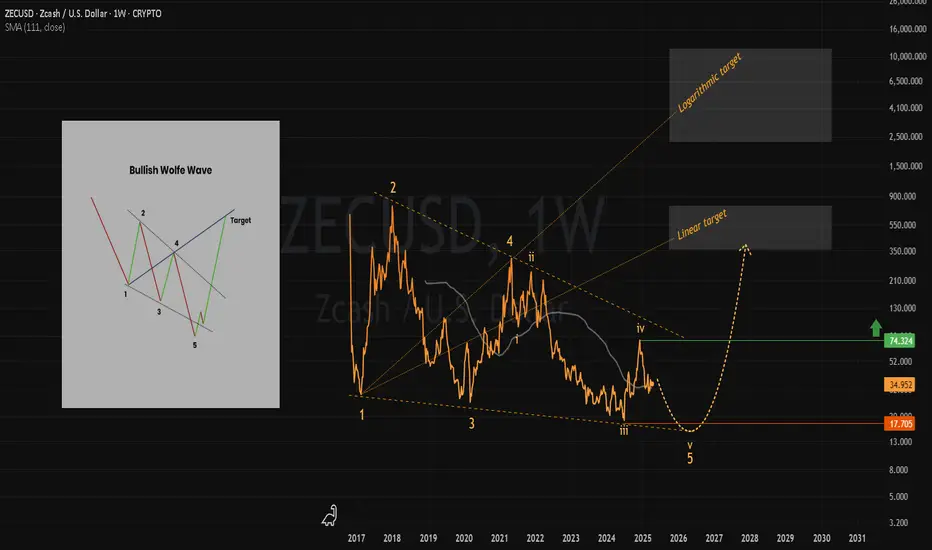
2290 Bullish Wolfe WaveA clean bullish Wolfe Wave setup is emerging, with price action completing the fifth wave just outside the channel – a typical trap zone before reversal.
Wave 5 shows early signs of a bullish reaction, suggesting a potential move toward the target line drawn from points (1) to (4).
Wolfe Wave
Hourly SAR moved above priceThis is an earlier signal compared to the standard bearish Wolfewave entry - which is price entering back below the 1-3 line.
Here, I placed a 1:3 risk/reward ratio.
Keep in mind that there could be stop hunters just above the bear risk tolerance.
Next in line in the fractal order to mark a swing high will be the 4 hour SAR.
Standard bearish Wolfewave Target is the 1-4 line.
Alternative Targets are the Magic Lines.
Patterns can fail
Do your own due diligence.

Bearish Wolfewave still in playThe head and shoulders measured move target already got made.
As long as the weekly SAR is above price, the lower targets are still in play.
The bearish Wolfewave target is the 1-4 line.
The magic lines are alternative targets.
Patterns can fail.
Do your own due diligence.

Bearish Wolfewave set upPrice has gone above the 1-3 line.
Short signal is when price enters back below the 1-3 line.
Target will be the 1-4 line.
Alternative targets are the magic lines.
An earlier entry is when the hourly SAR moves above price.
Earlier clues could be seen on the shorter timeframes.
Patterns can fail.
Do your own due diligence.

4 hour bearish Wolfewave morphing into a head and shouldersA neckline line break of a head and shoulders pattern is a more common sell signal.
The earlier sell signal is from the bearish Wolfewave pattern when price entered below the 1-3 line.
An even earlier sell signal was when the 4 hour SAR moved above price.
Earlier sell signals could be seen on the shorter timeframes.
Patterns can fail.
Do your own due diligence.

Bearish Wolfewave in playPrice has entered below the 1-3 line.
Target is the 1-4 line.
Other targets are the intersecting lines which we call the magic line.
As long as at least the 4 hour SAR is above price - those target are in play.
Pattens can fail.
Do your own due diligence.

Measured move target madePrice bounced near the target and has been confirmed by the 4 hour SAR.
The 4 hour SAR is currently on a bearish retrace relative to the daily SAR.
As long as the Daily SAR is above price, the bearish Wolfewave is still in play.
Price is anticipated to go lower than what the 4 hour SAR has established as support.
To see more details and for faster movement, we look to the shorter intervals.
Shorter interval price action could invalidate longer interval patterns.

Bearish Wolfewave target madeThe more confluence - the better.
I combine this pattern with the SAR signal.
The odds also seem better when there’s an rsi divergence.
Typical entry is when price goes back down the 1-3 line.
Ideal target is the 1-4 line.
To spot a potential Wolfewave forming, I usually look for a wave 4 that enters wave 1.
Then, I watch if that wave 4 breaches wave 2.
If not, the next move should be a break above the 1-3 line.
Another thing to look at is if the 2-4 line forms a rising wedge with the 1-3 line ( for a bearish Wolfewave).
Earlier entry for a bearish Wolfewave could be when the SAR of the pattern moves above price.
Another earlier entry is looking for signals on a shorter timeframe.
Patterns can fail.
Do your own due diligence.

Bearish Wolfewave target madeWhat I like about this pattern is the nice risk/reward it has.
The ideal pattern has a drastic and large move that quickly happen.
I added Fibonacci time that intersects the 1-4 target line for alternative targets for scaling out.
This chart has multiple SAR from different timeframes to track potential stop losses of other traders so that we can act accordingly.
Patterns can fail.
Do your own due diligence.

Bearish Wolfewave in playThis pattern is in play as long as at least the hourly SAR is above price.
The ideal target is the 1-4 line.
Scaling out at earlier targets increases the chances of taking a profit.
Patterns can fail.
Do your own due diligence.

Bearish Wolfewave 2-4 line breakThis could also be seen as a riding wedge break which is a sell signal.
Patterns usually shows up in fractals.
Ideal target is the 1-4 line.
However, patterns could fail.
Do your own due diligence.
Earlier targets are there for higher probability of taking a profit.

Bearish Wolfewave Set UpCurrently, Gold is still on an Uptrend and will continue to be at least while the monthly SAR is below price.
The bearish Wolfewave signal to sell/short is when price goes back down below the 1-3 line.
What event could push the price of gold down drastically?
Remember - patterns could fail.
Do your own due diligence and manage your risk.


Bitcoin reversal confirmed ?!Bitcoin reversal confirmed ?! 👀
I would like to present you some charts with important levels and relevant patterns.
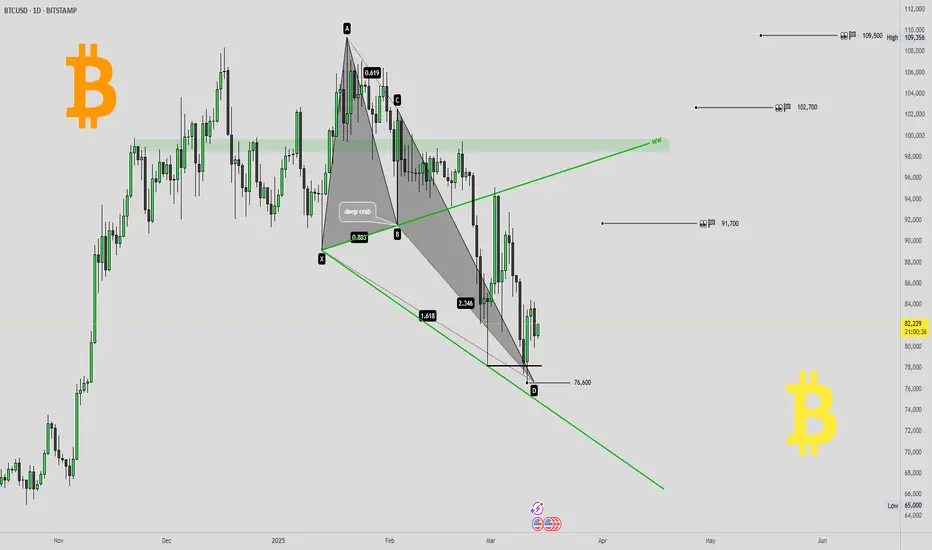
🖥daily-chart (BITSTAMP) and 💡everything important in the chart 👀
💥Here in the daily chart (BITSTAMP)
- a Deep-Crab harmonic with
- a WolveWave
and the daily-chart of the
🔥Daily MA200 re-test 👀
- gap fill
- support-line 2022 and 2024 TOPs
👉 BITCOIN roadmap/outlook (from 27th february 2024) 💡
🎯 If you like this idea, please leave me a 🚀 and follow for updates 🔥⏰
Furthermore, any criticism is welcome as well as any suggestions etc. - You're also very welcome to share this idea.
Have a nice evening & successful trading decisions 💪
M_a_d_d_e_n ✌
NOTE: The above information represents my idea and is not an investment/trading recommendation! Without any guarantee & exclusion of liability!
recap - " Bitcoin reversal confirmed ?! "BITCOIN reversal confirmed?! 👀
BITSTAMP:BTCUSD
How did this idea develop? 🤔
🥇Recap of the idea(s) from March 14, 2025 (see right 👀 under “Related Publications”)🎯
Hello ❤TradingView Community 👋
After the sell-off/correction ended on April 7, 2025' - Bitcoin reached an absolute low of $74434. This was followed by a nice rally and the complete fulfillment of the price targets from the idea of March 14, 2025 (push the play-button 😍).
Everything important is in the chart!
💡 This idea is closed at this point ✔
👉 All targets have been achieved 🎯💪
💥Follow me to stay up to date and be the first to receive these important updates/news & not miss anything! ⏰🔔
Furthermore, any criticism and suggestions etc. are welcome. - Feel free to share this idea.
Have a nice day & happy trading folks 🔥💪
M_a_d_d_e_n ✌
NOTE: The above information represents my idea and is not an investment/trading recommendation! No guarantee & exclusion of liability!
👉 BITCOIN roadmap/outlook (from 27th february 2024) 💡

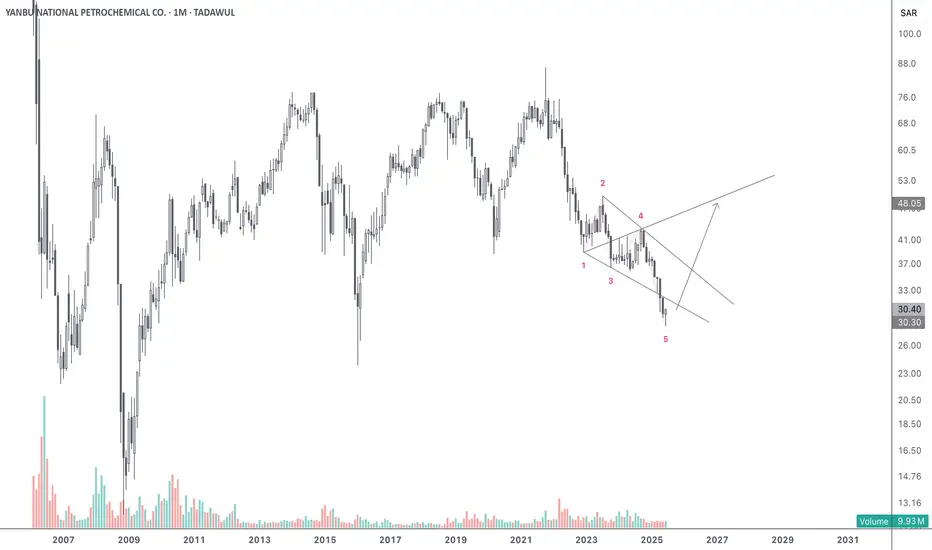
MMK. It completes the neck-shoulders, entry 30.00MMK. It completes the neck-shoulders pattern with an entry in the region of 30.0 with a target of 37.42.

gold 3265 long, stop of 3230, profit of 4.6% at 3416When gold reaches 3265, I open a long position with a stop of 3230, a profit of 4.6% at 3416

Landwolf ($WOLF) Surged 40% Breaking Out of a Falling Wedge The price of Landwolf ( NYSE:WOLF ) a coin created and deployed on the Ethereum chain saw a notable uptick of 40% breaking out of a falling wedge gearing foe a 100% legged up.
Since early March 2025, NYSE:WOLF has been constricted in a falling wedge pattern losing about 66% of market value, but present chart metric hints at a 100% price surge in the short term.
With the RSI at 80 we might experience a bit of a respite before picking liquidity up again. However, on a bearish tone, should NYSE:WOLF experience consolidatory move to as low as the base of the wedge or ceiling formed? it might resort to selling spree for NYSE:WOLF albeit the crypto industry is exercising bullish momentum with CRYPTOCAP:BTC reclaiming $94k pivot enroute to $100k.
As per data from CMC, NYSE:WOLF has experience an uptick of 65.69% in 24-hour trading volume. With these and many more metrics, NYSE:WOLF might be on the cusp of a breakout.
What is Landwolf 0x67?
Landwolf 0x67 (WOLF) is a memecoin that stands out with its unique character created by Matt Furie. Unlike many other cryptocurrencies, WOLF is deeply rooted in community values and transparency. The project boasts a total supply of one trillion coins, with the contract renounced and no taxes imposed on transactions.

nasdaq rallies to 32kgood morning,
i don’t usually post publicly, especially not about the stock market, but today feels like the right moment. i wanted to share my updated outlook for the nasdaq over the next year or so.
this was originally a member-only idea i shared back in september. you can check out the original post here:
---
the whole idea was based on a leading diagonal pattern, followed by a sharp wave 2 that resets sentiment and shakes out early optimism. this kind of move tends to scare most people out before the real run begins. from there, the setup calls for a parabolic wave 3 that carries us all the way to the grand cycle wave 5 target, around 32k (chart attached)
👇
---
the reason behind this move is actually pretty straightforward... a short squeeze into the end of the cycle, a weakening dollar, falling interest rates, looser tariff policy, and everyone’s favorite fuel: quantitative easing. while rates haven’t fallen yet and tariff policies are still tight, major shifts are on the horizon. i believe those shifts will trigger a parabolic rally.
and there’s one more catalyst behind this push, the ai boom. i believe artificial general intelligence will be cracked before the year is over, and the market is already beginning to price that in, starting now.
🌙

bitcoin dips below 60kbitcoin dips below 60k, but we're unfazed.
i see this playing out as we move into the depths of winter,,,
this crypto winter ❄️
why would this happen, you ask?
the answer is simple: a stop-loss raid.
a sharp wave 4 designed to shake out weak hands.
distribution may have already started, hypothetically speaking, but it'll take the rest of the year to unfold.
think of it like the jan 2021 -> april 2021 vibe, only on a slightly higher degree and timeframe.
---
take note of the highlighted wave 2's and wave 4's on my chart.
what i'm illustrating is "the law of alternation," which states:
if wave 2 is flat, wave 4 will be sharp, and vice versa.
all the wave 2's in this cycle have been flats,
so by design, all of our wave 4's are set to be sharps.
this fits neatly into the larger cycle:
sharp retracements triggered by over-leveraged positions,
yet consistently bought up thanks to strong demand.
with each sharp retracement, however, the upward moves become smaller,
as momentum gradually fades.
---
w4 target: below 60k
w5 target: between 150k-200k (conservatively).
---
ps. i have recently shared a much more bullish idea via:

ZEC: The Binance Drama#Zcash withdrawals on the ZEC network have been suspended on Binance for weeks, raising concerns especially with also it being in their monitoring list.
Technically, ZEC remains weak below $74.4. A drop below $17.7 to a new ATL could come before a major bullish reversal.
NCC Ltd – Short-Term Technical Analysis (15-min chart)📊 NCC Ltd – Short-Term Technical Analysis
Chart Pattern: Wolfe Wave (Bearish Setup)
Chart time frame - 15-min chart
Current Price: ₹211.40
Critical Breakdown Level: ₹206.50
Target Price Zone: ₹198
Bias: Bearish short-term
🧠 Pattern Analysis: Wolfe Wave
Wolfe Wave (points 1–5) structure is clearly formed, indicating a potential trend reversal.
The break below the line connecting points 1–4 (support trendline) would confirm the pattern breakdown.
The expected move is toward the line connecting points 1–4 and extending through 5, which typically acts as the target line — marked near ₹198.
📉 Supporting Bearish Factors:
📉 Volume Divergence: Visible decline in volume while price moved higher from point 4 to point 5, indicating weak bullish momentum.
📊 Histogram Momentum AO Indicator: Clear bearish divergence visible; momentum weakening as price rises.
⬇️ Breakdown expected below ₹206.50 – this will likely trigger the bearish move toward ₹198.
🛑 Short-Term Trading View:
⚠️ Watch for a close below ₹206.50 – potential short swing.
🏁 Expecting to reach: ₹198 zone
📍 Above ₹213 or point 5’s high direction may change
⚠️ Disclaimer:
This analysis is intended for educational purposes only and does not constitute investment advice. Stock trading involves high risk, and past patterns or performance do not guarantee future results. Please consult your financial advisor before making any trading decisions.

Potential scenario for goldEntry only upon forming a Wolfe Wave, upon return from the sweet zone. Follow risk management.
