Drop to 350s in coming weekADBE needs to establish support near the breakout level before continuing higher.
It’s a bearish Wolfe wave with near term downside to at least 357
Wolfe Wave

two scenario both ends @ 25$ ,believe it or notplease see chart on daily time frame
we may have seen a head and shoulder pattern is underway to be completing or we may face with fifth wave of an impulsive wave to be complete.
green line breaking will specify which scenario will happen
if green line breaks stock will rise to 500-600 $ and then go to 25$
if green line holds ,head and shoulder completed and stock go to 25$
a wolfe wave is also seen between head-and-shoulder-like pattern which is indicating upward move is more probable.
targets of upward move is 123-161% inverse Fibonacci retracement of wave (iii)-(iv)
please share your comments

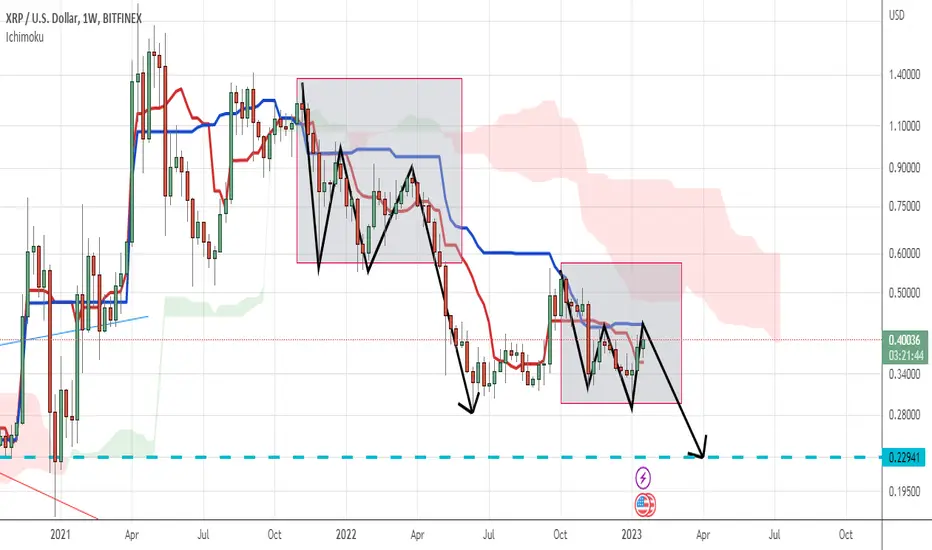
a nice repetition of a pattern made earlier for target of 0.23$a nice repetition is underway as in 2022 a pattern made as depicted on the chart which is now happening in the same way with target @0.23$
the underlying behavior of such pattern is how kijensen and tenkesen of ichimokou is arranging when candles are going toward them.
another reason for correctness of this pattern is a wolfe wave pattern made earlier and its target is 0.23
please share your comments if you like this
please see my previous analysis as below:
eurzar updatetwo wolfe wave pattern is seen and their targets are shown .
we are keeping eye on the pair for this bear move.
please like and comments .tnx

eurzar analysisa wolfe wave pattern along with a head and shoulder with a target @18.78 .please follow this pair and leave any comments or like if you are interested in.tnx

IciciBankIciciBank
A positive pattern
Above red line
Black line as sl
tgt is blue line
Chart is for study purpose only!!

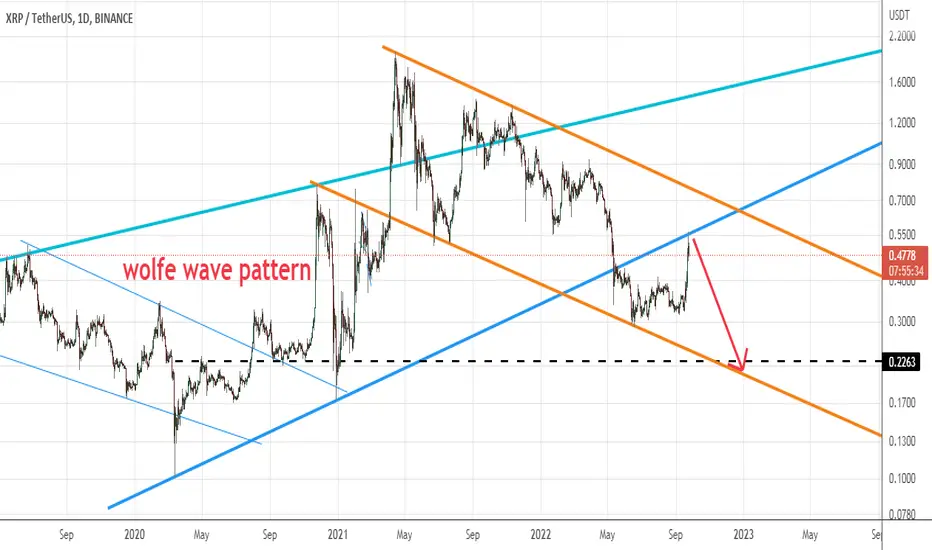
xrp update xrp made a nice pullback on lower channel of wolfe wave .target of wolfe wave is 0.23 .please see what will come out

XAUUSD VIEW ON 03.01.2023 Expecting SellWolfe wave Formation in XAUUSD. Expecting sell on after h4 candle close.

(Edited) EURUSD | Bullish SentimentS/R zone broken on monthly timeframe clears the way for bulls. This is a good long term play and good hedge against a devaluing US Dollar /strong Euro .
This is the exact same post as the related post but seems like the drawings didn't show up on the related post.

$USDCAD | Multi-Year Downtrend IncomingA a break and test of the long term S/R in blue indicates a long term bearish cycle in the USDCAD pair.

$EURUSD | Bullish Sentiment for the next several monthsS/R zone broken on monthly timeframe clears the way for bulls. This is a good long term play and good hedge against a devaluing US Dollar/strong Euro.

NaturalGas Long in makingNatural Gas making wolf wave buy pattern on daily as well as 4 Hour and 1 Hour chart.
Very good oppurtunity to buy with minimum risk and good reward.


HOW-TO: Wolfe Strategy [Trendoscope]Just made this short video to explain the concepts of Wolfe Strategy which I recently published.
Wolfe wave is popular concept among option traders. However, I have made some tweaks in this strategy to standard wolfe pattern trade rules.
Entry price based on breakout
No moving target - using flat target.
Entry is done based on risk reward
Not time bound
Intelligently decides whether to place stop order or limit order
Few possible future improvements
Make bidirectional trades possible
Better filters to chose long and short trades or when to trade
Lot can be improved on Wolfe scanner to identify more patterns
Exit strategy - can introduce optional trailing
Thanks for listening. Hope you enjoyed and learnt something from this :)

Tesla...Do dead cats ever bounce ?Looking for Tesla (TSLA) to produce a Wolfe Wave bottom in the mid to low $130's over the next several days.
(That said this is so oversold it may not get there.)
This achieved I have an early February 2023 target of $190.
Not investment advice ... do your own due diligence.
Momentum oscillators in the bottom pane should give an early warning.
Seasons Greetings Merry Xmas.
S.

EURJPY - BEARISH WOLFE WAVE #RRR 1:10 TP2 + #RRR 1:5 TP1HI BIG PLAYERS,
I'm back with a nice Wolfe Wave pattern on EURJPY.
This short setup give 2 trading chances of risk-return-ratio 1:10 (TP1) and 1:5 (TP2)
Best regards
NXT2017

wti updateTrader reaction to the long-term 50% level at $72.31 is likely to determine the direction of the January WTI crude oil market on Friday.
Bullish Scenario
A sustained move over $72.31 will indicate the presence of buyers. This could lead to a test of the minor top at $75.44. Taking out this level will change the minor trend to up and could trigger an acceleration into the short-term Fibonacci level at $78.72.
Bearish Scenario
A sustained move under $72.31 will signal the presence of sellers. This could trigger an acceleration to the downside with $63.73 the next major target.

Low Probability, High Reward BTC setupWith the FTX & Binance issues, plus crypto regulation likely coming next year, I don't have much faith in this setup. However I can't ignore the doubled up harmonics here, Bull Cypher and Bull Wolfe Wave. I'm prolly not a player until it establishes support above the $21k POC. Then we're looking for $29k>$37k>$60k targets.
Above 19k is probably good for a $21k POC test, but risky and doubtful right now. Lower TFs have some bearish setups.

spx is about to ath.read the title one more time 🔺
---
hello, my name's elo - and i make pretty wild predictions in the markets.
very few know who i am, and i prefer it to remain this way.
---
>i'm predicting that es1! will hit ath within the next few months.
>before drippin' back down to the covid lows.
---
this isn't financial advice or anything,
literally just art.
---
long 3850~3800
2% - stop
tp - 4817.00
✌

IBM ... Small bumps ahead ?Since mid-October IBM has produced a nearly 35% gain
This would appear to have traced out a bullish impulse wave (1-2-3-4-5)
It has also created a possible Wolfe Wave top with a short term downside target of $143-$144.
Additionally one could envision two harmonic patterns in development.
In the shorter term which a Gartley pattern supports the WW thesis.
The longer term a Bat pattern supports the 1/3 retracement scenario of the October move.
With an eye on the Fed's actions next week and broader equity markets I would be looking to sell IBM price strength with a tight stop should be breach recent highs.
I will follow up if I feel a short position is warranted.
As usual this is not investment advice, so do your own due diligence.
S.

fifth wave to downside or upside move depend on 83$ breakwe may see fifth wave to downside or upside move depending on 83$ break.
The good news for crude oil bulls is coming out of China. The potential for increased demand is there, but the country needs to do more to curb restrictions before it will show up in the economic data. Some analysts suggest some curbs will last until March. So demand may bottom, but we may not see a significant increase for six months.
The decision not to cut production by OPEC+ was no surprise. The group is probably waiting to see the impact of the Russian ban before they make a decision to cut or not cut at its Feb 1 meeting. There is still a lot of confusion as to how it is going to work and if it is going to work. If prices drop too far, OPEC+ will be there to prop them up.
On Friday, G7 nations and Australia agreed on a $60 per barrel price cap on Russian seaborne crude oil. According to Reuters, many analysts and OPEC ministers have said the price cap is confusing and probably inefficient as Moscow has been selling most of its oil to countries like China and India, which have refused to condemn the war in Ukraine.
The European Union will need to replace Russian crude with oil from the Middle East, West Africa and the United States, which should put a floor under oil prices at least in the near term.
Additionally, the end of the U.S. Strategic Petroleum Releases (SPR) is also providing support.
.

es 11-30 update 🗝good evening my peoples,
---
it was exactly 22 days ago when i gave you that 4130 level.
lot of bears ignored my post, and got squeezed out today for a significant loss.
i pour this aapl juice out for you, my dearest bear frens.
---
as of today, i'm starting to entertain the possibility of es seeing yet again, Another expansion.
sounds kinda wild i know, but that's what happens when everyone tries to short the market.
the guys who run this game just keep running it up ---> whilst taking all the hard earned bear money.
>once the last bear falls,
>they know it because they see it,
>and when they see it ,
>they drop the market.
---
4130 Could be the top, don't discount it. it is a significant algorithmic resistance which was programmed to get hit over a month ago.
here's the key though, if you've read this far:
watch how the market pulls back from 4130.
🗝does it come down in 3 waves? if so, expect higher prices.
🗝does it come down in 5 waves? if so, you caught the top.
---
og target = $4130
expansion target = $4225.25
---
