Wolfofwallstreet
USDCAD - longer than a lockdown!Here we can see a level little 4hr structure area where price has previously reacted.
If we add in this 4hr bearish trend we cams ee this previously broke out and we are now looking to test this level along with the 4hr structure.
Good opportunity to join this long trade.
Come and have a chat if you need any help
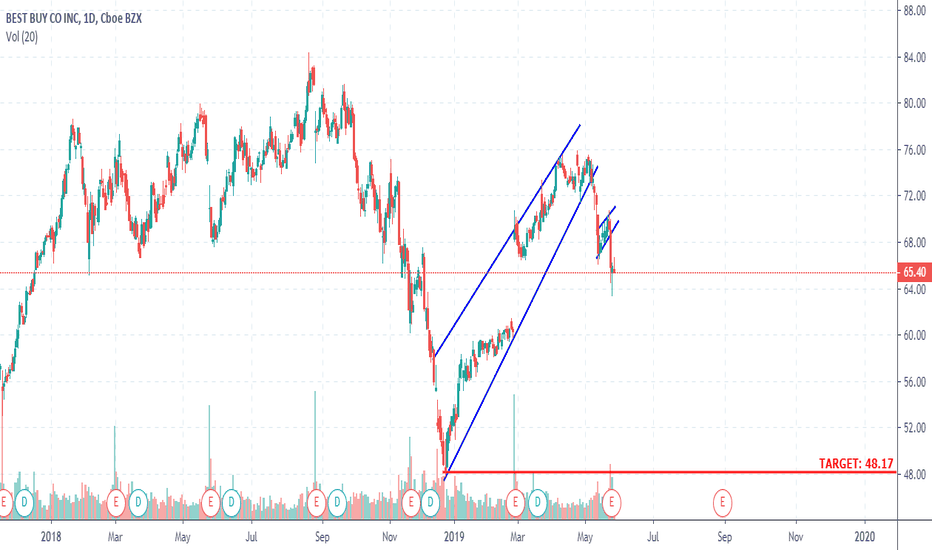
BEST BUY DAILY TIMEFRAME SHORTPrices dropped sharply before forming an ascending wedge, which topped out at the 76 price level. Now, price has already broken out of this corrective structure to the downside and is making a continuation move, with two opportunities to scale in already gone. But you can still jump in with proper risk management and target the bottom of the corrective structure, at the 48.17 price level. May the bears pounce on unsuspecting buyers lol!!
GBP/CAD SHORT 1-HOUR TIMEFRAME CONTINUATION (SCALING IN)Price formed another corrective structure in the form of a bear flag pattern after sellers struggled to hold ground. Now it has just broken to the downside and we are expecting further down movement. Things are a bit slow this week especially after the bank holidays yesterday. Risk management should be on point always. The technicals of this trade are;
Stop Loss: 1.70764
Target: 1.69140
NASPERS (NPN) DAILY TIMEFRAME SHORT The stock price is moving in a series of impulses and corrections , as it nears the ascending trendline. Possible targets are around the 271 330, which represents the bottom of the bear flag pattern. The price has already broken through the bear flag pattern and is moving closer to the target area.
CHF/SGD 4-HOUR TIMEFRAME LONGPrices on the CHF/SGD broke out of a interim downtrend on the daily chart, and we can anticipate further upwards movement. Price could find support on the 1.3650 if it forms a correctional structure in the form of a bear flag pattern, and then continue higher. Proper risk management is key especially when trading exotic currencies since there are huge margin requirements and they can be very volatile.
ELECTRONIC ARTS (EA) 4-HOUR TIMEFRAME LONGPrice is currently forming what looks like a bull flag pattern. If prices can break higher above $100, that should be a good indication of possible bullish momentum. Hwever, traders should exercise extreme caution and proper risk management as the last bull leg stopped abruptly, signalling the presence of sellers at every corner of this market!. Here is how i would enter this trade:
STOP LOSS: BELOW 90
ENTRY:100
TAKE PROFIT: 120
MTN DAILY TIMEFRAME LONGThis stock recently broke out of a descending trendline,and is currently retesting either the trendline itself or a support zone. I am of the opinion that t his stock will resume going up once enough buyers enter the market. Traders can possibly look to enter a long position at the 9 615 level, which rep [resents a support level.
BOSCH 4-HOUR TIMEFRAME SHORTPrices are moving in a downtrend after having broken out to the dowside of a descending triangle. After a momentary correction, prices could possibley continue further down, with a final target of around 15 600. However, nothing is guaranteed, so always take your profits earlier if they come.
AFRICAN RAINBOW MINERALS (ARI) DAILY TIMEFRAME NEUTRALThe price for ARI is moving in an ascending channel on the weekly and daily timeframe. The share price is now at the top of the ascending channel, which represents a critical resistance level. If prices find support at the 17 000 psychological level or the inner trendline, then we can expect prices to continue further with the bullish move. However, if prices break below the inner trendline, we can expect some selling pressure as the price would be making a corrective move before resuming the bullish momentum.
If traders enter short on this one, they must open smaller positions as the market is clearly bullish. And then again, what do they say about trends? "Failing to respect the trend might leave you without a cent!!!"
NIO 1-HOUR TIMEFRAME SHORTThe price for NIO could likely face resistance at the $5.00 price level, or even if it could go higher than this, it would likely face some strong resistance at the $5.90 area. The price has been moving in a downtrend, forming a series of bear flag patterns along the way. One the higher timeframes, the price broke out of a major range to the downside. This should be a key driver for this short trade as the momentum is clearly to the downside.


