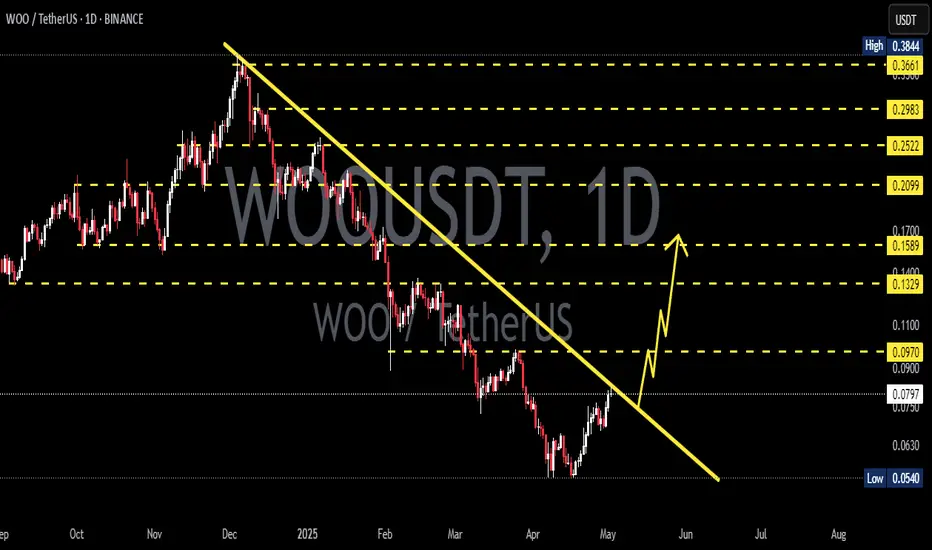
WOO/USDT Ready for Breakout After Long Consolidation!Chart Analysis (1D Time Frame):
This WOO/USDT chart shows a potential breakout setup after months of accumulation and downward pressure.
📉 Descending Trendline Resistance:
The price has been in a steady downtrend since December 2024, repeatedly rejecting from a descending resistance line.
🟨 Strong Accumulation & Support Zone (0.0540 – 0.0643 USDT):
A strong horizontal support zone has formed since April 2025. Price has bounced multiple times from this area, indicating growing buying pressure.
📈 Breakout Potential:
If WOO breaks above the descending trendline with strong volume, this could signal the start of a major bullish move.
🎯 Potential Upside Targets (Key Resistance Levels):
1. 0.0798 USDT – Initial breakout confirmation.
2. 0.0963 USDT – First bullish target.
3. 0.1334 USDT – Medium-term target.
4. 0.1916 USDT – Aggressive target.
5. 0.2544 USDT – Extended bullish continuation target.
6. 0.3655 – 0.3844 USDT – Long-term major resistance zone.
⚠️ Risk Note:
A fake breakout is possible if the volume is weak. If price breaks below the accumulation zone, the bearish trend may continue.
📌 Conclusion:
WOO is at a critical decision point. A confirmed breakout from this descending structure could trigger a significant bullish rally. A must-watch setup for both traders and investor.
Woousdtidea

WOOUSDT at weekly support, eyeing for 0.25$Here is how I see WOOUSDT to play out.
The price is currently dipping into weekly support zone WS1.
It is likely that the price will bounce from here towards weekly resistance zone WR1.
In case the price reaches this weekly resistance zone WR1, it is likely to experience some pullback.
However, this pullback will be only to gather some momentum to break WR1 on the next attempt and move towards next weekly resistance WR2.
Other indicators are also looking healthy for this one, thereofore, it seems that it going to resume its upward journey, that started in the beginning of April 2025, soon.
I am scaling in this one now an as the price dips deeper into this support zone. This one is a good bet and will provide a good return with considerably limited risk.
Whats your thoughts on that? Share with me in the comment.

WOOUSDT 1D AnalysisWOO ~ 1D Analysis
#WOO Buy after successfully penetrating this resistant line with a short -term target of at least 10%+ from here.
WOOUSDT 4DWOO ~ 4D Analysis
#WOO This is the lowest support for now. Buy from here if you still have a Conviction on this coin with a minimum target of 20%+

WOO/USDT: Stop Buy Order Set > Watching for BreakoutHey traders,
Here's a quick look at a potential BINANCE:WOOUSDT long setup I'm watching.
Following a dip to $0.1700, WOO seems to have found support and is potentially gearing up for a move higher.
>>I've set a stop buy order just above $0.1780 to enter if it breaks out.<<
Good luck out there!
Disclaimer: This analysis is for informational purposes only and should not be considered financial advice. I am not a financial advisor. Trading cryptocurrencies involves significant risk, and you could lose some or all of your investment. Conduct your own research and due diligence before making any trading decisions. Past performance is not indicative of future results.

WOOUSDT: Strong Bullish Breakout Signals Next Big Move!BINANCE:WOOUSDT has shown a strong bullish setup after a successful breakout from a falling wedge pattern, followed by an extended period of consolidation. This consolidation phase allowed the price to stabilize and gather momentum. Now BINANCE:WOOUSDT broke out of its consolidation box, indicating the start of a potential upward trend towards new highs. With strong volume supporting this breakout, the chart signals a bullish continuation. Traders should watch for key resistance levels and monitor volume to confirm momentum. GETTEX:WOO is showing strong potential as it heads toward higher levels—stay tuned for more movement!”
BYBIT:WOOUSDT Currently trading at $0.225
Buy level: Above $0.22
Stop loss: Below $0.178
TP1: $0.26
TP2: $0.35
TP3: $0.5
TP4: $0.65
Max Leverage 3x
Always keep Stop loss
Follow Our Tradingview Account for More Technical Analysis Updates, | Like, Share and Comment Your thoughts

$WOOUSDT Ready for Takeoff: Breaking Out of the Falling Wedge!BINANCE:WOOUSDT recently broke out from a falling wedge pattern and took a small retracement. It’s now starting to move upward again with strong volume behind it. Expecting significant jumps in the coming days as momentum builds! Keep an eye on key levels for potential entries.
GETTEX:WOO Currently trading at $0.186
Buy level: Above $0.185
Stop loss: Below $0.154
TP1: $0.22
TP2: $0.35
TP3: $0.5
TP4: $0.65
Max Leverage 3x
Follow Our Tradingview Account for More Technical Analysis Updates, | Like, Share and Comment Your thoughts

WOOUSDTWOO ~ 1W
#WOO In the event of a retest of this support block,. this is a very strong buy signal.

$WOO Daily Long SetupConfluences:
* Lying on daily demand zone.
* Retesting Range Low.
* Making Bullish Bat Pattern.
Targets and stop-loss is mentioned in the chart.
Easy invalidation with strong RR.
Do not forget to follow and support my charts.
Cheers!🥂

Woo/Usdt On The Verge Of Breakout The Woo/USDT pair is currently on the verge of a potential trendline breakout. If this breakout is successful, we could see a significant bullish move of around 15-30% in the short term. Please note that this information is not intended as financial advice, and it is crucial for you to perform your own research (DYOR) before making any investment decisions. Trendline breakouts can serve as crucial technical indicators for traders, potentially signaling a shift in market sentiment and paving the way for price momentum. Keep a close eye on the price action and volume to confirm the breakout, and always manage your risk accordingly.

WOO / WOOUSDTGOOD LUCK>>>
• Warning •
Any deal I share does not mean that I am forcing you to enter into it, you enter in with your full risk, because I'll not gain any profits with you in the end.
The risk management of the position must comply with the stop loss.
(I am not sharing financial or investment advice, you should do your own research for your money.)

WOOUSDTBINANCE:WOOUSDT Long idea
⛔"Daily crypto market analyses I provide are personal opinions & not financial advice. Trading carries risks, so do your own research & seek advisor's help.#DYOR"
Don't forget to like and comment

#WOO/USDT#WOO/USDT
The price is moving in a head and shoulders pattern from February 2022
We are now at the right shoulder of the model
As well as another bearish triangle pattern that is about to break
Current price 0.2838
The first goal is 0.3542
The second goal is 0.4291
The third goal is 0.5012
Which represents 190% of the current price
Down triangle

WOOUSDT - Buy Setup!!WOOUSDT (1D Chart) Technical analysis
WOOUSDT (1D Chart) Currently trading at $0.18
Buy level: Above $0.177
Stop loss: Below $0.161
TP1: $0.187
TP2: $0.2
TP3: $0.23
TP4: $0.27
Max Leverage 2x
Always keep Stop loss
Follow Our Tradingview Account for More Technical Analysis Updates, | Like, Share and Comment Your thoughts

WOO Network (WOO) formed bullish Gartley for upto 12.50% pumpHi dear friends, hope you are well and welcome to the new update on WOO Network (WOO) with US Dollar pair.
Previously we caught almost 70% pump of WOO as below:
Now on a 4-hr time frame, WOO has formed a bullish Gartley move for the next pump.
Note: Above idea is for educational purpose only. It is advised to diversify and strictly follow the stop loss, and don't get stuck with trade.

WHY WOO COIN PRICE DROP ? WOO COIN ANALYSIS AND TRADE SETUP !!WOO Coin Update & Possible Move !!
• On 4h tf Currently holding now its support . ( small bounce expected.
• MACD &RSI are Bearish on 4h, 1D &1W Chart.
• Personally i open trade in long with 1% on 0.18$ lets see what happen.
• If its break its 4h support then next stop is at 0.15$.
FOLLOW ME FOR MORE ANALYSIS

WOO target 0.24~0.274h time frame
-
WOO has potential to create a structure to reach 0.24~0.27.
Be careful of the PRZ there.
-
TP: 0.24~0.27
SL: 0.202

woo network short setup Stop: above the trebdline and mini triangle
entry at 0.618 Fib + GAP + POC
traget : previous POC
Hello Traders, here is the full analysis for this pair, let me know in the comment section below if you have any questions, the entry will be taken only if all rules of the strategies will be satisfied. I suggest you keep this pair on your watchlist and see if the rules of your strategy are satisfied. Please also refer to the Important Risk Notice linked below.

WOOUSDT likely to head up to weekly resistance 0.26-0.27The price is trading between weekly support zone WS1 and weekly resistance zone WR1. I believe it is likely that the price will continue its upward journey towards weekly resistance WR1. Once it hits the resistance WR1, the price will be pushed back down. We will check what are the relevant lower time frame supports on the way down once it hits that resistance area.

Woo/usdt Breakout And Retest Woousdt
Breakout was already confirmed retest in process incase of successful retest expecting 50-70% bullish move
If you are satisfied with our work join us , it is only matter of time to be successful
Dyor, Risk under your control

WOOUSDT - Head and Shoulders PatternWOOUSDT (1W Chart) Technical analysis
WOOUSDT (1W Chart) Currently trading at $0.285
Buy level: Above $0.277
Stop loss: Below $0.19
TP1: $0.35
TP2: $0.4
TP3: $0.5
TP4: $0.6
Max Leverage 1x/Spot Market
Always keep Stop loss
Follow Our Tradingview Account for More Technical Analysis Updates, | Like, Share and Comment Your thoughts

Woousdt Short-term Woousdt
Bullish pennant breakout confirmed 4h time-frame
Incase of succesful retest expecting 35-50% bullish move

WOO/USDT Technical Analysis: Inverse Head & Shoulder Pattern
#WOO/USDT Trade setup and TA Update:-
#WOO breakout this inverse head and shoulder pattern which is basically a bullish pattern. Currently, we are expecting a retest of this pattern.
BEASIC INFO: An inverse head and shoulders pattern is comprised of three component parts: After long bearish trends, the price falls to a trough and subsequently rises to form a peak. The price falls again to form a second trough substantially below the initial low and rises yet again.
Entry:- CMP and add more up to $0.2867
Lev:- 10x (Depending on your Risk appetite)
Targets:-20%
Stop Loss:-$0.2807
This chart is likely to help you in making better trade decisions if it did consider upvoting this chart.
Would also love to know your charts and views in the comment section.
Thank you
