EurAud Updated, Check this outWhatsup ALL , here is the full analysis for this EURAUD, let me know in the comment section below if you have any questions, .Keep this pair on your watch-list .
I have Linked My previous EURAUD Analysis in the links Below!
Conditions -
1. Wait for confirmation
2.Use Risk Management
3. Do your Own analysis
Have a great week.
See You in the next Video!
*Dont forget to drop me a like , Comment and a follow. we appreciate the support and it will encourage us to make more free analysis like this for you all :)
Wpattern


wutang to 348-350just a prediction. also a zone on 4h around 348. weekly looked like a bear flag but seems like it held. we'll see.

GBPCAD BUY W FORMATIONHi all, I don't know how I missed this. Possibility for a W pattern on GBPCAD! Have fun all!

XRP/USD ALMOST AT THE END OF THE WEEKLY CHART BEAR RUN...::: THIS IS A WEEKLY CHART !!! :::...
XRP/USD is coming to the end of it's bearish run on the daily, but still within the triangle on the weekly chart.
Price action is nearing completion of the Level 2 move (2-1, 2-2, 2-3), which will then start the Peak Formation Low (PFL) move which is a Level 3. No doubt, going by past market structure, manipulation will be constant and keep the price at a consolidation zone in order to frustrate the market even more. I'm expecting a 3 legged W formation before the first fake breakout of the triangle structure, as noted on the chart. Manipulation will continue before the final drop, which should complete and confirm a level 1 base before launch anywhere between December 2019 ~ February 2020. My opinion is that they will launch towards the middle or end of January 2020 to complete the level 1 move and start on a level 2 move around 0.42 cents. From level 2 to PFH (@ 0.58 cents), could be very fast or drawn out. Note that all of the EMAs are starting to fan out, which signals preparation for a reversal of trend.
When we look at the TDI indicator at the bottom, it also shows we are approaching the oversold area, with RSI approaching the lower outer band. I'm expecting the market will push the RSI downwards a little more, to form a sharkfin before the uptrend starts, breaking out of the triangle structure. The fast EMA (the red line within the TDI indicator) should also follow RSI, although I'm expecting it to touch the lower band (blood in the water), coinciding with the sharkfin pattern. I believe the sharkfin blood in the water pattern, may occur around October 2019 (next month), so we will most likely see lower pricing, possibly around 0.20 cents USD, before the bullish trend starts properly.
I've marked this chart conservatively because in the last 12 months, the chart shows that the XRP market conditions are highly manipulated to the extreme, not following normal psychological and normal buying patterns, coupled together with Ripple dumping huge amounts of coin into the market, out of their escrow wallets, no doubt to keep current pricing low and within the triangle structure. Yes, 1000% this coin is manipulated by ripple themselves. Why? who knows... especially because the higher value that XRP has, would facilitate xrapid and other transfers with XRP and would help increase market sentiment... so in my opinion, its non sensical... but once this current manipulation has run it's course, we should see a very strong uptrend, possible gaps in prices from candle to candle, within the 4 hourly to daily chart. My guess is that we should see XRP arrive, at least $150 to $200 by June 2020. Does this sound far fetched? possibly, but possibly not. Time will tell, the chart never lies.
###########
DISCLAIMER:
These are my analysis, my opinion, I give no guarantees and I'm not responsible for any losses that you may occur if you trade this, whether you buy crypto or trade it in the CFD market. If you want to trade this chart, do your own analysis and make sure you have a good money management plan in place. If you want to learn more about trading, here is a good place to start: babypips dot com
I generally post my own analysis in BTMM format, although I am proficient in Crypto Patterns, Gartleys, Butterflies, Pattern Trading, Elliott Wave Trading, Pitchfork , Trendline , VSA and Price Action trading, for which I may from time to time post additional analysis including some of these other methods.
I don't answer to bullies, trolls or charlatans. I don't have time to debate you so if you write babble, I will ignore you. Post a proper analysis, but don't post a blank chart with words or claim you are a 'WE' and have some magical algorithm or secret, then I might answer you. I'm posting this chart here for my own personal record and to share with those that may appreciate it, with the hope that it can help someone.
###########

EURNZDW' Pattern being formed creating a double bottom for lidiqty below. We have an open order, liqidity to capture and imbalance with a gap in the market to fill which gives me positive signs to the upside short term before we see a potential fall to the next open order below.
As always...... PATIENCE - CONFIRMATION - ENTRY - PROFIT

Altcoin rocketship fueling up? This chart is pretty straight forward, but I'll annotate what I see happening.
I've said this on many youtube videos, twitter post and on reddit that I'm noticing a very similar pattern from 2015 and now. Seeing how this is on a weekly time frame, this will require some patience to develop.
www.reddit.com
twitter.com
2015:
Major Correction - 84% drop
Bear Trap - 56% drop
Followed by a rocket ship of a uptrend that lasted the latter 2 years of the 4 year BTC cycle. Notice that the total market cap gain from bottom to top is a 6356.51x gain
2019:
Major Correction - 90%
Bear Trap? - 46% so far (Could have a little bit more to go)
Directly 4 years since the last cycle which puts us very close to the next "rocket ship uptrend."
Lets also notice that from June 2014 to Jan 2018 looks like a big J with the bottom part of the J forming a W. Fast forward to now, we look as if we are forming the bottom of a J and the second dip of a W. If we do even just a quarter of what 2015-2018 did, we're looking at atleast a 1500x gain in total marketcap. Of course this is not going to be distributed evenly. Some will see higher gains than others, but should we follow history we're in for a very crazy ride.
What I want to see before entering another position in altcoins is for my indicators to be going up while the marketcap is either going sideways or going lower. As of right now, alts are under the wine press, but they nay not be for much longer. Only a few months if we follow the pattern. Remember, the tortoise wins the race.
Lastly, I'm not your uncle, this isn't financial advice. Everything said here is for informational purposes only. I'm only giving my opinions based off what I am seeing in the charts. Always make sure to do your own research and come up with your own conclusions before investing.
Donate:
BTC: 3NiagBLCT2EeecFDYSBwKpoC2wDuVi1B2P
LTC: LcQzho9WDH1TCH9diS9ioiTBjvRuJ9NyCR
TRX: TG676iPXWwQYiBb1TjPFSAiVypFfgHXvZ8

CHFJPY SELL! Aggressive Bearish Movement!
EMA indicating downtrend continuation. We may also have a W pattern being formed if the trend does die off but I don't believe it will due to the aggressive downtrend! We must be patient to see what the market does! If downtrend does continue, Wait for breakout, retest, and if rejection occurs - Sell!
This setup seems more on the side of being a short rather than a long position!

NZDUSD for sellThe Price is forming a W pattern within the strong resistance so we are expecting to bounce back and continue a bearish trend
MACD divergence is shown

GBPAUD W PATTERNAfter the accumulation phase in Asian session. Market broke through with aggressive candles to the south indicating that this short fake bear run will continue whether on the other hand we see a W shaped pattern in an up trend market. I am bullish atm.

ASX (AUS200) (AUS200Cash) LONGThe Australian Stock Market index is looking very bullish, due to the double top pattern forming on the lower timeframes. The higher timeframes also signify a rally, which sets the mood for this trading signal. I would wait to see how rice would react to the 61.50 level, which represents an institutional level, and was also tested previously Then an entry would be made after this retest. Do note that the price may not retest that far as it all depends on the buying pressure. The 200 EMA is currently moving below the price in the lower timeframes, which also prepares us for buy positions. I would expect the price to rally further with the target being the height of the "W" pattern.

CHFJPY SHORTWe have the London open and possibly see a downtrend from now on. Going to wait till NY open. We have this M shaped pattern broken yesterday and it tried to retest. We have a strong bearish EMA 50 and 200 showing a nice trend down.

ATUL - W PATTERN BULLISH BREAKOUTCMP 3232
Long suggested at CMP 3200-3250
Stop 3050
Target Open
Logic
Weekly chart
W pattern breakout with volumes supporting.

TECHM - W PATTERN BREAKOUT + CONSOLIDATIONTECHM
CMP 732
Long suggested ONLY above 753-755 levels.
Stop 695
Target Open
Logic:
Daily chart W pattern with volumes rising in tune with price rise and dropping during retracements.
Currently price consolidating with drop in volumes.

EURUSD = what I am anticipating right now (not predicting)This is a continuation of the earlier trading plan. Refer this trading plan for context :
If the price could go down and test 1.13600 again and the market shows its hand (in a form of a W pattern or bullish engulfing candle), I will long EURUSD.
If you like this write-up (albeit pretty short!), give me a Follow and Message me for any discussion you would like relevant to what we are doing here : Trading. Later guys and Thank you for reading


ETCUSD : W pattern opportunityPotential W pattern.
We still are in the rally.
MACD cross.
Long trade opportunity:
-Entry=16.2
-Profit target=20.8
-Stop Loss=14.9
If we break the black line resistance, we should see strong buy to confirm the pattern.


BTCUSD - BTC Reversal possibility and why - The Bulkowski BIG W If in doubt, blame Bulkowski.
Or remember
"The weakest link in the trade is the trader" Dr. A Elder
thepatternsite.com
thepatternsite.com

XBTUSD - Bulkowski's Big W - Against my biasBulkowski's Big W.
Keep in mind that we are in a long term down trend, making this riskier than usual. In fact I am bearish and short so this goes against my bias, but the possibility serves as an education for myself and documented specifically so I do not lose the chart. Enjoy.
Characteristic | Discussion
Price trend: Downward leading to the pattern.
Shape: A big W shape with twin bottoms and tall sides.
Reversal pattern: Look for a double bottom reversal pattern at the base of the big W.
Tall sides: The best performing big W chart patterns have tall, straight declines leading to the bottom of the big W.
Rise between bottoms: The rise between the valleys of the double bottom is 10% to 20% or more.
Volume: Recedes 69% of the time.
Breakout Confirmation: The pattern confirms as a valid one when price closes above the highest peak between the two bottoms.
Trading Tactic | Explanation.
Measure rule: Compute the height from the highest peak to the lowest valley (D-B) and then add the result to the price of the peak high D). The result is the target price. The link to the left gives more information about the measure rule.
Breakout: Occurs when price closes above the peak high (D).
Stall: For swing traders, buy at the double bottom low (E) and ride price upward to confirmation of the double bottom (the high between the two bottoms, D). Price often pauses there. If price drops below the low of the second bottom (E), exit the position immediately. If price confirms the double bottom, expect a rise approaching the left side high (A).
Position traders: Wait for confirmation of the double bottom before taking a position and be prepared to sell as the stock nears the price of the left side high (the price at C approaches the price at A).
See more from Bulkowski here: thepatternsite.com
In addition to the above and once again, against my bias. There is a possibility of an Adam and Eve Double Bottom here - Zoom Out:
thepatternsite.com

Possible W Pattern foundim not sure but this could happen
i do not take any responsibility.
trade with care

USDJPY 4H Macd ReversalMacd showed over bought and oversold price movement on the 4H trade setup chart, 30m timing chart and 5m entry point chart.

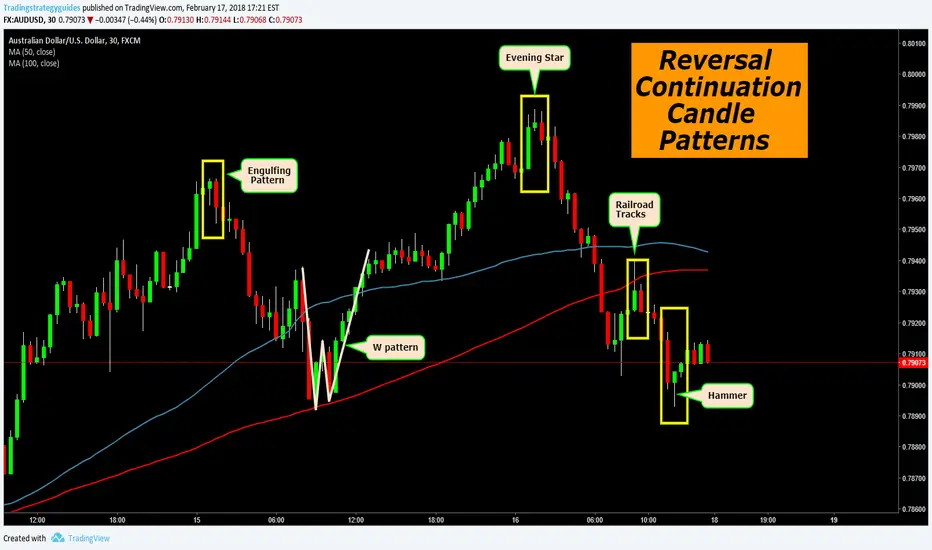
Reversal Continuation Candle patternsThese are the "GO" reversal continuation candle patterns I use when I am using the Break-Hook-Go pattern.