BRIEFING Week #13 : ETH offers perfect opportunityHere's your weekly update ! Brought to you each weekend with years of track-record history..
Don't forget to hit the like/follow button if you feel like this post deserves it ;)
That's the best way to support me and help pushing this content to other users.
Kindly,
Phil
WTI

Crude Oil (WTI) Bullish Breakout – Eyes on $78.47!🚀 Crude Oil (WTI) Bullish Breakout – Eyes on $78.47! 🚀
📊 Trade Setup:
Entry Price: $73.12
Take Profit 1: $73.99
Take Profit 2: $76.20
Take Profit 3: $78.47
Stop Loss: $71.21 (below key support zone)
📈 Analysis:
After months of trading in a range, WTI Crude Oil has broken above the upper boundary of the channel , signaling a bullish breakout. This breakout is supported by:
1️⃣ China's Economic Optimism: Growth pledges and potential stimulus are boosting demand expectations.
2️⃣ Technical Momentum: Key resistance at $71.50 and $74 has been breached, opening the path toward higher targets.
3️⃣ Tight Weekly Chart Range: A big move was anticipated, and the bulls delivered!
🎯 Targets:
With momentum on our side, we’re targeting:
$73.99: Quick resistance retest.
$76.20: Alignment with prior highs.
$78.47: Major resistance and breakout zone.
🔹 Risk Management:
Stop loss at $71.21, well below the key support zone, ensures controlled risk in case of reversal.
⚡ Are you riding the breakout, or watching from the sidelines? Let me know your thoughts below! ⚡

Black Hole SunshineA surreal dreamscape, when spilled on water, can ignite under the right conditions, creating dramatic (but harmful) floating flames—an event that brings people back to reality.
The oil patch is on the verge. With an oil to gold ratio near all time high, the watershed moment is close. Accumulate through the near term volatility.

WTI Oil H4 | Bullish uptrend to extend further?WTI oil (USOIL) could fall towards an overlap support and potentially bounce off this level to climb higher.
Buy entry is at 68.65 which is an overlap support.
Stop loss is at 67.53 which is a level that lies underneath a swing-low support and the 50.0% Fibonacci retracement level.
Take profit is at 71.06 which is a swing-high resistance.
High Risk Investment Warning
Trading Forex/CFDs on margin carries a high level of risk and may not be suitable for all investors. Leverage can work against you.
Stratos Markets Limited (www.fxcm.com):
CFDs are complex instruments and come with a high risk of losing money rapidly due to leverage. 63% of retail investor accounts lose money when trading CFDs with this provider. You should consider whether you understand how CFDs work and whether you can afford to take the high risk of losing your money.
Stratos Europe Ltd (www.fxcm.com):
CFDs are complex instruments and come with a high risk of losing money rapidly due to leverage. 63% of retail investor accounts lose money when trading CFDs with this provider. You should consider whether you understand how CFDs work and whether you can afford to take the high risk of losing your money.
Stratos Trading Pty. Limited (www.fxcm.com):
Trading FX/CFDs carries significant risks. FXCM AU (AFSL 309763), please read the Financial Services Guide, Product Disclosure Statement, Target Market Determination and Terms of Business at www.fxcm.com
Stratos Global LLC (www.fxcm.com):
Losses can exceed deposits.
Please be advised that the information presented on TradingView is provided to FXCM (‘Company’, ‘we’) by a third-party provider (‘TFA Global Pte Ltd’). Please be reminded that you are solely responsible for the trading decisions on your account. There is a very high degree of risk involved in trading. Any information and/or content is intended entirely for research, educational and informational purposes only and does not constitute investment or consultation advice or investment strategy. The information is not tailored to the investment needs of any specific person and therefore does not involve a consideration of any of the investment objectives, financial situation or needs of any viewer that may receive it. Kindly also note that past performance is not a reliable indicator of future results. Actual results may differ materially from those anticipated in forward-looking or past performance statements. We assume no liability as to the accuracy or completeness of any of the information and/or content provided herein and the Company cannot be held responsible for any omission, mistake nor for any loss or damage including without limitation to any loss of profit which may arise from reliance on any information supplied by TFA Global Pte Ltd.
The speaker(s) is neither an employee, agent nor representative of FXCM and is therefore acting independently. The opinions given are their own, constitute general market commentary, and do not constitute the opinion or advice of FXCM or any form of personal or investment advice. FXCM neither endorses nor guarantees offerings of third party speakers, nor is FXCM responsible for the content, veracity or opinions of third-party speakers, presenters or participants.

WTI Oil Short Drill Baby,Drill!???Is it drill baby drill of President Trump? Or bearish profit taking before Oil season starts soon?
Well I dont know!
All I know is that the charts are communicating to me to sell oil for now.
I am already short in this, 2 approches that I use for good, in case a short bullish pullback happens,I will add more to my selling positions(red arrows)
2 different profit targets whereas the 2nd one has higher reward-resik-ration

WTI CRUDE OIL: Last pull to 4H MA50 possible, $72 target remainsWTI Crude Oil just turned bullish on its 1D technical outlook (RSI = 55.181, MACD = -0.570, ADX = 39.438) as it crossed above the 4H MA200. It is still under the 1D MA50, so the newly emerged Channel Up may pull the price back under the 4H MA50 one last time before the next, even stronger bullish wave. Overall, we remain long (TP = 72.00), even more so on the long term.
## If you like our free content follow our profile to get more daily ideas. ##
## Comments and likes are greatly appreciated. ##

USOIL - NEW BREAKOUTHello Traders !
The USOIL price broke the resistance level (68.427 - 68.703).
This key level becomes new support !
So, I expect a bullish move🚀
_______________
TARGET: 70.080🎯

A major correction in Brent crude oil (UKOIL).A major correction in Brent crude oil (UKOIL).
- This idea is invalidated if the price exceeds $73.755.
On the monthly chart, it shows that we are forming a 50% Fibonacci correction from wave 1, from where we will further expect growth toward the $115 area, and possibly even a new all-time high due to a military conflict in the Middle East.
I’ve marked potential downside targets on the chart at $46.50, $49.06, and $52.46, from where we will look for entry points for long positions lasting 2 years or more.

Hellena | Oil (4H): SHORT to the area of 65.268.Colleagues, I believe that the downward movement is not over yet, and now the price is in a complex combined correction. The second correction also consists of “ABC” waves.
In an ideal scenario, the price completes wave “C” in the 70.000 area and starts the downward movement to the support area of 65.268.
In general, the plan has not changed since the last forecast, but the bulls still have strength, so we should take the upward movement as an opportunity to profitably go short.
Manage your capital correctly and competently! Only enter trades based on reliable patterns!

CRUDE OIL LONG SIGNAL|
✅USOIL made a retest
Of the horizontal support
Of 68.60$ so we are bullish
Biased so we can enter a
Long trade with the TP of 69.46$
And the SL of 68.17$
LONG🚀
✅Like and subscribe to never miss a new idea!✅
Disclosure: I am part of Trade Nation's Influencer program and receive a monthly fee for using their TradingView charts in my analysis.

WTI rises to test major resistance WTI has risen in the last couple of weeks after staging an oversold bounce from around the key $65.00 long-term support level at the start of the month. However, it is now testing a key resistance area between $69.15 - $70.00 range, which is where WTI last sold off from. It is a pivotal zone. Given the underlying long-term bearish trend, I am more inclined to look for bearish setups to form here, than to chase this move higher. However, that being said, I would have to drop my short-term bearish bias in the event WTI were to break decisively above $70.00 level in the days ahead.
By Fawad Razaqzada, market analyst with FOREX.com

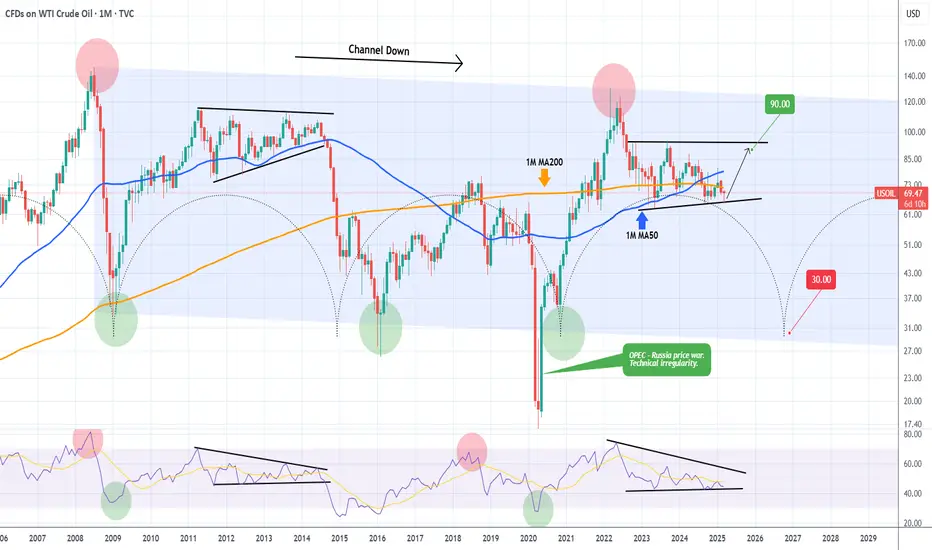
WTI OIL Ultimate long-term guide.WTI Oil (USOIL) has a tendency, like a number of key traditional assets, to follow long-term Cycles. Market psychology more times than not makes investors and the market behave in similar ways (euphoria buying, panic selling) given the same market conditions. Fundamentals and catalysts can often be used as reasons and excuses to confirm the technical trends and long-term Cycles.
Oil is no different and on this 1M time-frame analysis we see why. The dominant multi-year pattern is a Channel Down and it has started on the July 2008 All Time High (ATH). Right now it appears that we are inside a Wedge pattern similar to 2011 - 2014 and more specifically on the final Bullish Leg towards the top.
The 1M RSI sequence among those two fractals is identical so based on all these parameters we believe WTI will test $90.00 by late 2025 - early 2026 and if rejected, start a brutal long-term sell-off towards the bottom of the Channel Down and the 35.00 - 30.00 range by late 2026 as the Time Cycles suggest.
-------------------------------------------------------------------------------
** Please LIKE 👍, FOLLOW ✅, SHARE 🙌 and COMMENT ✍ if you enjoy this idea! Also share your ideas and charts in the comments section below! This is best way to keep it relevant, support us, keep the content here free and allow the idea to reach as many people as possible. **
-------------------------------------------------------------------------------
💸💸💸💸💸💸
👇 👇 👇 👇 👇 👇
Oil - Expecting Retraces and Further Continuation HigherH1 - Bullish trend pattern in the form of higher highs, higher lows structure
Strong bullish momentum
Bearish divergence on the moving averages of the MACD indicator.
Expecting retraces and further continuation higher until the two strong support zones hold.
If you enjoy this idea, don’t forget to LIKE 👍, FOLLOW ✅, SHARE 🙌, and COMMENT ✍! Drop your thoughts and charts below to keep the discussion going. Your support helps keep this content free and reach more people! 🚀
--------------------------------------------------------------------------------------------------------------------
Disclosure: I am part of Trade Nation's Influencer program and receive a monthly fee for using their TradingView charts in my analysis.

CRUDE OIL(WTI): Bullish Continuation Confirmed
One of the setups that we discussed on a today's live stream
was a bullish flag pattern on WTI Crude Oil on an hourly chart.
Its resistance breakout provides a strong bullish confirmation.
We can expect growth at least to 70 level.
❤️Please, support my work with like, thank you!❤️

Technical Analysis for WTI Crude Oil (Daily Chart)Current Price Action
WTI crude oil is trading at $70.51, showing a recovery from the Liquidity Pool zone near the $66.00–$67.00 range. The price has approached a key resistance level around $71.00, which aligns with a previous area of rejection in February 2025. The chart suggests a potential pullback from this resistance level, as indicated by the projected downward arrow.
Support Levels:
$66.00–$67.00: This zone represents a significant liquidity pool where buyers have consistently stepped in, leading to a reversal in price.
$65.00: A psychological support level and the lower boundary of the liquidity pool.
Resistance Levels:
$71.00: A critical resistance level that has acted as a ceiling for price action in recent months.
$73.00: The next major resistance level if the price breaks above $71.00.
Volume Profile Analysis
The Volume Profile on the right side of the chart shows significant trading activity between $70.00 and $71.00, indicating strong resistance in this area. Above $71.00, the volume thins out, suggesting that a breakout could lead to a rapid move toward $73.00.
Indicators and Momentum
Trend: The price is recovering from a bearish trend but remains below the highs of $80.00 seen earlier in the chart. The current move appears to be a retracement within a broader downtrend.
Potential Pullback: The projected arrow on the chart suggests a possible rejection at $71.00, with a pullback toward the $68.00–$69.00 range.
Market Sentiment
The chart reflects cautious optimism, with buyers stepping in at lower levels but facing strong resistance at $71.00. A breakout above this level could signal a shift in sentiment, while a rejection would confirm the continuation of the bearish trend.
Conclusion
WTI crude oil is at a critical juncture, testing the $71.00 resistance level. Traders should watch for a breakout above $71.00, which could target $73.00 and higher. Conversely, a rejection at this level may lead to a pullback toward the $68.00–$67.00 support zone. The liquidity pool near $66.00 remains a key area for buyers to defend in the event of further downside.

CRUDE OIL Will Go Up After Pullback! Buy!
Hello,Traders!
CRUDE OIL is trading in a
Local uptrend and the price
Made a strong bullish breakout
Of the key horizontal level
Of 68.40$ so after a pullback
And a retest of the new support
We will be expecting a further
Bullish move up
Buy!
Comment and subscribe to help us grow!
Check out other forecasts below too!
Disclosure: I am part of Trade Nation's Influencer program and receive a monthly fee for using their TradingView charts in my analysis.

WTI Oil H4 | Rising into 50% Fibonacci retracementWTI oil (USOIL) is rising towards a pullback resistance and could potentially reverse off this level to drop lower.
Sell entry is at 69.23 which is a pullback resistance that aligns with the 50.0% Fibonacci retracement.
Stop loss is at 70.70 which is a level that sits above the 61.8% Fibonacci retracement and a multi-swing-high resistance.
Take profit is at 66.44 which is a multi-swing-low support.
High Risk Investment Warning
Trading Forex/CFDs on margin carries a high level of risk and may not be suitable for all investors. Leverage can work against you.
Stratos Markets Limited (www.fxcm.com):
CFDs are complex instruments and come with a high risk of losing money rapidly due to leverage. 63% of retail investor accounts lose money when trading CFDs with this provider. You should consider whether you understand how CFDs work and whether you can afford to take the high risk of losing your money.
Stratos Europe Ltd (www.fxcm.com):
CFDs are complex instruments and come with a high risk of losing money rapidly due to leverage. 63% of retail investor accounts lose money when trading CFDs with this provider. You should consider whether you understand how CFDs work and whether you can afford to take the high risk of losing your money.
Stratos Trading Pty. Limited (www.fxcm.com):
Trading FX/CFDs carries significant risks. FXCM AU (AFSL 309763), please read the Financial Services Guide, Product Disclosure Statement, Target Market Determination and Terms of Business at www.fxcm.com
Stratos Global LLC (www.fxcm.com):
Losses can exceed deposits.
Please be advised that the information presented on TradingView is provided to FXCM (‘Company’, ‘we’) by a third-party provider (‘TFA Global Pte Ltd’). Please be reminded that you are solely responsible for the trading decisions on your account. There is a very high degree of risk involved in trading. Any information and/or content is intended entirely for research, educational and informational purposes only and does not constitute investment or consultation advice or investment strategy. The information is not tailored to the investment needs of any specific person and therefore does not involve a consideration of any of the investment objectives, financial situation or needs of any viewer that may receive it. Kindly also note that past performance is not a reliable indicator of future results. Actual results may differ materially from those anticipated in forward-looking or past performance statements. We assume no liability as to the accuracy or completeness of any of the information and/or content provided herein and the Company cannot be held responsible for any omission, mistake nor for any loss or damage including without limitation to any loss of profit which may arise from reliance on any information supplied by TFA Global Pte Ltd.
The speaker(s) is neither an employee, agent nor representative of FXCM and is therefore acting independently. The opinions given are their own, constitute general market commentary, and do not constitute the opinion or advice of FXCM or any form of personal or investment advice. FXCM neither endorses nor guarantees offerings of third-party speakers, nor is FXCM responsible for the content, veracity or opinions of third-party speakers, presenters or participants.

WTI Price Analysis: Key Insights for Next Week Trading DecisionOil prices are showing signs of recovery after a strong bearish move, with $68.00 as a key level that will play a significant role in guiding our trading decisions for the new week.
📌 Key Technical Outlook:
🔹 Oil is currently trading within an ascending channel on the 4H timeframe.
🔹 I’ll be watching for a breakout/retest of the channel resistance and $68.50 for buying opportunities.
🔹 If selling pressure remains below the resistance line of the channel and the $68.00 key level, I will be considering selling opportunities.
📌 Major Market Drivers:
🔹 US Sanctions on Iran: The US Treasury imposed new sanctions targeting entities involved in supplying Iranian crude oil to China. Analysts expect a 1 million bpd drop in Iranian exports, which could support prices.
🔹 OPEC+ Production Cuts: A new plan will see seven member nations cut production by 189,000–435,000 bpd per month until June 2026.
🔹 Geopolitical Risks: Ongoing tensions in the Middle East & the Russia-Ukraine war continue to add a risk premium to oil prices.
📅 Key Economic Events on Our Radar Next Week:
🛢 Tuesday: API Crude Oil Stock Report – Offers insight into US oil inventory levels.
🛢 Wednesday: EIA Crude Oil Inventories Report – A key supply indicator affecting price movements.
🗓 Tuesday: US S&P Global PMI – Important for economic sentiment and demand expectations.
🗓 Thursday: US GDP (Q4 Final) – Provides clues on economic growth and potential impact on oil demand.
🗓 Friday: US Core PCE Index – The Fed’s preferred inflation measure, critical for policy direction.
Oil remains bullish in the short term, but I’ll be monitoring price action closely at $68.00 and $68.50 for trade setups. We’ll break it all down in Forex Morning Mastery tomorrow—stay tuned! 🔥📈

WTI - Positioning for Upside After Anticipated CorrectionThe US Light Crude 4-hour chart shows price action currently oscillating near the $68,60 level after recovering from early March lows. The recent price structure suggests we may see a short-term pullback before a stronger upward move develops. The chart indicates a potential bullish scenario with price expected to eventually rally toward the blue reaction zone (around $69,00-$69,50) after a possible retracement. This anticipated upside move is supported by the higher lows forming since mid-March and the overall recovery pattern from the $65,67 support level (marked by the red line). A prudent approach would be monitoring for reversal signs at lower levels before positioning for the higher probability move toward the blue reaction zone, with the orange resistance at $70,77 serving as the ultimate target if bullish momentum accelerates.
Disclosure: I am part of Trade Nation's Influencer program and receive a monthly fee for using their TradingView charts in my analysis.

WATCH OUT FOR OIL'S DESCENDING TRIANGLE...A potential close above 70 will signal the likelihood of oil price to test trendline is sloping downward or the bearish order candle.
N.B!
- USOIL price might not follow the drawn lines . Actual price movements may likely differ from the forecast.
- Let emotions and sentiments work for you
- ALWAYS Use Proper Risk Management In Your Trades
#usoil
#wti
#ukoil
BRIEFING Week #12 : Alt-Season might be coming soonHere's your weekly update ! Brought to you each weekend with years of track-record history..
Don't forget to hit the like/follow button if you feel like this post deserves it ;)
That's the best way to support me and help pushing this content to other users.
Kindly,
Phil

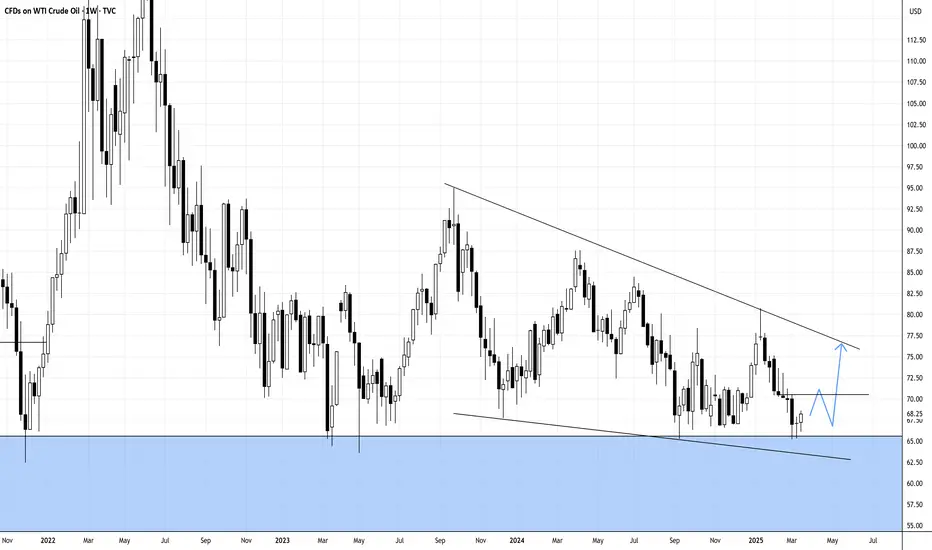
WTI CRUDE OIL: Hard rebound on 1.5 year support targeting $72.WTI Crude Oil is neutral on its 1D technical outlook (RSI = 48.748, MACD = -1.080, ADX = 23.603), which indicates the slow transition from a bearish trend to bullish. This started when the price hit the S1 level, a 1.5 year Support, and bottomed. The slow rebound that we're having since formed a Channel Up on a bullish 1D RSI, much like the one in September 2024, which eventually peaked after a +10.70% price increase. A similar rebound is expected to test the 1D MA200. The trade is long, TP = 72.00.
## If you like our free content follow our profile to get more daily ideas. ##
## Comments and likes are greatly appreciated. ##

CRUDE OIL Free Signal! Sell!
Hello,Traders!
CRUDE OIL made a sharp
And sudden move up
And it seems that it will
Soon hit a horizontal
Resistance level of 68.80$
From where we can go short
On Oil with the TP of 67.67$
And the SL of 68.87$
Sell!
Comment and subscribe to help us grow!
Check out other forecasts below too!
Disclosure: I am part of Trade Nation's Influencer program and receive a monthly fee for using their TradingView charts in my analysis.
