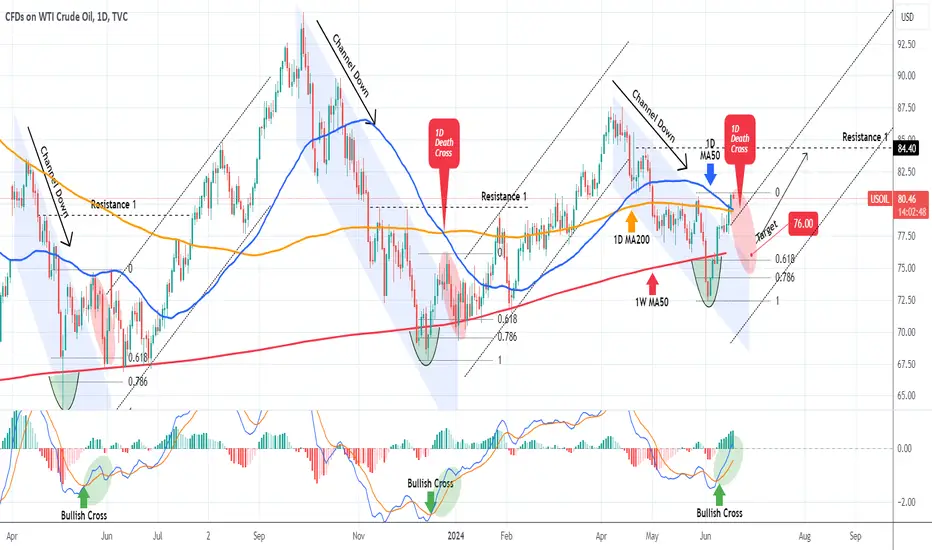
WTI OIL Shifted to longterm bullish, but expect correction firstWTI Oil (USOIL) broke above its 1D MA50 (blue trend-line) and invalidated April's Channel Down. Last time we saw such a Channel Down bullish break-out following a rebound on the 1W MA50 (red trend-line) was on December 20 2023 and before that on May 17 2023.
The common characteristic was that a 1D MACD Bullish Cross accompanied all those break-outs and the last two formed a 1D Death Cross. On both previous occasions, the price pulled back to at least the 0.618 Fibonacci retracement level, touching the 1W MA50 again.
As a result, even though we have confirmed a new long-term uptrend, we will turn bearish on the short-term, expecting a pull-back towards the 0.618 Fib, targeting $76.00.
-------------------------------------------------------------------------------
** Please LIKE 👍, FOLLOW ✅, SHARE 🙌 and COMMENT ✍ if you enjoy this idea! Also share your ideas and charts in the comments section below! This is best way to keep it relevant, support us, keep the content here free and allow the idea to reach as many people as possible. **
-------------------------------------------------------------------------------
💸💸💸💸💸💸
👇 👇 👇 👇 👇 👇
WTI
CME NYMEX: CL WTI Crude Oil Futures price forecast Target 165.00CME NYMEX: CL WTI Crude Oil Futures price forecast
T/S : Trend Trading
B/S : Buy
Entry : 80.00
Target : 165.00 (106.25%)
Stop : 67.00 (-16.25%)
Date : Jun 18, 2024
Note : Support and Resistance : 64, 75.5, 95, 110, 135, 165, 240

CRUDE OIL (WTI): Intraday Bullish Move
I see a breakout of an intraday horizontal resistance on WTI.
After a violation, the market started to correct within the expanding wedge pattern.
Test of a broken structure made the market bullish again.
I think that bulls may push the prices higher today.
Goal - 80.15
❤️Please, support my work with like, thank you!❤️

USOILOil analysis
4-hour and 1-hour time frames
The price is near the 4 and 1 hour supply area and we expect it to start correcting after hitting the area.

WTI stages breakoutCrude oil's rally today underscores its recent resilience. Prices surged despite weaker Chinese industrial data, suggesting investors are expecting the oil market to tighten as we head deeper into the US driving season.
Thanks to the rally, WTI has broken its bearish trendline that had been in place since April, finding strong support around $77.80, where the 21-day exponential moving average is present. Today's rally has lifted WTI to its 200-day moving average, just below the $79.50 level. Previously, it had struggled within the $79.50 to $80.00 range.
Considering last week's V-shaped recovery and the subsequent break above the bearish trendline, crude oil bulls are now looking for a move above May's high of $80.63. Achieving this would mark the first higher high and confirm a bullish reversal signal for WTI.
Conversely, if oil prices turn lower in the coming days and fall back below the breakout area around $77.80, the bearish trend would likely resume, leading to further technical selling.
However, the bullish scenario appears more probable to me.
Written by Fawad Razaqzada, market analyst at FOREX.com
Follow me on twitter: x.com

BRIEFING Week #24 : Volatility will Decide. Be very CautiousHere's your weekly update ! Brought to you each weekend with years of track-record history..
Don't forget to hit the like/follow button if you feel like this post deserves it ;)
That's the best way to support me and help pushing this content to other users.
Kindly,
Phil

#202425 - a weekly price action market recap and outlook - oilGood Evening and I hope you are well.
wti crude oil futures
Quote from last week:
bull case: The best the bulls can hope for, is for the lows to hold and to move sideways and hit the daily ema again. They failed at keeping it above 75, which was huge support. Last bear leg inside this bigger trading range was 11 weeks long from high to low and we are currently at 9 weeks. Bulls will want to find support here around 70-72 and trade back up to at least 78 over the next 8-12 weeks.
comment: After Monday there was no question that bulls took control again and the bear trend is over. Bears now fight to keep this a lower high and retest the 72.48 low but for now, market is in balance around 78. Bulls want to break out of the bear channel and test 80 again.
current market cycle: trading range
key levels: 72-79
bull case: Strong week by the bulls with 3 pushes up but still a lower high. Their next target is to get back above 80.22. Right now they have momentum going but big down, big up mostly creates confusion and that means trading range. Above 79.5 I will probably long for 80. They need to stay above 77 or odds favor a retest of the lows below 74.
Invalidation is below 77.
bear case: Huge bear surprise the week before and now a big bull surprise. Most reasonable thing here is for the market to move more sideways, probably still inside the very big triangle 73 - 81.5. If bears get below 77, they want to retest the lows below 74, which is also what I think has the slightly better odds next week but I would wait for confirmation.
Invalidation is above 80.6.
outlook last week:
“Neutral because I think we will hit the daily ema again and a retest of 72.5ish. I am not a fortune teller so I don’t know which comes first. I will watch the price action and give daily updates here on substack and intraday in my trading room.”
→ Last Sunday we traded 75.53 and now we are at 78.45. I said we will hit the daily 20ema which was 140 upwards. On Monday there was no question we will get there, so I hope you made some. Did not expect bears to just disappear afterwards and let the market trade above for the whole week.
short term: Neutral right under the bear channel line and daily ema at 77.5. Can break to either side.
medium-long term: We are seeing the big triangle playing out between 72 and 82. The high of the triangle got tested until mid of April and we have now tested the lows around 72.5. Market will probably move more inside this big range until we get a new big cycle to either side. —unchanged
current swing trade: None
chart update: Adjusted both two-legged corrections to fit the current pattern better but the C target is very questionable as of now. We need more price action to know where market wants to go from here.

USOIL Possible shortUSOIL has been moving bearishly for some time now since it's overall higher time frame direction is bearish. It has recently formed an interesting structural pattern where it swept previous equal highs before breaking the previous low with MASSIVE momentum. It has currently retraced back towards the deep inner range, where the kick the this previous enormous bearish momentum began, to fill imbalances that were left behind in the process. So price could potentially use a 4h supply zone to push further to the downside with the help of a triangle liquidity that has currently formed below it. The target is the latest low as it is weak due to the nature of the tend being bearish.

USOIL Trading IdeaBased on Simple Technical Analysis ( Trendline + Support & Resistance )
Risk Disclaimer:
Please be advised that I am not telling anyone how to spend or invest their money. Take all of my analysis as my own opinion, as entertainment, and at your own risk. I assume no responsibility or liability for any errors or omissions in the content of this page, and they are for educational purposes only. Any action you take on the information in these analysis is strictly at your own risk. There is a very high degree of risk involved in trading. Past results are not indicative of future returns. Good luck :-)

BRENT. Weekly trading levels 10.06.2024 - 14.06.2024During the week you can trade from these price levels. Finding the entry point into a transaction and its support is up to you, depending on your trading style and the development of the situation. Zones show preferred price ranges WHERE to look for an entry point into a trade.
If you expect any medium-term price movements, then most likely they will start from one of the zones.
Levels are valid for a week, the date is in the title. Next week I will adjust the levels based on new data and publish a new post.
! Please note that brokers have a difference in quotes, take this into account when trading.
The history of level development can be seen in my previous posts. They cannot be edited or deleted. Everything is fair. :)
----------------------------------------------
I don’t play guess the direction (that’s why there are no directional arrows), but zones (levels) are used for trading. We wait for the zone to approach, watch the reaction, and enter the trade.
Levels are drawn based on volumes and data from the CME. They are used as areas of interest for trading. Traded as classic support/resistance levels. We see the reaction to the rebound, we trade the rebound. We see a breakout and continue to trade on a rollback to the level. The worst option is if we revolve around the zone in a flat.
Do not reverse the market at every level; if there is a trend movement, consider it as an opportunity to continue the movement. Until the price has drawn a reversal pattern.
Don't forget to like Rocket and Subscribe!!! Feedback is very important to me!

WTI Oil H4 | Potential bullish bounceWTI oil (USOIL) is falling towards a pullback support and could potentially bounce off this level to climb higher.
Buy entry is at 77.52 which is a pullback support.
Stop loss is at 76.30 which is a level that lies underneath a pullback support and the 38.2% Fibonacci retracement level.
Take profit is at 80.37 which is a multi-swing-high resistance that aligns close to the 50.0% Fibonacci retracement level.
High Risk Investment Warning
Trading Forex/CFDs on margin carries a high level of risk and may not be suitable for all investors. Leverage can work against you.
Stratos Markets Limited (www.fxcm.com):
CFDs are complex instruments and come with a high risk of losing money rapidly due to leverage. 68% of retail investor accounts lose money when trading CFDs with this provider. You should consider whether you understand how CFDs work and whether you can afford to take the high risk of losing your money.
Stratos Europe Ltd, previously FXCM EU Ltd (www.fxcm.com):
CFDs are complex instruments and come with a high risk of losing money rapidly due to leverage. 73% of retail investor accounts lose money when trading CFDs with this provider. You should consider whether you understand how CFDs work and whether you can afford to take the high risk of losing your money.
Stratos Trading Pty. Limited (www.fxcm.com):
Trading FX/CFDs carries significant risks. FXCM AU (AFSL 309763), please read the Financial Services Guide, Product Disclosure Statement, Target Market Determination and Terms of Business at www.fxcm.com
Stratos Global LLC (www.fxcm.com):
Losses can exceed deposits.
Please be advised that the information presented on TradingView is provided to FXCM (‘Company’, ‘we’) by a third-party provider (‘TFA Global Pte Ltd’). Please be reminded that you are solely responsible for the trading decisions on your account. There is a very high degree of risk involved in trading. Any information and/or content is intended entirely for research, educational and informational purposes only and does not constitute investment or consultation advice or investment strategy. The information is not tailored to the investment needs of any specific person and therefore does not involve a consideration of any of the investment objectives, financial situation or needs of any viewer that may receive it. Kindly also note that past performance is not a reliable indicator of future results. Actual results may differ materially from those anticipated in forward-looking or past performance statements. We assume no liability as to the accuracy or completeness of any of the information and/or content provided herein and the Company cannot be held responsible for any omission, mistake nor for any loss or damage including without limitation to any loss of profit which may arise from reliance on any information supplied by TFA Global Pte Ltd.
The speaker(s) is neither an employee, agent nor representative of FXCM and is therefore acting independently. The opinions given are their own, constitute general market commentary, and do not constitute the opinion or advice of FXCM or any form of personal or investment advice. FXCM neither endorses nor guarantees offerings of third-party speakers, nor is FXCM responsible for the content, veracity or opinions of third-party speakers, presenters or participants.

Crude oil eyes $80, but resistance loomsWTI is on track for a bullish engulfing week to snap a 3-week losing streak. And as it fell over 17% from the April high, it could pave the way for further gains in the coming weeks. However, there are plenty of resistance levels around the $80 that could spur bears from the side lines.
The May VPOC and VAH sit around Wednesday's high, and the monthly R1 and weekly R2 near the May high. So whilst another crack at $80 seems more likely than note, the $80 area could be an interesting area to fade into.
Strong support sits around $75.50, making it a viable target for bears and area for bulls to reconsider entering for an anticipated move above $80.

WTI off lows after earlier drop, but what now?Crude oil prices gave up their earlier gains, to turn modestly lower on the day after the release of the EIA weekly US oil inventories, before bouncing off their lows ahead of the FOMC rate decision. Watch the closing prices. A daily close in the red may lead to some follow-up selling in the days ahead, given that WTI has arrived and reacted negatively from the key $79 level.
Crude stocks came in at +3730K vs. -1025K expected and +1233K the week before. For gasoline, stocks came in at +2566K, significantly surpassing the expected +0.891K reading. Distillates, on the other hand, registered +881K against an anticipated +2147K. Refinery utilization saw a decrease of 0.4%, slightly more than the expected decline of 0.3%. Additionally, US crude imports reached their highest level since 2018, which may help explain the discrepancy in expectations.
Crude oil had staged a sharp recovery after hitting key support at $72.50 on Wednesday, before today’s struggles. The rally has been driven by hopes for increased fuel demand as the US driving season progresses. We have had a couple of stronger US macroeconomic pointers including the ISM services PMI and monthly jobs report that helped to reduce fears about demand weakness. Prices also found support from oversold conditions following a three-week decline that had been fuelled by concerns over Chinese demand and rising non-OPEC supply.
Today’s inventories figures were considered bearish by traders, and they sold oil after WTI had risen to test resistance and its bearish trend line around $79.
The lower highs suggest the short-term path of least resistance is still downward, until told otherwise by the charts.
In terms of support, the next important zone is between $76.00 and $76.50 for WTI, which had been both support and resistance in the past. If prices fall below this area, the bearish trend may resume, potentially triggering further technical selling.
Meanwhile the key resistance level to watch is around $79.00, give or take, where the trend line and the base of last week’s breakdown meet. This is where today’s rally has stalled for now. The bulls will need to see a close above here in order to initiate a move towards $80 and higher.
Written by Fawad Razaqzada, market analyst at FOREX.com
Follow me on twitter: x.com

WTI Oil - 4H Sell OpportunityThe WTI Oil chart shows a compelling setup for a short position. The price has rallied into a significant resistance zone around $79, coinciding with a strong downward trend line that has been respected multiple times. This area acts as a confluence of resistance, providing a high-probability entry for selling.
Given the persistent bearish trend, this resistance zone is likely to hold, reinforcing the potential for a downward move. The chart indicates that selling WTI Oil at this juncture offers a good risk-to-reward opportunity, aiming for a decline towards lower support levels as shown by the red arrows.

Monday/Tuesday Bullish.. Continuation on Wednesday? Hello Traders. The Monthly candle has flipped bullish and the weekly candle is pushing for new highs as the 3rd Asian session of the week kicks off here. Monday was super bullish and today's tuesday candle closed bullish after a late NY bullish push. We observed (4) 4hr candles print bearish consecutively only to be overshadowed by a large bullish candle that began it's ascent at around London close today. The Market is bullish and so continuing to look for longs up to the next 4hr level (79.00) is a scenario for the next session. Another scenario is we push to the 78.50 4hr level and then rollover towards (77.30) 4hr level. The market totally changed behavior after dipping into 73 Weekly Level. The last crude oil inventories, which was forecasted to see a decrease by 2.1m barrels, instead saw an increase and this lined up with a low in the market . The news was About 1.13$ off the low and has been a catalyst for this bullish momentum in the last few days. Interest rates, CPI and Inventories tomorrow will surely send the markets into an uproar so careful trading ahead.

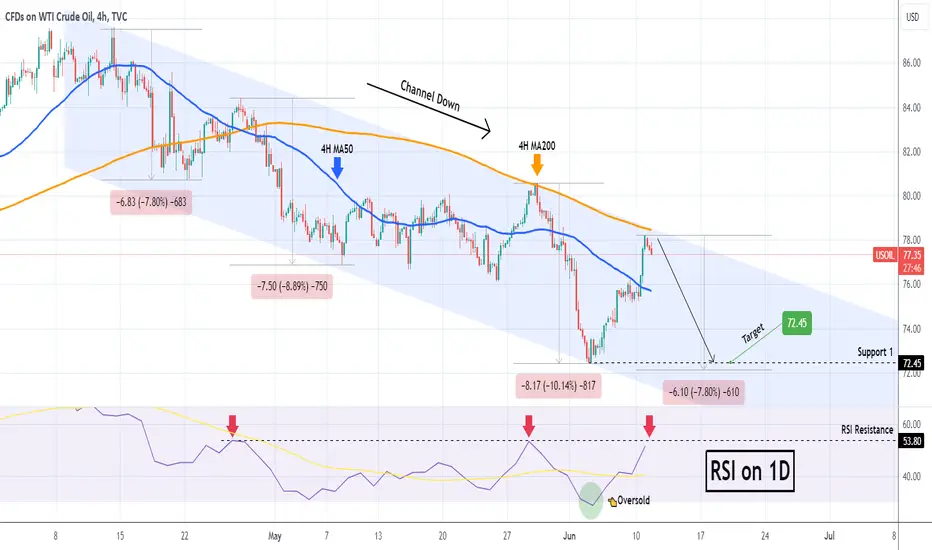
WTI OIL Sell signal at the top of the Channel Down.WIT Oil (USOIL) didn't disappoint last time we looked at it (June 05, see chart below) and delivered our buy signal, easily hitting the 75.70 Target:
The price is now at the top (Lower Highs trend-line) of the 2-month Channel Down and just below the 4H MA200 (orange trend-line), which is where the last Lower High was priced and rejected. At the same time, the 1D RSI is on the 53.80 Resistance, which was the level that priced the last two Lower Highs.
Technically this is the most optimal sell entry on this pattern. We have a modest target at 72.45 (Support 1), as despite the fact that a Lower Low is expected lower, the 1W MA200 looms as a Support and long-term may form a strong Support base. That remains to be seen, so for the time being we take only short-term targets.
-------------------------------------------------------------------------------
** Please LIKE 👍, FOLLOW ✅, SHARE 🙌 and COMMENT ✍ if you enjoy this idea! Also share your ideas and charts in the comments section below! This is best way to keep it relevant, support us, keep the content here free and allow the idea to reach as many people as possible. **
-------------------------------------------------------------------------------
💸💸💸💸💸💸
👇 👇 👇 👇 👇 👇
Hellena | Oil (4H): Long, correction to the area of 76.326.Dear colleagues, I have analyzed for a long time and came to the conclusion that the price will probably continue to decline, but at the moment I see that wave “3” is not formed yet, and therefore wave “4” is not formed either. Therefore, I expect a correction to the area of 76.326, but it is desirable that the price does not reach the level of 76.50, because this is the minimum of wave “1”.
Manage your capital correctly and competently! Only enter trades based on reliable patterns!

BRIEFING Week #23: Markets Keep ConcentratingHere's your weekly update ! Brought to you each weekend with years of track-record history..
Don't forget to hit the like/follow button if you feel like this post deserves it ;)
That's the best way to support me and help pushing this content to other users.
Kindly,
Phil

WTI rises to test key resistanceCrude oil prices rose on Monday, making back its losses from Friday and some. While there is hope for increased fuel demand as we head to the summer months, today’s recovery comes on the back of a three-week drop. Prices have been held back in recent weeks because of various factors, ranging from concerns over increased non-OPEC supply and worries about the demand outlook, due, among other reasons, to diminished hopes over imminent US interest rate cuts. The strong dollar recovery is also weighing on sentiment in the oil market. But with prices shedding more than 10% from their April highs, the bulls feel the downside could be more limited moving forward. However, a revisit of last week’s lows of around $72.50 on WTI remains the more probable outcome than a sharp recovery. Key macro events in this week include US inflation data and the Federal Reserve’s rate decision on Wednesday, both of which could significantly impact the US dollar and, consequently, buck-denominated commodities like gold and oil.
Oil prices closed off well off the lows last week
The crude oil selling resumed on Friday after a two-day pause. While the losses were milder than earlier in the week and less severe than the drop in metals, this was due to a strong jobs report and positive services PMI data that alleviated fears of weakening demand in the US. Nonetheless, concerns over China persisted, leading to lower prices for the week. Investors were also spooked by the sell-off in other commodities like copper and silver.
The selling on oil was also driven by speculative long positions being pared last week by managed funds and large speculators. Not only that but they also increased their short positions last week, resulting in a decrease in net-long exposure. According to positioning data from the CFTC, managed funds increased their short positions by 27.2k contracts, while large speculators increased theirs by 22.1k contracts (21.9%). This positioning data reflects the market response to OPEC's decision to extend oil production cuts. It suggests that traders either anticipated more aggressive support for prices from OPEC, are concerned about declining demand due to a slowing economy, or likely a combination of both factors.
Why did all major commodities fall on Friday?
The sharp fall in major commodity prices on Friday was driven by a rally in the US dollar, which negatively impacts dollar-denominated commodities. This rally was triggered by stronger-than-expected jobs growth, even though part-time jobs contributed to this increase. Metals were already under pressure prior to the jobs report due to concerns over lower-than-expected Chinese demand for industrial metals and rising copper stockpiles. Additionally, the People’s Bank of China halting its gold purchases in May after an 18-month streak also pressured precious metals, contributing to bearish sentiment in the commodities market.
What has been driving oil prices recently?
Oil prices have been primarily driven lower by demand concerns and an increase in non-OPEC supply. According to the International Energy Agency (IEA), there is a significant surplus of oil this year, largely due to the growth in US shale production. Consistently weak manufacturing data worldwide has heightened demand concerns. This was particularly evident when crude oil prices dropped to their lowest level since February following weak US factory data. The OPEC+ decision to extend output cuts failed to support oil prices as it was already priced in, and there are worries about phasing out voluntary output cuts amid rising non-OPEC supply. However, with the US driving season underway, demand might pick up, potentially slowing or reversing the sell-off.
Currently, no strong bullish reversal signs have been observed, however, which means the short-term path pf least resistance on oil remains to the downside.
Crude Oil Technical Analysis
The recent drop in oil prices has established a clear resistance level between $76.00 and $76.50 on WTI, which was tested and held on Friday. This will be a crucial resistance area to monitor in the coming week.
As long as prices remain below this zone, the bearish trend is expected to continue. There was an oversold bounce last week, but a decline towards the support trend of the bearish channel, around the $73.00 mark or slightly below, is possible this week. WTI has been stuck in a bearish channel since peaking in April. The next major support level below the bearish channel is at $70.00, followed by the December low at $67.87.
However, if WTI were to reclaim the old broken support area between $76.00 and $76.50, it could signal a bullish trend, potentially leading to technical buying towards the top of the bearish channel, between $78.00 and $79.00.
Written by Fawad Razaqzada, market analyst at FOREX.com
Follow me on twitter: x.com

WTI Oil H4 | Potential bearish reversalWTI oil (USOIL) is rising towards a pullback resistance and could potentially reverse off this level to drop lower.
Sell entry is at 76.59 which is a pullback resistance that aligns with the 50.0% Fibonacci retracement level.
Stop loss is at 79.00 which is a level that sits above the 78.6% Fibonacci retracement level and a pullback resistance.
Take profit is at 74.21 which is a pullback support.
High Risk Investment Warning
Trading Forex/CFDs on margin carries a high level of risk and may not be suitable for all investors. Leverage can work against you.
Stratos Markets Limited (www.fxcm.com):
CFDs are complex instruments and come with a high risk of losing money rapidly due to leverage. 68% of retail investor accounts lose money when trading CFDs with this provider. You should consider whether you understand how CFDs work and whether you can afford to take the high risk of losing your money.
Stratos Europe Ltd, previously FXCM EU Ltd (www.fxcm.com):
CFDs are complex instruments and come with a high risk of losing money rapidly due to leverage. 70% of retail investor accounts lose money when trading CFDs with this provider. You should consider whether you understand how CFDs work and whether you can afford to take the high risk of losing your money.
Stratos Trading Pty. Limited (www.fxcm.com):
Trading FX/CFDs carries significant risks. FXCM AU (AFSL 309763), please read the Financial Services Guide, Product Disclosure Statement, Target Market Determination and Terms of Business at www.fxcm.com
Stratos Global LLC (www.fxcm.com):
Losses can exceed deposits.
Please be advised that the information presented on TradingView is provided to FXCM (‘Company’, ‘we’) by a third-party provider (‘TFA Global Pte Ltd’). Please be reminded that you are solely responsible for the trading decisions on your account. There is a very high degree of risk involved in trading. Any information and/or content is intended entirely for research, educational and informational purposes only and does not constitute investment or consultation advice or investment strategy. The information is not tailored to the investment needs of any specific person and therefore does not involve a consideration of any of the investment objectives, financial situation or needs of any viewer that may receive it. Kindly also note that past performance is not a reliable indicator of future results. Actual results may differ materially from those anticipated in forward-looking or past performance statements. We assume no liability as to the accuracy or completeness of any of the information and/or content provided herein and the Company cannot be held responsible for any omission, mistake nor for any loss or damage including without limitation to any loss of profit which may arise from reliance on any information supplied by TFA Global Pte Ltd.
The speaker(s) is neither an employee, agent nor representative of FXCM and is therefore acting independently. The opinions given are their own, constitute general market commentary, and do not constitute the opinion or advice of FXCM or any form of personal or investment advice. FXCM neither endorses nor guarantees offerings of third-party speakers, nor is FXCM responsible for the content, veracity or opinions of third-party speakers, presenters or participants.

#202424 - a weekly price action market recap and outlook - oilGood Evening and I hope you are well.
wti crude oil futures
Quote from last week:
bear case: Bears sold 80 again and will probably take profits here at 77 or try to get 76 again. If they get a breakout below, we will probably test 75, which is a price I thought we would test for 5-7 weeks now. It’s a bad sell here at 77 for bears so best they can get is sideways movement.
comment: Fair to say that bears surprised me big time on Monday with the huge follow through selling through previous bigger support. 72 stopped the fall and created an expected bounce. I do think this was W5 and my bearish targets are all met for now. Market should move sideways to up from here. On Friday we got a perfect retest of the breakout price of 76 and that was resistance for now. Worst case scenario for bulls would be to stay below 76. The bull trend line will get retested and should hold for now.
current market cycle: Bear trend which could transition into a trading range here
key levels: 72-78
bull case: The best the bulls can hope for, is for the lows to hold and to move sideways and hit the daily ema again. They failed at keeping it above 75, which was huge support. Last bear leg inside this bigger trading range was 11 weeks long from high to low and we are currently at 9 weeks. Bulls will want to find support here around 70-72 and trade back up to at least 78 over the next 8-12 weeks.
Invalidation is below 71.
bear case: Huge bear surprise imo on Monday and bears want to keep it max bearish and they will do that by keeping the market below the breakout price around 76 and below the daily ema. They want a retest of 72.5 again and poke the bull trend line enough for bulls to give up there. If they actually get an acceleration of this bear trend, which is the low probability thing, they could retest 70 next and below 70 comes 67 as support.
Invalidation is above 80.5.
outlook last week: “R:R is on the bull side here at the bottom of this range. I wait for confirmation on Monday before going long for 80 again. Below 76 we could get to 75 but that would require strong momentum for me to go short down here.”
→ Last Sunday we traded 76.99 and now we are at 75.53. High of the week was 77.52 so the uber bearish price action, was surprising to me. I did not advise you to be bullish, unless there confirmation for the bulls and obviously that did not happen. So my bearish target of 75, if we go below 76, was alright but way too short of 72.48. Not a good outlook.
short term: Neutral because I think we will hit the daily ema again and a retest of 72.5ish. I am not a fortune teller so I don’t know which comes first.
medium-long term: We are seeing the big triangle playing out between 73 and 83. The high of the triangle got tested until mid of April and we have now tested the lows around 72.5. Market will probably move more inside this big range until we get a new big cycle to either side.
current swing trade: None
chart update: Added my pretty bear channel, adjusted 5-wave series and added a two-legged pullback, which we are probably in as of now. The red ABC is how I imagine it to play out price-wise, not time wise. We should see a retest of the lows as well as the daily ema. I don’t know which comes before what or when. Also adjusted the big bear trend line from 2022.

USOIL Trading IdeaBased on Simple Technical Analysis ( Trendline + Support & Resistance )
Risk Disclaimer:
Please be advised that I am not telling anyone how to spend or invest their money. Take all of my analysis as my own opinion, as entertainment, and at your own risk. I assume no responsibility or liability for any errors or omissions in the content of this page, and they are for educational purposes only. Any action you take on the information in these analysis is strictly at your own risk. There is a very high degree of risk involved in trading. Past results are not indicative of future returns. Good luck :-)

CRUDE OIL (CL): Weak Momentum Likely to Persist?Assalamualaikum wbt and Good Day to fellow traders!
From my rather simplistic view, the overall two-hour time frame (TF2hr) chart seems to indicate that the prices for WTI Light Crude Oil ( NYMEX:CL1! ) could go further south at least for the time being.
The further potential weakness is being reinforced by the significant key moving averages (in this case Exponential Moving Averages or EMAs ) - the EMA50 (blue line) and EMA200 (amber line) - in which the Black Gold sits below those lines since April 17, 2024.
Despite several rebound attempts, the commodity has continued to slide downwards making some notable Lower Lows and Lower Highs until recently last Friday while trading range-bound in between.
In addition, the Moving Average Convergence Divergence (MACD) indicator also flashed a cautious sell signal last Friday following a cross over.
On top of that, the obvious rejection at the 76.03-76.30 key level could possibly suggest that the bearish momentum is still in play.
However, a bullish reversal may occur should the MACD crossover take place above the 0 line with the help of a significant volume, as well as the two EMAs crossing up.
Wallahu a'lam.
#cl #crudeoil #wti #blackgold #exponentialmovingaverage #ema #macd
