US OIL Analysis 27Aug2023US Oil analysis looks positive last week. price drops towards SnD area. if you look at the closing of the week the price was corrected but unable to form a new HH, chances are that next week the price will continue its bearish trend.
Wtianalysis

WYI overall analysis
The overall trend of crude oil yesterday was like a roller coaster, but last night it formed a V-shaped reversal. It fell below the 79.5 resistance within the day and rebounded again, but failed to break through the previous day's low of 77.6. We went long at the low point of 77.6, and successfully ushered in a big rise, with a stop profit of 78.6! From the daily line, the moving average is still in a short position, but the two closing lines are very long, indicating that the double-bottom support below 77.6 is effective, mainly because H4 came out of the stop loss trend and then fell back. A golden cross appeared on the moving average, and oil prices fell. If it breaks through the middle rail, the adjustment of crude oil is over. You can safely look at the points around 78.6, increase your position at 78.1, hold 77.6, pay attention to 79.5-80.1, and continue to increase your position.

US OIL WTI Analysis 17Aug2023Prices move towards Fibo Extensions 1, which intersect with Fibo Extensions 1,618, and then there is currently a correction. If the Elliot notation is still appropriate, then the price should be there at this time, Wave 4. With there still being the potential for bullishness, you can find an area for Long in SND below.

US Oil / WTI Analysis 30July2023Following last week's analysis, still in accordance with the price movement for next week. US Oil still looks very bullish with a tilt trend close to 45 degrees and at the closure of the week with full bullish candle shows the support of the buyer is still very strong. The closest target is currently in the price range of 83-84 which at that price is in contact with 2 areas of Fibo Extensions (Fibo Cluster)

WTI OIL / US OIL AnalysisUs oil is quite interesting. The movement is now in accordance with the analysis that I gave a few weeks ago.
There are things that are repeated here, namely the price of forming a curve bullish again. The possibility is the price of bullish is quite high, if we pull the fibo extension, then the possibility of the price of pursuing fibo extensions 1. Fibo Extension 1 is more or less parallel to Fibo Extensions 1,618 from Wave 1. Could be, Wave 3 will move to the area. Take the opportunity to Long when the price is corrected.

WTI ANALYSIS after change of charatcter we will see a retracement of the price to fill FVG '' FareValueGAp'' and retest ob ''order block'' after we will see a continuation to wards supply zone

WTI US OIL Analysis 13July2023the sideways area has been successfully passed, there is a possibility that the price will retrace to the support area and resume the bullish trend again with the nearest target at $77.

US OIL AnalysisIf this elliot notation is correct, then the oil price may rise in the next few weeks, it could be the beginning of a long bullish trend.

🚨 WTI HIGH PROBABILITY SELL SETUP SOON 🚨🚨 WTI HIGH PROBABILITY SELL SETUP SOON 🚨
* Here we can see clearly the next potential moves for West Texas Intermediate Crude Oil, in coming days or week.
* Im thinking there might be a Down Trend Move happening FIRST to form the Inverse Head & Shoulder Reversal Pattern before the Huge Bullish Move to Up Trend.
* I've labelled where i can see the Inverse Head & Shoulder that MIGHT happen or not.
* I've got Multiple SELL trades to look at.
* First SELL position is going to be a quick SCALPING move to execute.
* EP(SELL): 70.263
* TP: 69.910
* No SL provided for this trade, use your own discretion.
* Nest EP(SELL) is for the Next potential Big Drop to form the Shoulder.
* EP(SELL): 69.623
* TP: 68.951
* TP2: 68.016.
* No SL provided for this trade, use your own discretion.
* Keep your eye close on your trading positions.
* Happy pip hunting traders.
* FXKILLA *

🚨 WTI HIGH PROBABILITY BUY SETUP 🚨🚨 WTI HIGH PROBABILITY BUY SETUP 🚨
* Here we can see clearly the next potential move for West Texas Oil in coming trading week.
* It's going to be worth keeping a close eye on this trade, as WTI can generate tremendous profits if it is right trade.
* EP(BUY): 69.701
* TP: 70.747
* TP1: 71.550
* TP2: 72.153
* SL: 68.547
* Keep your eye close on your trading positions.
* Happy pip hunting traders.
* FXKILLA *

WTI sideways opportunity 12June2023WTI OIL
Is there an opportunity?
looking at the market structure in the last few weeks there has been a sideways with a fairly high distance.

USOIL Top-down analysis Hello traders, this is a complete multiple timeframe analysis of this pair. We see could find significant trading opportunities as per analysis upon price action confirmation we may take this trade. Smash the like button if you find value in this analysis and drop a comment if you have any questions or let me know which pair to cover in my next analysis.

WTI Crude Oil Sell TP = 42.67On the weekly chart, the trend started on March 13, 2022 (linear regression channel).
There is a high probability of profit, since the channel is not yet closed. A possible take profit level is 42.67 ( this is the minimum take profit value, but it has a high percentage of payoff ).
But don't forget about SL = 98 .
Using a trailing stop is also a good idea!
Please leave your feedback, your opinion. I am very interested in it. Thank you!
Good luck!
Regards, WeBelieveInTrading

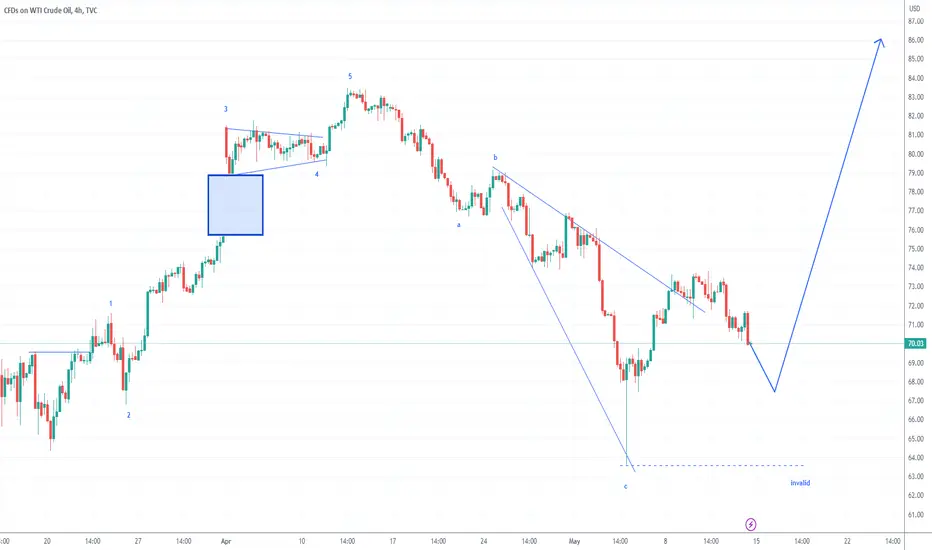
US OIL 3June2023I assume that if wave 2 is complete, and I draw a fibo extension from wave 1 to wave 2, then the distance of wave 3 if we take it at the level of 1.618 it will be parallel to the previous HH level. I believe the price is likely to continue to rise, and will look for the right area to buy.

US OIL 14May2023I see the Gap that occurred a few weeks ago as the initial gap of a bullish trend. if this wave notation matches, and the price doesn't fall more than the invalid area, it's a good idea to look for an area to buy again. most likely the price will go up very much
WTI may bounce off the support!!Instruments : WTI
Possible direction : Bullish
Technical Analysis : Early this month WTI opened with big gap up and signaling possible trend change. After long consolidation, WTI filled the gap and currently bouncing off the support level. It is highly likely that WTI may change trend and continue to uprise. A bullish trade is high probable.
Possible trade recommendation : Bullish as per sketch.
Press like button if you enjoy.
Risk Disclaimer: Trading foreign exchange on margin carries a high level of risk, and is not suitable for all investors. Past performance is not indicative of future results. The high degree of leverage is dangerous and can work against you as well as for you. Before deciding to invest in foreign exchange or any market you should carefully consider your investment goals, level of experience, and risk tolerance. It is EXTREMELY LIKELY that you will sustain a loss of some or all of your initial investment and therefore you should not invest money that you cannot afford to lose. No representation is being made that any account will or is likely to achieve profits or losses. Past performance is not indicative of future results. Individual results vary and no representation is made that clients will or are likely to achieve profits or incur losses comparable to those that may be shown. You acknowledge and agree that no promise or guarantee of success or profitability has been made between you, and Forex Trading Wizard. Do your own research and talk to a professional financial planner in order to be aware of all the risks associated with foreign exchange trading and investing and seek advice from an independent financial advisor before risking any capital.

USOIL:$78 next week is crucial
On Tuesday this week, the testimony of the Chairman of the Federal Reserve before Congress raised concerns about risk assets in the market. In this testimony, Powell stated that "if it is necessary, the Federal Reserve is prepared to speed up the pace of interest rate hikes, and terminal interest rates may be higher than expected." These words indicate that the Federal Reserve not only did not cool down the rising expectations for interest rate hikes over the past month, but also further pushed up the expectations for interest rate hikes.
Powell's speech caused shock in the market, as the market saw from Powell's speech a determination to lower the inflation rate at the cost of suppressing demand and employment. On that day, the US dollar index soared, risk appetite deteriorated, and US stocks fell sharply, accompanied by a sharp drop of 4% in oil prices from above $80 per barrel.
However, there was a reversal in oil prices on Friday. After testing the support at $74.5, the market quickly rebounded above $76 and successfully stabilized. Our long position in crude oil at $75 also reached the first take-profit level smoothly. However, there is still a certain distance from the recent high of $80, and the upper resistance level to watch is in the 76-78 area. This dense resistance area may limit the upward space. But if it breaks through $78, there will be an opportunity to challenge the $80 level again. Let's keep an eye on it, and I will update the trading strategy in a timely manner.
I have in-depth research on futures products such as cryptocurrencies, foreign exchange, stocks, gold, and crude oil, and I also update daily trading strategies. Thank you for your attention and likes. If you have any questions, please leave a message, and I will provide the most secure advice to help you.

USOIL: Long position after a downward adjustment to $77
Despite the unexpected drop in API crude oil inventory providing support to oil prices, the hawkish speech by the overnight Federal Reserve Chairman has continued to help the US dollar index soar, which has raised concerns about economic recession and continued to put pressure on oil prices. Although there is a chance for the oil price to rebound and adjust after the overnight plunge.
Looking at the daily chart of USOIL, the upward trend has not been broken, and the support below has continued to rise. Although there is no effective breakthrough above $80, the adjustment range of this downward trend is sufficient, and it is a good opportunity to enter the long position again.
Personal trading strategy: Buy long position near $77-77.5, with the first target at $78.5 and the second target at $80, and pay close attention to the EIA data to be released tonight.
I have in-depth research on futures products such as cryptocurrencies, foreign exchange, stocks, gold, and crude oil, and I will also update some daily trading strategies. Thank you for your attention and likes. If you have any questions, please feel free to leave a message, and I will provide the most secure advice, hoping to help you.

WTI: It all comes down to the green… 💵🌿It all comes down to the green . This saying is especially true for WTI as it has yet to dive into the green zone between $70.12 and $35.77. To get this done, the course should push further off the upper side of the turquoise trend channel and drop below the support at $70.08. This should grant WTI direct access to the green zone, where it should finish wave 2 in green before heading northwards again. However, a 32% chance remains that WTI could turn upwards and climb above the resistance at $82.64, in which case the course would develop wave alt.(b) in blue above the upper resistance line at $93.74 first before resuming the descent.

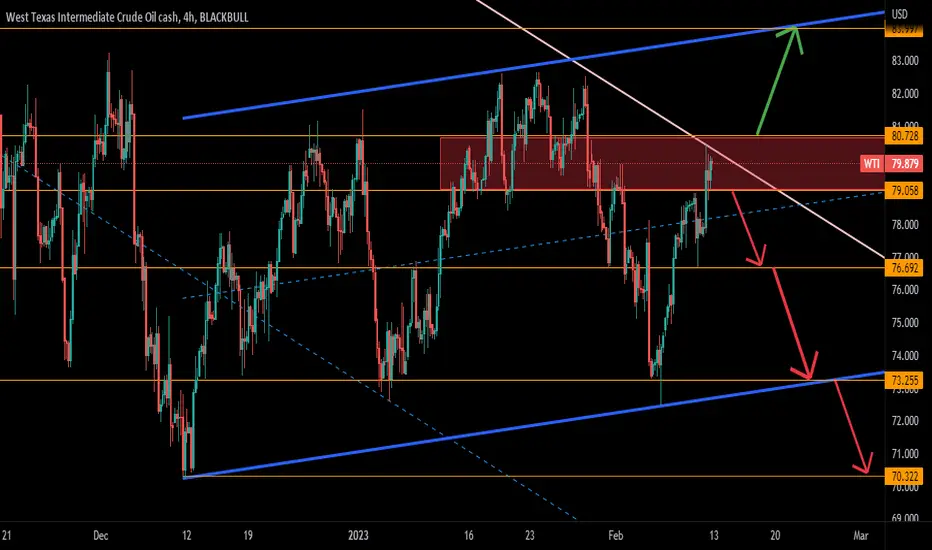
WTI update on the 4 hour chartOil analysis update
= The analysis is based on trend analysis and the Dow Laws
= The area from level 80.728 to level 79.058 is not suitable for trading and it is a dangerous area
= strong scenario
Exceeding the level 79.058 to the bottom, the targets are 76.692, then 73.255, then 70.322
= weak scenario
The level exceeded 80.728 to the top, targeting 83.997
WTI: CRUDE OIL TREND OUTLOOKLet's look to Wti.
It moved up in the past weeks. But I think that trend is weakening and downside movement is possible soon.
Because, Crude Oil is reaching to strong level - 83.83!
What should we do in this case?
1. Place sell stop order at 81.52
2. First target is 76.98
3. Second target is 73.16
4. Stop Loss is necessary at 83.50
But if it will continue upward movement? Then, we need place buy stop order also:
1. Open buy stop at 83.65
2. Target is 86.98
3. Stop is 81.01
That's all for today. Let's wait and see what will be happen in next days.
Good luck!

WTI Oil Long...WTI Oil Buy... This is not signal... Dont risk more than 3% of your account on any trade...

WTI or USOIL (XTIUSD): BUY analysisWe can see WTI price jumped up as our prognosis here:
Now, what will be happen?
Price tested upper level on the chart and it will not stop here or it will continue its nonstop movement.
Hereby, WTI confirms own strenght. This is very gratifying occasion for us, because we love WTI trading.
So, today WTI broke up trend channel to upward. You will see on the chart. We need draw new channel for further explanation. OIL was moving between blue-green channel and it is entering to red trend channel. I marked these channels on the chart. It tries to create a new channel by choosing the correct entry point.
What is next level?
I think that, WTI will continue own movement until it reachs to 82.35. Because, this point is keypoint and strong level also. On the technical side, this is non-breaking level. But we think that this barrier can be broken, taking into account the volatility of the oil price (of course, if there is no strong fundamental or strategic news).
You can open a BUY operation by setting a stop loss. It is possible to set 82.30-82.35 as a target. Let's trade and see what will happen in the coming days.
