USOIL WTI Technical Analysis And Trade IdeaIn this video, we conduct a comprehensive analysis of the USOIL market, with a primary focus on the prevailing bearish sentiment observed in higher timeframes. Notably, WTI has recently approached a critical support level. Throughout the video, we delve into essential elements of technical analysis, which encompass aspects such as the current trend, price action dynamics, market structure, and various other fundamental components of technical analysis. As we progress through the latter part of the video, we closely examine a potential trading opportunity.
It is crucial to emphasize that the information presented here serves exclusively for educational purposes and should not be construed as financial advice. Engaging in currency market trading carries a significant level of risk. Therefore, it is imperative to prudently incorporate risk management strategies into your trading plan.
Wticrude

Target 95
The conflict escalation target is looking towards 95. The short-term (1H) trend of crude oil fell to the 85.50 support, and continued to rebound and hit new prices. The short-term subjective and objective trends consistently maintain an upward rhythm. Crude oil is expected to continue rising during the day. If the conflict in the Middle East escalates again during the weekend, the target will be 95.

Crude oil gets a chance to rise
Crude oil targets resistance at $88. The important level after that is $90, which is a resistance level that the market needs to break. The prevailing sentiment suggests that it is only a matter of time before the market rises to these levels.
Crude oil also found support from the 50-day moving average below, which acted as a stabilizing force. Additionally, the 200-day moving average provides a fundamental "bottom" for the market, which reinforces the idea of an upward bias.
In addition, market sentiment due to the escalation of the conflict and the Iranian oil embargo have provided rising factors for crude oil.
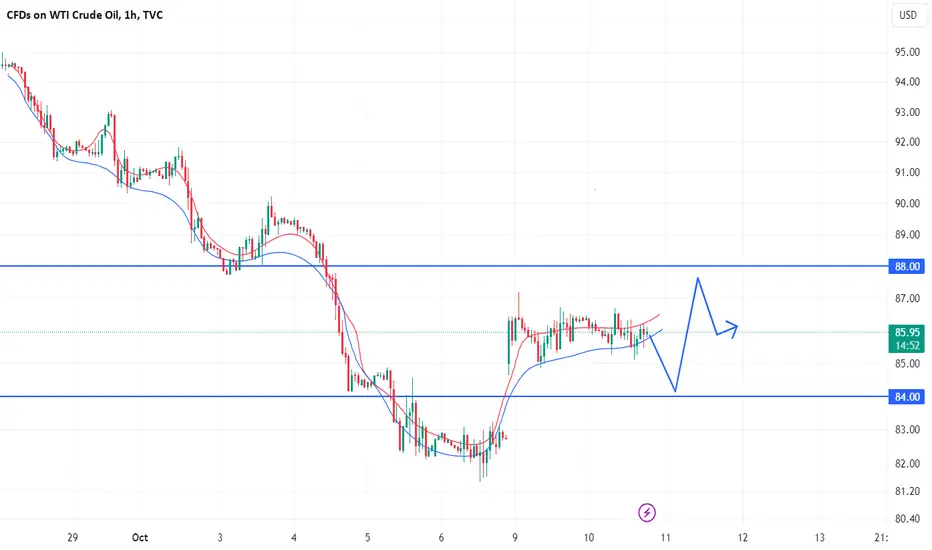
Crude oil resistance level focuses on 88, support level focuses on 86

Crude Oil - Elliott Wave CountCrude Oil - Elliott Wave Count
Based on the current market trends, it appears that there is a bearish sentiment prevailing. As a result, it is likely that we may witness a decline in the value of the asset to 85 or below. It is important to note that we have set our stop loss at today's high, which means that if the price breaks above this level, we will exit the market.
Please note that this information is for educational purposes only, and it is crucial to trade with caution.
MCX:CRUDEOIL1! NYMEX:CL1! TVC:USOIL CAPITALCOM:OIL_CRUDE MCX:CRUDEOILM1! EASYMARKETS:OILUSD

Crude oil target 90
Market analysis
In the last post, we talked about the US crude oil market maintaining the price of crude oil to a certain extent, but the impact of the conflict in Pakistan on the crude oil market completely covers other market conflicts, and crude oil is bound to rise.
Technical analysis
After crude oil rose to 88.3, the short side gradually took over the main direction. From a larger level, it can be observed that the oil price just encountered resistance at the upper edge of the flag relay and fell back.
Crude oil is bullish given the ongoing conflict.

Bulls profit, market slowly rises
The Israeli-Palestinian conflict supported gains in oil prices, but mail will slowly rise until there is no further conflict. Crude oil was blocked at the 21-day moving average. Secondly, the International Energy Agency (IEA) said last week that oil prices have fallen recently from their highs in late September, reflecting declining demand, especially in the United States. These market conditions have restrained the sharp rise in crude oil.
However, conflicts in the Middle East will lead to a shortage in the crude oil market, which is also the biggest reason for the rise in crude oil.
The overall bullish target for crude oil is whether it can break through the 89 and 91 resistance levels

Oil prices will rise to 100
The conflict may escalate further, and Iran warned Israel not to expand the situation, otherwise it will join the war. Once Iran joins the war, oil prices will skyrocket.
Last week, due to the conflict, oil prices rose to close at 87.72. On Monday today, the opening momentum of oil prices has slowed down. On the one hand, it is due to some profit-taking. On the other hand, because the conflict and risk aversion fluctuations have been completed, the market is waiting for further factors to promote;
Technically, the daily chart of oil prices rebounded sharply and closed positive last Friday, and today it is also running above the mid-track. The bearish signs continue to shrink and the bullish trend is getting stronger. The weekly chart has also returned to above the short-term moving average support.
The current support levels for crude oil are 87.20 and 86.05. Resistance levels are 88.70 and 90.00.

WTI Long Trading SignalIsrael-Hamas Conflict Fuels Uncertainty in Crude Market. Oil prices rise amid Israel-Hamas conflict, with risks of surpassing $100 and potential U.S. sanctions on Iran adding to market volatility.
1. The price closed above the Trend Magic Indicator line. Strong long signal.
2. Vortex will cross and indicates strong uptrend signal.
SL - below the Trend Magic Indicator line or Vortex indicator change trend direction signal
TP- 94.90
Keep It Simple and Always Trade With the Trend!
Please, Support Our Work with Like & Comment! Thank You!

USOIL DOUBLE BOTTOM ? BULLISH MOVE VERY SOON Hello traders ,
on daily TF USOIL has formed a double bottom reversal pattern and broke its neckline.
and also because the tension in the middle east and the current dollar economic situation
we might see a bullish move from the neckline maybe back to the 93 level.
trade safe !

WTI CrudeoilOwing to geopolitical tension around the globe, can expect WTI to trade around 90$ during next week. In 15mins chart, we can see the ''W'' recovery pattern. Can expect an upside movement to 90$. If the situation worsens in war, it will move beyond that.
Disclaimer : Trade as per your risk level.

US OIL / WTI Analysis 13Oct2023Over the last few weeks, the price of oil has experienced a noticeable decline. Upon closer inspection, this trend appears to be the result of a series of corrections from the previously bullish market. Currently, there is speculation surrounding the possibility of Wave (C) occurring, which is being analyzed through the addition of Fibo Expansion. It is predicted that the price will likely move towards the 76 area, which intersects with Fibo 0.786 and the SND area. This level of detail provides a more comprehensive understanding of the current market trends and the anticipated future movements of oil prices.

Crude Oil (CL) Gap Fill LongWhile it's unclear whether crude, which has experienced large moves recently on account of the developing conflict between Israel-Hamas, wants to trade higher or lower over the longer-term, we’re looking to take near-term longs after filling the downside futures gap formed 10/6. We’re only showing down to a 30-minute chart here, but there are some smaller supply/sell zones @ ~84.25-84.75, which could be used for initial profit targets. If the trade works for a bounce, you can also consider applying mechanical targets @ 1:1, 2:1, 3:1, etc. Regarding an exact entry price and stop loss placement, the gap fill demand zone is a bit messy. The closing price of the gap itself, technically, is 82.81, so ideally we’d see CL trade to that #. However, markets aren’t always THAT precise, so it could put in a low at a slightly higher price. Furthermore, stop placement really depends on the timeframe used. The “distal” (lower bound) line of the daily demand/buy zone is 81.50, so if you can afford the risk, a physical stop could be placed below (never align your stops exactly w/ a zone’s range + don’t use whole numbers/quarters). More conservative placement could be slightly below 81.71 or 82.31, but there’s a higher chance you’ll be stopped out; depending on account/position size and risk tolerance, you can always deploy a “small loss, reenter” strategy. If you’re nimble enough, consider using a micro timeframe (single-digit minute, tick, or volume-based chart) to ID a trend reversal signal (higher high, higher low) before entering. If CL violates recently formed daily demand (82.81-81.50), be aware that there are “bear trap” areas waiting just beneath. Entries within the corrective segment of the uptrend that began in late-June are valid until prices breech the 77.59 pivot.
As always, feel free to provide feedback and/or ask questions. Good luck, be smart, and enjoy the journey!
Jon @ LionHart Trading

Crude oil fluctuates today
The Palestinian-Israeli conflict has killed more than 1,600 people! Crude oil rose more than 4% and may continue to rise in the future.
After the Palestinian-Israeli conflict, it was in a range, with the lowest of 84.6 and the highest of 87.2 that day. The daily line closed at 86.3. From the daily line, oil prices will continue to rise. The top continues to pay attention to the breakthrough of 87. On the four-hour line, the Bollinger Track is parallel. , showing a volatile upward trend, the hourly line, the Bollinger Band narrowed in parallel, and oil prices will remain range-bound in the short term. In summary, intraday operations are dominated by shocks, let’s first look at the 84-88 range.
Crude Oil Rising Momentum🛢️ CRUDE Oil!
⛽Price rebounds from $83 to $88 amid Middle East tensions and oil supply threats. 🌍 Geopolitical risks loom large; brace for a potential breakout!

WTI | CRUDE OIL - Trading OpportunitiesWTI is the focus for this week. Watch the video to understand how, from a higher time frame, like the Weekly chart, we can find tradeable opportunities on the hourly chart.

WTI Crude Oil Fundamental Analysis + Trading Plan WTI Crude Snaps Two-Day Slump Amid Shifting Global Dynamics and Weaker USD
The West Texas Intermediate (WTI) crude oil benchmark showed signs of resilience, bouncing back from a two-day decline to reach $82.85 per barrel, marking a 0.40% gain. This uptick came as the US Dollar (USD) experienced a retreat, ending its 12-week rally. While robust US job growth figures impressed with a 336,000 rise, hints of a potential pause on rate hikes by Federal Reserve officials added an element of uncertainty. Russia's decision to lift its diesel export ban and a dip in US oil rigs further complicated WTI's supply-demand dynamics.
WTI Benefits from USD Weakness and Russian Supply Shifts
At the time of writing, WTI was trading at $82.85 per barrel, with modest gains of 0.40%. The resurgence in oil prices was attributed to the broader weakness in the US Dollar (USD). USD buyers booked profits ahead of the weekend, causing the US Dollar Index (DXY) to post weekly losses, ending its 12-week rally.
While recent US economic data was supportive of the US Dollar, the overextended uptrend indicated a potential mean reversion. Notably, US job growth in September soared by 336,000, a figure that exceeded estimates and the previous month's data.
Federal Reserve officials have remained relatively reserved in response to the US Nonfarm Payrolls report, which could justify the need for higher interest rates. However, San Francisco's Fed President Mary Daly suggested that the recent increase in Treasury yields might already be addressing some of the Fed's concerns. She noted, "The recent rise in Treasury yields is doing some of the work for the Fed, and if that doesn't reverse and inflation continues to cool, the Fed can leave rates on hold."
Russia's Move Eases Supply Concerns
Russia played a crucial role in providing some relief to oil prices as it lifted its ban on diesel exports, particularly for supplies delivered to ports via pipelines. This decision had a cushioning effect on WTI's upward movement, as it introduced a potential increase in supply.
On the front of oil data, the number of US oil rigs decreased by five to reach 497 during the week, marking the lowest level seen since February 2022. This development, reported by the energy services firm Baker Hughes, added to the evolving dynamics in the oil market.
As WTI navigates a complex landscape of supply dynamics, global economic headwinds, and shifting USD trends, the oil market remains a focal point for investors and analysts alike. The balance between supply and demand, coupled with external factors like currency movements, will continue to influence WTI's price trajectory in the near future.
Our preference
Short positions below 91.30 with targets at 77.50 & 74.00 in extension.
When the price Will reach the 74.00 Extension target , than :
Go Long.

OIL CRUDE ASCENDING BROADENING WEDGESOil price has formed a ascending broadening wedge the bottom is possible in. This might be a decent swing with a tight stop loss below the trendline.

Dirty practices of corporate forecasts portrayed in the mediaOn Tuesday, we touched on the subject of corporate forecasts in the oil market portrayed in the media. In fact, we remarked how the recent announcements of ultra-bullish forecasts were very reminiscent of the 2022 oil market top and that we were pretty skeptical about the rally's sustainability (though we warned about this on a different platform three weeks sooner). Fast forward to today, and we can see that oil is down from nearly $95 a week ago to less than $84 today (down more than 12%). With this price action following recent upgrades for the oil price by various financial entities, we would like to point out a few similar news articles in the past, which often preceded the trend reversal to the opposite direction of the forecast. While we can only speculate whether it is intentional or not, we have seen these practices taking place for years, with big players coming to tell retail investors to buy near the market top or sell near the market bottom. The following presentation aims to advocate that one should always do their own research rather than rely on the opinion of others whose true intent or trading strategy is unknown.
Illustration 1.01
Illustration 1.01 shows some of JP Morgan’s forecasts in the past year or so, written as articles published by various media outlets (keep in mind that we are not showing all of the forecasts; there were some that were actually fulfilled).
Illustration 1.02
Illustration 1.02 displays more corporate forecasts from JP Morgan.
Technical analysis
Daily time frame = Bearish
Weekly time frame = Neutral (turning slightly bearish)
Please feel free to express your ideas and thoughts in the comment section.
DISCLAIMER: This analysis is not intended to encourage any buying or selling of any particular securities. Furthermore, it should not be a basis for taking any trade action by an individual investor. Therefore, your own due diligence is highly advised before entering a trade.

Crude Oil (WTI)This looks like it is poised to head back into a well established $70-$80 range (and then some!). Anticipated long-term USD strength, as well as extended Global economic weakness bodes well for an enduring price weakness outlook.
Technically, Crude is at a major pivot, both, at the top of a rising daily channel, as well as at the top of a descending weekly channel trend line, resulting in a significant confluence region - both of those having price-negative connotation.
The Daily (main signal);
SHORT on any reversal!
... and the 240 min. (secondary signal);

Oil (CL) Aggro/Oversold Fade BUYQuick take/analysis, but consider scooping some low-risk crude contracts here (break above 84.84). Better demand zones are lower, but we've had a sizable downdraft into buy areas + are testing a key support/resistance area (~84-85), so those traders may be at our backs. The US dollar has finally taken a pause at the supply zone we ID’d in posts from earlier this week/last week, so that may help commodity, including CL, longs. Keep this one a tight leash; the bounce we’ve had thus far has been tepid, a micro timeframe higher high/higher low hasn’t yet been put in , and daily/weekly “demand” is lower still (low-80s/upper-70s). That said, CL is certainly a trade to put on your radar. Given the technical structure of the recent selloff, consider taking any profits at 1:1, then 86, 87, and 88+. Again, better buys are lower, but start paying attention/stalking longs as remaining profit margin for short sellers is a lot smaller than it was at the beginning of the week (though there is still some downside risk)!
Happy trading!
Jon @ LionHart Trading

Crude oil returns to 100
The latest consolidation in oil prices appears to be over, with both Brent and WTI posting solid gains. There are currently no signs of increased supply from major producers, and economic data continues to support the idea of more growth.
Crude oil has now reached 95.04, which has exceeded our expectation of 93.5. Under the current market conditions, crude oil will slowly rise to 100.
Now the trading strategy is pulling back and rising slowly. The range of 93.5-94.8 continues to rise.

WTI Bullish OutlookSince March 2020, crude oil prices have been on the rise with simple Fibonacci 38.2% pull backs along the way ... BUT nothing appears to be able to stop what's coming next.
Per barrel is currently hovering around $90 but the gas pumps and tempers will exceed the charts as we move into mid-2024 on the heels of the 2024 election.
Also included the Elliott waves 1 thru 5 showing the 38.2% retraces with the mid wave showing a perfect 61.8% retrace of it's prior price action. There's no guarantee that the 1.618% extension will occur so the 1.414% at the $180 price point appears to be more probable.
NFA DYOR ... comments welcome.

WTI prints key reversal day ahead of FOMCWhilst we retain our view that oil prices could be headed for $100 further out, the trend seems to have hit a speed bump over the near-term.
WTI broke above $90 with ease yet faltered around $95 with a shooting car candle with high volume (which makes it a potential key reversal day). A bearish divergence has also formed with the RSI (2) after it reached overbought.
With the potential for the Fed to be more hawkish than expected, it could provide the catalyst for a pullback on WTI. A break below $90 confirms the near-term reversal is underway, with $87 making an initial target around the volume node from its preceding leg higher. $85 could also provide support around the August highs, which might tempt dip buyers more focussed on the fundamentals currently supporting higher oil prices.
