Three Headwinds to Send Crude Oil Into Free FallNot too long ago, Gasoline prices rattled American car drivers with a price tag of USD 5 a gallon. And now, much to their delight, gasoline prices have eased to USD 3.50 a gallon.
Slump in crude prices which influences gasoline has plunged by one-third over the last twelve months. A barrel of West Texas Intermediate ("WTI") trades around USD 70.
Rattled US consumers, underwhelming Chinese recovery, and robust supply will drag crude oil prices down even further in the near term at least until OPEC+ meeting on June 4th. Barring an OPEC+ “shock-and-awe” intervention, crude oil will continue losing steam.
This paper argues that a short position in CME Micro WTI Crude Oil expiring in July (MCLN2023) with an entry of USD 71.90 a barrel with a target of 64.80, and hedged by a stop loss at 75.60, is likely to yield a reward-to-risk ratio of 1.9x.
RATTLED BUT RESILIENT. US CONSUMER SENTIMENT IS WEAKENING.
Oil prices face massive headwinds in the near term in line with frail U.S. consumer sentiment. It slumped to a six-month low as a debt ceiling drama fuelled worries about the economic outlook.
The University of Michigan's preliminary reading of consumer sentiment index clocked 57.7 pointing to the lowest reading since last November and down from 63.5 in April.
Consumer sentiment tumbled 9% wiping out over half of the gains achieved after the all-time historic low from last June.
While current macroeconomic data show little sign of recession, consumers’ worry about the economy escalated this month.
Expectations for the economy a year from now sank 23% from last month. Longer term expectations contracted 16% highlighting that consumers concerns that economic downturn will not be shortlived.
Consumers have demonstrated resilience thus far. But their anticipation of a recession will trigger to cut spending when signs of weakness emerge.
An unresolved banking crisis and a prolonging debt ceiling drama paint a dismal picture for US consumers. It will amplify if debt default drama continues this week with rising likelihood of default and the resulting economic consequences.
UNDERWHELMING CHINESE RECOVERY
The much-anticipated economic rebound never occurred, but to describe it as underwhelming might be an understatement.
Broad economic indicators point to weakening instead of recovery. Industrial production and retail sales missed forecasts. Unemployment rate among youth set a record high of 20.4%.
A frail global economy adds to China’s gloom. High inflation and elevated rates in China’s key destination countries have slashed demand for Chinese products. Exporters at China’s largest trade fair reported a drop in overseas orders.
Infrastructure and manufacturing investment, which have helped to offset the slump in property investment, both slowed in April from the previous month, a sign of more subdued government spending and weak business confidence.
The property market remains weak despite early signs of a pickup in housing sales. Consumers are reluctant to borrow. China’s home price growth slowed in April. Indicators show slowing momentum in home purchases despite Government’s effort to prop up the real estate. China’s housing starts is at its lowest when compared over the last 10 years.
Property investment shrank more than 16% in April YoY even though home sales grew. Construction of new homes continued to decline.
New household loans, posted the first decline in 12 months in April 2023, suggesting that residents repaid more than they borrowed.
NOT WEAK DEMAND BUT UNSEEN ROBUST OIL SUPPLY
More than Expected Supply
Given the gloomy headlines, it is easy to fall prey to the notion that demand is the problem. The real problem is too much supply, argues Javier Blas of Bloomberg.
Unexpected production is primarily coming from OPEC+ countries despite promise of supply cuts. Many oil producing nations are unknowingly participants of the prisoner's game.
Demand Remains Steady
The IEA raised its forecast for 2023 global oil demand by 400,000 bpd, setting a record daily consumption of 102 million barrels. In short, demand remains resilient.
IEA’s optimism may be misplaced, and oil demand growth might soften. But its forecast accounts for pessimistic diesel outlook.
Presently, the oil market has all its eyes on Washington. The US gulps two out of every ten barrels pumped worldwide. But America is not the oil market. Its consumption lead has narrowed significantly. In 2023, the combined consumption of China and India (21.4 million bpd) is expected to be larger than the US (20.3 million bpd).
The real hurdle holding back an oil rally is supply. The need for cash in producing nations forces them to pump more. These countries are trying to make up for lost revenues by ramping up volumes to compensate for what they are losing due to lower prices.
MANAGED MONEY ARE BEARISH AT LEVELS UNSEEN SINCE 2011
Net position of non-commercial players is at its most bearish levels since 2011 across a combination of major oil contracts.
Non-commercial participants include hedge funds, proprietary trading groups, asset managers, among others. Other Reportable Positions represent open interest by large participants that trade their own accounts and do not fit into any other category.
TRADE SETUP
Amid gloomy outlook and strong headwinds, this paper posits that a short position in CME Micro WTI Crude Oil Futures expiring in July (MCLN2023) with an entry of USD 72.00 with a target of 64.80, and hedged by a stop at 75.60, is likely to deliver a reward-to-risk ratio of 1.9x.
• Entry: 71.90 USD/barrel
• Target: 64.80 USD/barrel
• Stop: 75.60 USD/barrel
• Profit at Target: USD 710
• Loss at Stop: USD 370
• Reward-to-risk: 1.9x
MARKET DATA
CME Real-time Market Data helps identify trading set-ups and express market views better. If you have futures in your trading portfolio, you can check out on CME Group data plans available that suit your trading needs www.tradingview.com
DISCLAIMER
This case study is for educational purposes only and does not constitute investment recommendations or advice. Nor are they used to promote any specific products, or services.
Trading or investment ideas cited here are for illustration only, as an integral part of a case study to demonstrate the fundamental concepts in risk management or trading under the market scenarios being discussed. Please read the FULL DISCLAIMER the link to which is provided in our profile description.
Wticrude

Crude Oil Bearish OutlookA technical outlook for the week ahead!
--------------------------------------------------------------------
Please, support my work with a like, thank you!
10 spot on USD/CAD, lets go!OANDA:USDCAD
TVC:USOIL
TVC:DXY
NY news release saw the USDCAD chop a bit until settling down to go a bit higher with the DXY dollar index
It's tough to figure out USDCAD follows the WTI or the DXY, just depends on the news

Broke my TF rule, OH WellOANDA:USDCAD
Took another 10 pip scalp, This time, on a much lower time frame.
Figured I'd scalp this on a 30 second after all the Oil news release....
Go Canadian Dollar!


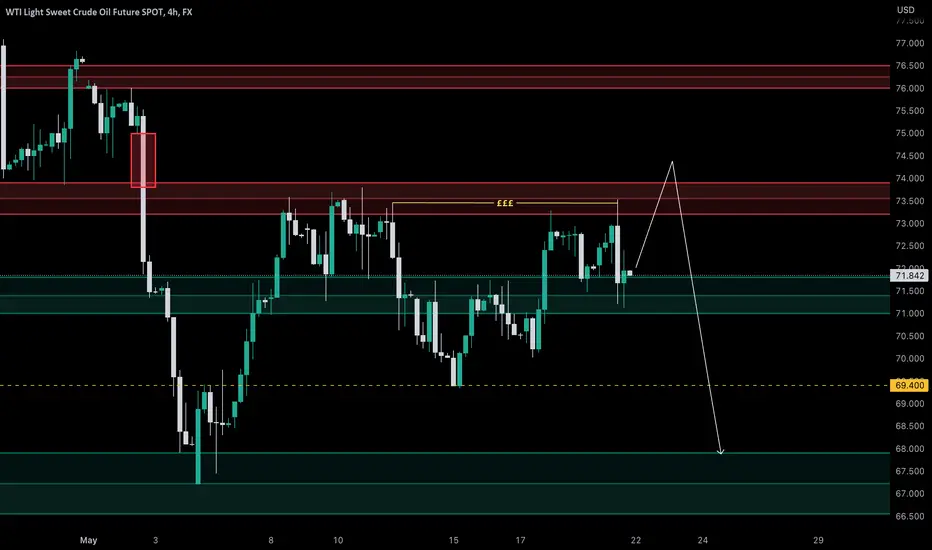
WTI REMAINS IN RANGECrude oil prices consolidate around 68 and 77 dollars per barrel, remaining below the heights of March and April. The risk of downside movement is fueled by the slow recovery of China and their slow demand increase, higher interest rates on demand and uncertainty around US economy.
On the other hand, if the prices dip too low, the countries of OPEC+ will be fast to decrease the supply in order to mitigate further down movement.
The price will most likely keep ranging between 68 and 77 dollars, but if it breaks the support, it might fall to 64, while if the resistance gets broken, the price might target levels of 83.50.
Risk Disclosure: Trading Foreign Exchange (Forex) and Contracts of Difference (CFD's) carries a high level of risk. By registering and signing up, any client affirms their understanding of their own personal accountability for all transactions performed within their account and recognizes the risks associated with trading on such markets and on such sites. Furthermore, one understands that the company carries zero influence over transactions, markets, and trading signals, therefore, cannot be held liable nor guarantee any profits or losses

10 Spot USD/CAD vs USOILOANDA:USDCAD
TVC:USOIL
10 spot this morning on the start gate of new release
10 pips and done
Fin ally a quick and easy morning, don't get these often....

When WTI goes higher...OANDA:USDCAD
Canadian dollar tags along with WTI going higher.
Took a hard 10pip TP short on the USD/CAD

WTI Crude Oil (The momentum has shifted!)
View On WTI (15 May 2023)
WTI is in
* Downtrend in short term (Intraweek)
* Downtrend in Mid term (Intramonth)
* Downtrend in Long term (Last 3 months)
Follow our analysis on early May.
Crude Oil had a good run up to the resistant area of 72~74 before it gets shoot down again.
Now we can except $67 regions as a good support and the price can go there first.
So,
We are not in the hurry to buy in just yet the current momentum is still the bearish one.
Stand aside first if you are looing for a long entry.
Let's see.
DYODD, all the best and read the disclaimer too.
Feel Free to "Follow", press "LIKE" "Comment".
Thank You!
Legal Risk Disclosure:
Trading crypto, foreign exchange or CFD on margin carries a high level of risk, and may not be suitable for all investors.
The high degree of leverage can work against you as well as for you.
Before deciding to trade foreign exchange you should carefully consider your investment objectives, level of experience and risk appetite.
The possibility exists that you could sustain a loss of some or all of your initial investment and therefore you should not invest money that you cannot afford to lose. You should be aware of all the risks associated with foreign exchange trading, and seek advice from an independent financial advisor.

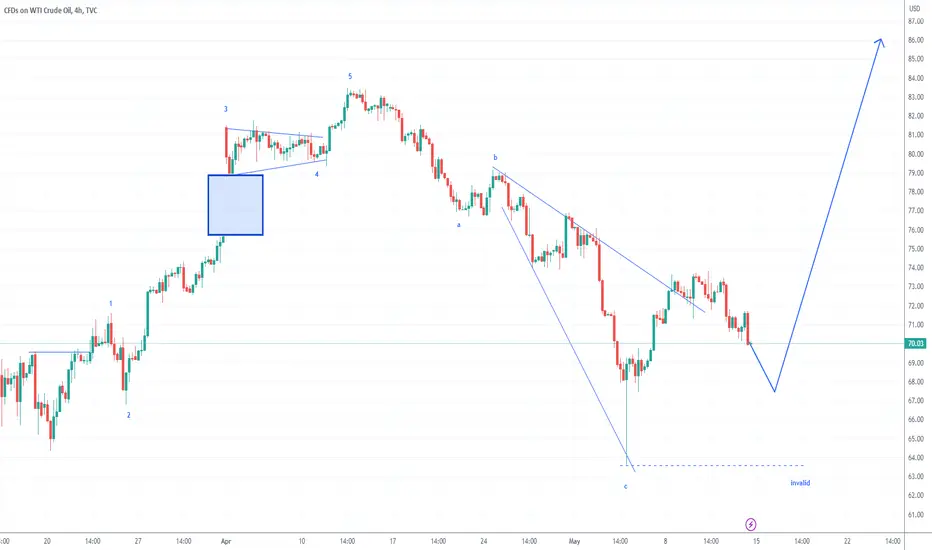
US OIL 14May2023I see the Gap that occurred a few weeks ago as the initial gap of a bullish trend. if this wave notation matches, and the price doesn't fall more than the invalid area, it's a good idea to look for an area to buy again. most likely the price will go up very much
US Oil - Lows yet to comeHello traders!
During the last post we were tracking a triple three correction in cycle wave 2 for OIL. After the 5 legs up from 64, we admitted the possibility of a bottom being in before our expectations (that were at GZ and blue wolfe wave completion around 57-60). However, the impulsive decline we just got from the local top suggested the 5 leg up from 64 to 83.8 were the final leg of an irregular flat in wave b of Z. We are therefore tracking more downside before looking for a buy opportunity. We will carefully study price action in order to assess possible targets. Given the current structure, yellow box is gaining probability with respect to purple box.
Primary count on chart.
We will update here!
Best
GMR

WTI BEARISH OUTLOOK CONTINUESThe weak trade and inflation data from China further casts doubt on the ability of fast economical recovery of the country after COVID.
This puts a rench in OPEC's forecast that China will drive the demand for crude oil to record high.
The technical indicators are also confirming the downtrend, with MACD histogram being below 0 and RSI under 50 neutral line.
If this scenario continues, the price of the instrument might test levels of 64 and even 62. In the opposite scenario, the price might revert and test 77 point resistance.
Risk Disclosure: Trading Foreign Exchange (Forex) and Contracts of Difference (CFD's) carries a high level of risk. By registering and signing up, any client affirms their understanding of their own personal accountability for all transactions performed within their account and recognizes the risks associated with trading on such markets and on such sites. Furthermore, one understands that the company carries zero influence over transactions, markets, and trading signals, therefore, cannot be held liable nor guarantee any profits or losses.

US Crude oil heading for $90In the current situation of global energy crisis, Target of $90 for WTI Crude oil seems pretty legit in the coming month and if situation worsen then $110 for sure in coming 6 months
Reasons for bull run:
- energy crisis leading to low supply high demand
- big volume coming in bullish rally than in the downfall in intraday chart
- No positive news to overcome the supply issue

WTI breaks out ahead of US inflation dataWe suspect volatility may be on the quiet side with a US inflation report looming, but this provides the opportunity for markets to consolidate and traders plan trades.
Should we see the pace of inflation to continue slowing, it could strengthen oil prices for two basic reasons.
1 - A weaker US dollar, as traders bring forward rate cut bets / solidifies bets of 5.25% peak rate
2 - Reduces the odds of a recession and increases oil demand expectations
The softer inflation is, the stronger the bullish reaction for oil could be expected.
- WTI futures closed above trend resistance following a bull-flag breakout, which was accompanied by positive-delta volume during the rally to recent highs.
- Prices are now consolidating, but we'd welcome a pullback towards $73 to buy dips in anticipation of a breakout above $74.
- Initial target is $76 (near the upper daily ADR band)
- A move to (and beyond) $77 could be on the cards if we're treated to a weaker-than-expected inflation report
- The bias remains bullish above $72.50

WTI / OIL is back on major support -- a bounce maybe warranted.Oil corrected massively due to economic uncertainty.
OIL just touched the 0.65-0.7 major support area. This level is a significant order block where accumulation progresses every time it revisits this price point.
Expect some bounce from here. The only question now if it can sustain the ascend or it will do another correction thereafter.
SPOTTED at 67.0
TAYOR.
Safeguard capital, always.

HOW TO TRADE BCO/WTI INTRADAY(VERY EASY) ?Jut keep it simplehis is one of the simplest trending strategies I use for day trading, and also one of the most effective. For this, it has been given the catchy name: Day Trade Trending Strategy. Using a one-minute chart the price will often make a larger move, have a very simple pullback, and then begin to move in the trending direction again. The strategy attempts to capitalize on that. Pullbacks aren’t always this simple, therefore, this strategy is best used in conjunction with the consolidation breakout method and the engulfing candle method (which this method is similar to).
The strategy utilizes the trend to make a profit and also keeps me out of the market when the market isn’t trending.
Before I begin, I cannot stress enough the importance of patience when employing the strategy. After you’ve exhibited patience, I am cannot stress enough the importance of restraint in not continuing to use the strategy once the window has closed. Like a fighter honing his striking skills, a strike is only effective if delivered at the exactly the right time. Too early, or too late, and the strike is not as effective. Wait for opportunities, then pounce…that’s how to trade the financial markets.
Day Trade Trending Strategy – When and How
The following day trading strategy provides roughly 4 to 8 trades per day, sometimes a bit more and sometimes a bit less. The main waves (trends) of the day are traded, usually with two trades per major price wave. Even if not taking trades using this method, it provides an overall context for the movements throughout the day, giving feedback and confirmation for many other strategies or signals which may arise.
When day trading stocks or forex I use a 1-minute chart and a Level II (not required for forex). The Level II is only used if the volume in a stock is bit low and I need to watch for when liquidity is available. If the stock has lots of volume (plenty of shares at every price level) then there is no need for a Level II, just use the chart.
Some days will turn out to be ranging days. If this case, no trades will be triggered, or very few, since intraday swing highs/lows will not be broken, thus no trend is present. Use patience and restraint. Only trade what the market actually provides. One of the most common problems new traders have is taking a trade too early and trying to get a better a price, assuming a trade will trigger in the near future. This is a big mistake. Only take a trade once the actual trade trigger (discussed a bit later) actually occurs. As alluded to prior, another mistake is waiting too long after a trade trigger has occurred. This too is detrimental to profits. Trades are taken at the exact moment of the trade trigger or not at all.
Don’t start using this strategy until about 30 minutes into the trading day. I have other strategies I use during the first half hour, such as the Truncated Price Swing Strategy.
We can now draw our downward trendline because we have broken lows and eventually we want to go short.
We then wait for a pullback towards the trendline
Please note, the trendline is only a visual and really has no significance to me. What matters, in this case, is that all the future swing highs in this move stay below the most recent swing high and new lows are created. As long as that happens, it is a downtrend. The opposite applies to an uptrend.
Enter short when the pullback is potentially ending, signaled by the price dropping back below the low of a green bar or cluster of bars near the trendline (doesn’t need to be exactly at trendline).
Day Trading Trending Strategy NOTES:
I am only taking trades in the trending direction. I am waiting for a pullback and then only entering once the price starts moving in the trending direction again. This takes skills, as it is a somewhat subjective form of analysis and trading.
The exact level of the trendline, if used, is not important. It is just a visual aid. Rather, understand that pullbacks in a downtrend can go almost all the way to the recent swing high in that downtrend, but should not exceed it (opposite for uptrend). As a pullback is occurring I am looking for any sort of shift which indicates a move back in the direction of the current primary trend.
If there is any question as to the current trend, I do not trade this strategy.
SPY is used for these trade examples, but the method can be applied to any stock or forex pair. Other stocks to consider for day trading each week are discussed on the Day Trading Stock Picks page.
If the market is pretty close to my profit target and starts to pull away from the target, I exit. I am not going to risk giving up a bunch of profit for a couple cents.
The target, which can be estimated before the trade occurs, needs to be realistically achievable based on the size of the recent price waves. If it the target will require the price have a much bigger move than it has been producing that day, the trade is skipped.

BCO/WTI HEAVY SHORT Speculators cut oil long to pre-covid loWSWeekly Commitment of Traders update highlights future positions and changes made by hedge funds and other speculators across commodities and forex during the week to August 9. A relatively quiet week where a continued improvement in risk appetite drove stocks higher while softening the dollar. Some commodity positions, with crude oil the major exceptions, showed signs of having reached a trough following weeks of heavy selling
his summary highlights futures positions and changes made by hedge funds across commodities and forex during the week to August 9. A relatively quiet summer holiday impacted week where stocks traded higher ahead of last week’s CPI and PPI print after better than expected economic data helped reduce US recession fears while the market was looking for inflation to roll over. The dollar traded a tad softer, bond yields firmed up while commodities showed signs of having reached a trough following weeks of heavy selling.
Adviser To Iranian Negotiating Delegation: The Chances Of Reaching A Nuclear Agreement Are Very Great
ajel.sa
Commodities
Hedge funds were net buyers for a second week with demand concentrated in metals and agriculture while the energy sector saw continued selling. Overall the net long across 24 major commodity futures rose for a second week after recently hitting a two-year low. Buying was concentrated in gold, platinum, corn and livestock with crude oil and wheat being to most notable contracts seeing net selling.
Energy: Speculators responded to continued crude oil weakness by cutting bullish bets in WTI and Brent crude by a combined 14% to a pre-Covid low at 304.5k lots. The reductions were primarily driven by long liquidation in both contracts following a demand fear driven breakdown in prices. Gas oil and gasoline longs were also reduced.
Metals: Buying of metals extended to a second week led by gold which saw a 90% jump in the net long to 58.2k lots. Overall, net short positions were maintained in silver, platinum and copper with the latter seing a small amount of fresh selling due to profit taking on recently established longs.
Agriculture: Grains were mixed with corn and soybeans seeing continued buying ahead of Friday's WASDE report while the CBOT corn net short jumped 36% to 20k lotsand the Kansas net long was cut to a two-year low. The total grain long rose for second week having stabilised around 300k lots having collapse from a near record 800k lot on April 22.
Soft commodities saw elevated short positions in sugar and cocoa being maintained with price gains in coffee and not least cotton supporting a small increase in their respective net longs. This before Friday's surge in cotton which left it up 13% on the week after the US Department of Agriculture slashed the US crop forecast by 19% to a 12-year low. Driven by a high level of abandonment of fields in the drought-stricken Southwest.
Forex
In the week to August 9 when the dollar traded close to unchanged against a basket of major currencies, speculators increased to three the number of weeks of continued dollar selling. The pace of selling even accelerated to the highest since January after the gross long against ten IMM futures and the Dollar Index was slashed by 20% to $17.4 billion, a nine week low. Most notable selling of the greenback was seen against GBP and JPY followed by EUR and CHF. The Japanese yen, under pressure for months as yield differentials to the dollar widened saw its net short being cut by 22% to a 17-month low.
MY WTI BCO STRATEY:
HEAVY SHORT SELLING
TARET:.... read in my member blog

USOIL Uptrend Weekly analysis 300423The price is above the cloud. Chinkou is above the past price line.

WTI Oil is looking on downside trendWTI Oil may see a downtrend levels today over the sentiments and fundamentals

WTI = watch your Canadian marketsTVC:USOIL
Interesting, tanking on the prices.
Canadian pairs on a little holding pattern for the Feds

USOIL 2/MAY/2023It is anticipated that the Federal Reserve, which is responsible for managing the US's monetary policy, will raise interest rates again. This could potentially cause the US economy to slow down and enter a recession later this year.
In recent weeks, concerns about a banking crisis have affected the oil market. The US government took over First Republic Bank, and JPMorgan purchased most of its assets, causing alarm as three other US banks have previously collapsed: Signature Bank, Silvergate Bank, and Silicon Valley Bank. If more banks encounter difficulties, it may lead to a banking crisis that could cause a recession and a decrease in oil demand. Additionally, voluntary production cuts of about 1.16 million barrels per day by OPEC+ countries, including Russia, will take effect in May, impacting oil prices.
On a positive note, the US's manufacturing industry is improving, and with rising demand and employment, this has slightly boosted oil prices.

USOIL set for a ride!Instrument : WTI
Possible direction : Bullish
Technical Analysis : Early this month WTI opened with a gap and was in consolidation and finally price has filled that gap and bounced from the long term support zone. As there is strong illiquidity grab and filling out of gab, WTI may start its uptrend and may continue to rise. Upon retest of the previous resistance as support a buy trade is high probable.
Possible trade recommendation : Bullish as per sketch.
Press like button if you enjoy.
Risk Disclaimer: Trading foreign exchange on margin carries a high level of risk, and is not suitable for all investors. Past performance is not indicative of future results. The high degree of leverage is dangerous and can work against you as well as for you. Before deciding to invest in foreign exchange or any market you should carefully consider your investment goals, level of experience, and risk tolerance. It is EXTREMELY LIKELY that you will sustain a loss of some or all of your initial investment and therefore you should not invest money that you cannot afford to lose. No representation is being made that any account will or is likely to achieve profits or losses. Past performance is not indicative of future results. Individual results vary and no representation is made that clients will or are likely to achieve profits or incur losses comparable to those that may be shown. You acknowledge and agree that no promise or guarantee of success or profitability has been made between you, and Forex Trading Wizard. Do your own research and talk to a professional financial planner in order to be aware of all the risks associated with foreign exchange trading and investing and seek advice from an independent financial advisor before risking any capital.

WTI double bottom touch point on 4H, ascend on queue...OIL just created a double bottom touch point on 4H data -- conveying a strong order block support at the current levels.
It is currently attempting to reverse to the upside, and may retest its previous peak at 80 levels soon.
Accumulation at the current price has started and a 4H higher lows has been created -- suggesting a shifting trend.
Spotted at 74.00
TAYOR.
