US Oil - Last downward leg- Pt.2- About to become impulsive?Hello traders,
in our previous posts about oil we highlighted how we expect cycle wave 2 to complete around the 57-63 area with the final C wave of the corrective structure.
We then showed how we applied leading indicators to obtain confirmation of more downside: .
We entered at the golden zone (61.8%fibo) strong volume rejection.
We are short from @78.18 aiming to ride the microcount outlined in the chart. Stop loss on entry as per the update in previous post.
Cheers
GMR
Wticrude

USOIL top-down analysisHello traders, this is a complete multiple timeframe analysis of this pair. We see could find significant trading opportunities as per analysis upon price action confirmation we may take this trade. Smash the like button if you find value in this analysis and drop a comment if you have any questions or let me know which pair to cover in my next analysis.

Crude oil fell as expected, empty orders made profits, beautiful
The crude oil was prompted in the intraday, and it went short directly, and now it has fallen sharply, and the friends who kept up with it made profits again, which is very beautiful! ! Keep up with the rhythm, in order not to get lost, please stay tuned, thank you!

WTI: It all comes down to the green… 💵🌿It all comes down to the green . This saying is especially true for WTI as it has yet to dive into the green zone between $70.12 and $35.77. To get this done, the course should push further off the upper side of the turquoise trend channel and drop below the support at $70.08. This should grant WTI direct access to the green zone, where it should finish wave 2 in green before heading northwards again. However, a 32% chance remains that WTI could turn upwards and climb above the resistance at $82.64, in which case the course would develop wave alt.(b) in blue above the upper resistance line at $93.74 first before resuming the descent.

Sniperfirst and only time I will trade U.S Oil, could the end of this correction leading into this beautiful impulse

Intraday SELL Crude Oil (01 MAR 2023)CRUDE OIL intraday trading alert
3 simple steps to find a quality setup !
Risk Reward Ratio 1: 2
Anyone same idea with me?
SELL Crude Oil
Good luck traders..
AW WTI Crude Oil - Learn The Waves To Never Miss This...This is just an update to show you how you could of already been in what will be a very profitable trade.
Linked below in related ideas is the video that told you to get in at the levels mentioned in this video.
I make these video to show you how learning the waves will make you an amazing trader.
You will catch moves that some people only dream of in hindsight.
All the hard work was put into making the AriasWave methodology over many years.
We will see just how insanely profitable this trade is once we hit those lows.
How will we know when the low is in? ...I will be tracking all these moves as we progress through the coming recession.
This recession will be the last recession before the huge bull market that awaits us once it's done.
I will also be posting another idea soon on how to enter this trade on a pull back when I see the right patterns.
Remember to use Disciplined Money Management Principles to ensure longevity as a trader.
If you don't know the long term pattern shouldn't you be doing your research instead of just following the crowd?
Just remember: I am not a financial adviser; I suggest using this only as a guide. Always do your own research.
***AriasWave is not the same as Elliott Wave so your counts may differ to mine if you happen to use it.***

USOil trendDears,
kindly, because of HS pattern i'll see the mantioned like the pic. HOPE Y'ALL TRADE WELL

OIL shaping upOil spot is looking promising for a short term buy into a short position at the top of the range. ill be looking for a impulse and continuation pattern to get involved long, whereas the short position will need a strong rejection and break down. Risk management and patience are king!

USOIL - Break of Structure 📉The USOIL price touched the Daily Resistance Level 🧐
The Key Level (Higher Low) is broken 🔥
so, i predict a bearish move 📉i'm Waiting for confirmation 🧐
TARGET 1: 77.11
TARGET 2: 75.94
TARGET 3: 73.36🎯
...
if you agreed with this IDEA, please leave a LIKE, FOLLOW or COMMENT!

WTI BULLISH OUTLOOKUS YoY CPI came above expectations yesterday, which led to expectations of further push of the prices. Although US Oil cushion reserve came above expectations, OPEC reported declined production of the month of January, and the expectations are for further increase of global demand for the crude oil.
On the 1H graph the price had broke the resistance of the Flag pattern, suggesting a start of a bullish movement, where, if continues, the price might test levels of 79.63
In the opposite scenario the price might fall to levels of 79.03
Both MACD and RSI indicators are confirming the bullish scenario.
Risk Disclosure: Trading Foreign Exchange (Forex) and Contracts of Difference (CFD's) carries a high level of risk. By registering and signing up, any client affirms their understanding of their own personal accountability for all transactions performed within their account and recognizes the risks associated with trading on such markets and on such sites. Furthermore, one understands that the company carries zero influence over transactions, markets, and trading signals, therefore, cannot be held liable nor guarantee any profits or losses.

USOIL (WTI) HOVERING INSIDE TREND CHANNELUSOIL is hovering inside the trending channel.
This is a good trade opportunity to take.
Trade with care.
I will update at here if the trade opportunity is given.
Do follow and boost if you found this idea helps.


Oil grows bearish but SPR refill loomsDespite OPEC cutting its output by an estimated 60 000 barrels per day in January 2023, the price of West Texas Intermediate oil dropped more than 10% from its high of $82.60. This price action follows a series of wild swings within the wide range between $70 and $83. We expect high volatility in the oil market to persist in the first quarter of 2023. Indeed, we think there is a high likelihood of USOIL falling below $70. However, with the U.S. administration seeking to refill its SPR, such a price drop is likely to be short-lived. As conclusion, we think oil will remain stuck within the wide range for a while longer.
Illustration 1.01
Illustration 1.01 shows the daily chart of USOIL. Since mid-November 2022, the price can be seen trading within the wide range between $70 and $83.
Technical analysis
Daily time frame = Bearish
Weekly time frame = Neutral/Slightly bearish
Illustration 1.02
The picture above shows the daily chart of USOIL and two simple moving averages. Yellow arrows indicate two technical developments which contradict each other. The first is a bullish crossover between 20-day and 50-day SMAs; the second is the subsequent price drop below these moving averages. These false and contradictory signals are common for moving averages when the price trends sideways.
Illustration 1.03
Illustration 1.03 displays the daily chart of USOIL and simple support/resistance levels. If the price breaks below Support 1, it will bolster the bearish odds in the short term.
Please feel free to express your ideas and thoughts in the comment section.
DISCLAIMER: This analysis is not intended to encourage any buying or selling of any particular securities. Furthermore, it should not be a basis for taking any trade action by an individual investor. Therefore, your own due diligence is highly advised before entering a trade.

USOIL 13th FEBRUARY 2023Oil prices fell below US$81 after surging more than 8 percent last week. Although Moscow will reduce supply by half a million barrels per day by March 2023 due to tightening flows, investors remain wary that the Federal Reserve needs to continue pushing interest rates higher to tame inflation. The Fed's push has weighed on the appetite for riskier assets including commodities.
Global crude oil prices weakened on concerns about a global slowdown, offsetting sentiment of Russia's plan to curb supply in retaliation for Western sanctions.

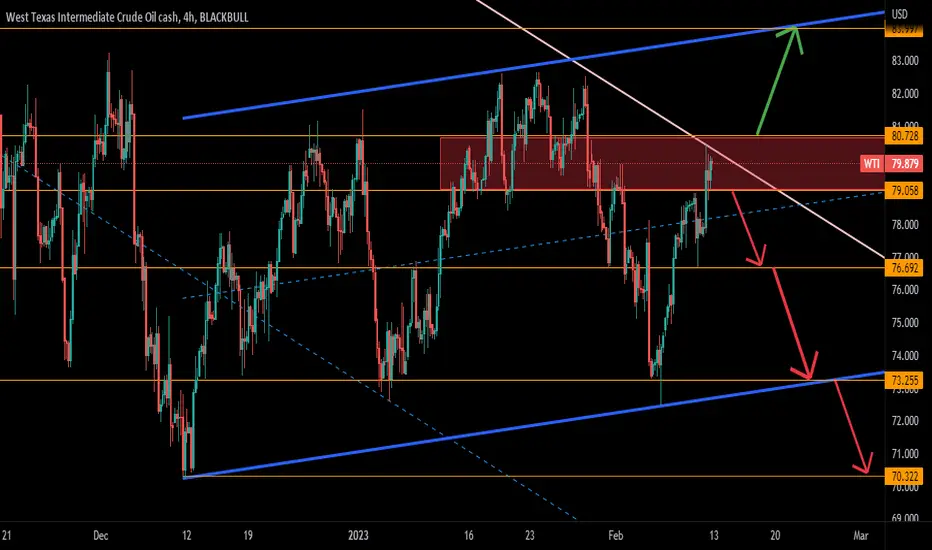
WTI update on the 4 hour chartOil analysis update
= The analysis is based on trend analysis and the Dow Laws
= The area from level 80.728 to level 79.058 is not suitable for trading and it is a dangerous area
= strong scenario
Exceeding the level 79.058 to the bottom, the targets are 76.692, then 73.255, then 70.322
= weak scenario
The level exceeded 80.728 to the top, targeting 83.997
AW WTI Crude Short Trade Opportunity - USOIL to Slip Lower...In this video I highlight what could be the very start of Wave E down in WTI Crude.
This could be the very last corrective wave before the start of the next bull market.
This would mean that the trading plan for USOIL is going short to book a profit and then prepare for a long position after a bounce.
The one thing I won't mention in this video are the insane levels prices could reach in the future.
That is a topic for another video.
Critical Resistance for this idea is at $82.60.
You can either short at the open or wait for a break of support at $70.
Remember to use Disciplined Money Management Principles to ensure longevity as a trader.
If you don't know the long term pattern shouldn't you be doing your research instead of just following the crowd?
Just remember: I am not a financial adviser; I suggest using this only as a guide. Always do your own research.
***AriasWave is not the same as Elliott Wave so your counts may differ to mine if you happen to use it.***

Oil Failing at Key AreaOil failing to breakout higher here, suggests that we are likely heading much lower.

Oil's long term re-test before upcoming rally? 13.2.2023Simple 1+1 equals 2.
There's a couple factors here.
1) Long-term support since March 2023 kept with multiple re-tests.
2) Long-term 8 month wedge consolidation with recent Jan 2023 breakout up together with RETEST of that breakout at 74.80-75.20 as of today.
If the week closes above this support, VERY high chance for continuation of breakout up and 80's-90's even 100 to be reached within coming weeks.
If the support of 74.80-75.20 breaks down, retest of long-term March 2021 to today support trend-line is possible at 71.40-60.
-------------------------------------------------------------------------------------------------------------------
I encourage to do your own research and trade with caution
Thank you for reading and would very much appreciate your comments and questions!
------------------------------------------------------------------------------------------------------------------

CRUDE OIL - US OIL - SELL RIGHT NOW INTRADAY TRADEi am not your investment advisor, so its just my analysis on SPX and always go with the flow and never enter without confirmation.
Always use stop loss and always follow the trend as trend is your freind.
Consistency and patence is the key to success!
US OIL CRUDE OIL SELL TRADE

WTI Crude oil : The retest to rule them all! 10.5Focus up!
100-101.50 is key retest level of support trend-line stretching back all the way to December 2021, with consistent higher lows.
At the same time, it's also a retest level of the second higher high breakout stretching back from the peak of 128.
China lock down is expected to ease within days, inflation is on the rise, EU oil ban for Russia is likely coming very soon.
An unlikely daily close below 100 could signal further downside to 97 though very unlikely with current fundamental/technical combo.
Do the math and keep the back noise out the picture, look only at key factors and act with caution and patience.
----------------------------------------------------------------------------------------------------------------------------------------------------------------------------------
Thank you so much for reading! If you found my idea useful, it would mean a lot for me if you like and follow!
It's a pleasure for me to help as many traders as possible master trading, so please ask me on the comments anything you'd like.
----------------------------------------------------------------------------------------------------------------------------------------------------------------------------------

USOIL WEEKLY TRADEHello
Last week's price broke the level of consolidation at 81.44, so let's see if 77.76 will hold or if it will drop to 71.
Share your thoughts
My trading strategy isn't intended to be used as a signal service. It's a process of gaining knowledge of market structure and improving my trading abilities.
Like and subscribe and happy trading to all

GTE The breakdown of the diagonal is likely a HTF Primary W1 into W2 because it's on the monthly. Typically a leading diagonal is a bearish precursor to a reversal.
Also leading diagonals most likely form a wave 1 into w2 set ups.
The 786% might be too optimistic, as the wave 1 was 5 up which means sub wave A which equals the 5 up diagonal which equals the HTF w1 is a HTF Zig Zag & Zig Zags can bounce off the 50%-618%.
But the underlying nature of W2 is to destroy any hope of the wave 3.
So rather the 786% is usually a trademark of the wave 2.
Basically a lot of conflicting forces at play here as to where the bottom forms.
But catching this dip for a LT play seems very smart as W3 is targeting $16-$18 & Wave 5 $200 plus.
