USOIL 23rd SEPTEMBER 2022Oil prices slipped below the US$85 per barrel level after the US central bank, the Fed, announced an interest rate hike.
U.S. oil demand over the past four weeks fell to 8.5 million barrels per day (bpd), the lowest since February, according to the Energy Information Administration (EIA). On the other hand, there was a 1.1 million barrel increase in crude oil stocks last week.
The European Union is considering restrictions on Russian oil prices, as well as on high-tech exports to Russia, as well as sanctions in the event of an escalation of Moscow's war in Ukraine.
On the other hand, China's crude oil demand is also still pressured by tight restrictions due to Covid-19.
OPEC crude oil exports have been fairly stable, since the high increase in demand earlier this month for an early winter contract.
When Russia refuses to 'restrictions on Russian oil prices', and OPEC starts to 'reduce oil exports', that's we can see prices will tend to be bullish.
Wticrude

WTI DWINDLES BETWEEN HIGH RATES AND THIGHT SUPPLYWTI remains indecisive. On one hand traders are suspecting continuous increase of the interest rates, after Fed decision in Wednesday. On the other hand, the further escalation by Russia of the war in Ukraine and the thread by the Nigerian oil minister Timipre Marlin Sylva that OPEC+ will decrease production if prices keep falling, are creating fear of tightened supply.
All technical indicators are suggesting downtrend for WTI price, with MACD histogram being below the 0 line and RSI being below the neutral 50 line.
If price keeps falling, it might test its most recent low at 80.9, but if the trend reverses, it might test its resistance at 89.7 or even the one at 97.2
Risk Disclosure: Trading Foreign Exchange (Forex) and Contracts of Difference (CFD's) carries a high level of risk. By registering and signing up, any client affirms their understanding of their own personal accountability for all transactions performed within their account and recognizes the risks associated with trading on such markets and on such sites. Furthermore, one understands that the company carries zero influence over transactions, markets, and trading signals, therefore, cannot be held liable nor guarantee any profits or losses.

Direction of WTI #1So there is clearly a strong resistance at trendline. Now we are waiting for the market to rebound at the trendline and we can make short position. but if the market break through the resistance line. we have to make sure it is a break out or false breakout. wait, patience, got setup, minimal risk. and then entry

WTI BULLISH OUTLOOKWTI increased in value in the start of today's Asia session, following a weakened US dollar and the news that China is easing the COVID lockdowns, which will most likely boost the economy of the second largest energy consumer.
On the technical site, the instrument broke the resistance of the triangle pattern, MACD histogram is above 0 line and RSI indicator is above the neutral 50 line.
If the trend continues, the price might reach levels of 88.5, on the other hand, if trend reverses, the price might test its previous support at 83.8
Risk Disclosure: Trading Foreign Exchange (Forex) and Contracts of Difference (CFD's) carries a high level of risk. By registering and signing up, any client affirms their understanding of their own personal accountability for all transactions performed within their account and recognizes the risks associated with trading on such markets and on such sites. Furthermore, one understands that the company carries zero influence over transactions, markets, and trading signals, therefore, cannot be held liable nor guarantee any profits or losses.

WTI wti techincal setup. look the price chart you see price, fundamental is there closer look you find it,, look the context.. trade it.


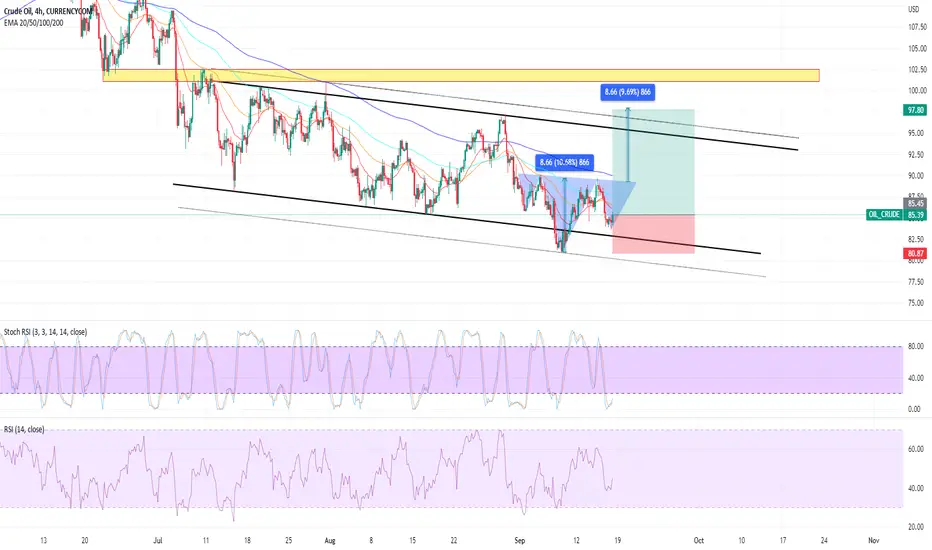
Bullish H&S inplay for OilPretty self explanatory.
With the recent bearish wave in Oil and many other commodities, Oil has recovered it's bullish wedge and has began forming what looks like a H&S pattern.
Severely oversold and battered on the 4hr, daily and weekly, Oil might just be making a come back.
News aren't bullish at all and most traders are in short positions, this for me usually means that bulls moves are up ahead.
In all honesty though, I just can't believe that Oil isn't ultimately going to reach this years high with the Russia situation and the lack of Oil supply and production in the west.
Yes China is on a lockdown and there's fears of a recession, but I doubt any western government who can print and control their currency is going to allow a recession to take place in a time like this.
I've been holding oil for quite long and for a good reason.
Final target for this potential bullish H&S is the conservative target of the distance between the head and the base, with it potentially reaching the yellow resistance drawn.
As always, trade at your own risk!
WTI LONGwti long postion as trade idea, swing trade from perviouse rejection, if it reach 25%fib level, or we see how it play out..

MARKET UPDATE!! THE NEXT LEG DOWN!Hi Snipers,
Please refer to the recording for the next price levels and scenarios.
Thanks
MS

Usoil longsAm going long on USOIL for 5.19RR... A clear breakout of the trendline and consequent retest......let's go!!!

DXYVideo Analysis. Includes Crypto BTC targets.
Thinking we are in W5 now and will likely top around $112-$115 EOY.

USOIL 5th SEPTEMBER 2022The standoff over Russia's gas and oil exports escalated on Friday after Moscow promised to close its main gas supply pipeline to Germany and G7 countries announced plans for price caps on Russian oil exports aimed at squeezing Russia's war chest in Ukraine. This latest closure of the Nord Stream pipeline, which Russia says will last as long as it takes to make repairs, adds to concerns over winter gas shortages that could pull major economies into recession and lead to energy rationing. Europe accuses Russia of weaponizing energy supplies in what Moscow calls an "economic war" with the West following Russia's invasion of Ukraine. Moscow blames Western sanctions and technical problems for supply disruptions.

WTI USOil Technical Analysis and Trade IdeaTaking a look at WTI from a multi time frame perspective. In the video we discuss key levels of support and resistance, the trend, price gaps and a possible short opportunity. As always everything explained in the video in detail, not financial advice.

USOIL 8th SEPTEMBER 2022Oil prices fell sharply on Wednesday (September 7th), slipping below levels seen before Russia's invasion of Ukraine as dismal Chinese trade data and growing fears of a global economic recession hurt fuel demand.
West Texas Intermediate (WTI) oil futures for October delivery plunged US$4.94 or 5.7 percent.
With lower prices this time it is a good opportunity to supply companies that are optimistic about surviving the recession and tightening monetary policy.
This week, OPEC+ is scheduled to discuss oil production cuts as part of their future strategy.
OPEC+ revised the market balance this year and expects demand to lag supply by 400,000 barrels per day (bpd) compared to the previous estimate of 900,000 bpd.
However, the group of major oil producers expects the oil market to be in deficit by 300,000 bpd by 2023.

USOILHello GUYS THIS MY IDEA 💡ABOUT USOIL is nice to see strong volume area....
Where is lot of contract accumulated..
I thing that the Seller from this area will be defend this SHORT position..
and when the price come back to this area, strong SELLER will be push down the market again..
DOWNTREND + Support from the past + Strong volume area is my mainly reason for this short trade..
IF you like my work please like share and follow thanks
TURTLE TRADER 🐢

MARKET UPDATE!! MARKETS SET AHEAD OF ECB!Hi Snipers,
Please refer to the recording for the next price levels and scenarios.
Thanks
MS

BUY CRUDE ABOVE 82.50Buy WTI Crude Above 82.50 It will Bounce and Will See Close Above 85 Today and 87Near Term in a Day

The oil market bows to the tactical strategy of the FEDSpeculators and oil giants seized the moment to maximize their oil profits the past months. With a mixture of war fears, supply fears and the increased demand for crude oil after the Corone pandemic and bad supply chains, a broad panic wave had broken out.
Let's have a short overview about the current situation:
Europe's situation: With India and China importing massive amounts of oil from Russia at very favorable conditions, capacity is freed up on the world market. The new routes have now established themselves, an equilibrium in price and efficiency has now settled in. The same applies to LNG.
Global Supply Chains: They are healing, freight costs are falling, although demand for freight containers remains consistently high, as do increased kerosene prices. An equilibrium is more or less reached.
Wars and conflicts due to lack of food : The grain agreement for fertilizer and grain exports from Ukraine has improved the situation on the world market and avoided narratives for conflicts in poor countries that might lower down oil exports.
Summer session is over : As is known, midsummer is the time when most people in the world travel, especially now after the corona pandemic, many people left by car or plane for the first time since years. The season high is over.
The FED is just trying its best to lower the price below a tactical zone so that speculators are technically afraid to long oil markets. This is to mitigate a price-oil spiral. I expect we will see a 75bps interest hike this month as well to push oil prices below the MA trend lines. Oil prices will fall another good 20-40% in the coming months. There is no way the FED will allow it to pop back above 100$ for the next months, otherwise the mild recession might become a deeper one.
Disclaimer: The information mentioned in my post should be taken with a grain of salt. They are only my personal opinion and do not form facts. They are also not a call or recommendation to open trades, do trades or close positions.

wticousd continue down trend is downwticousd continue down trend is down we will enter from supply zone for trade


WTI oil - An indecisive moment in the oil marketWe warned about the possibility of a downtrend correction in the middle of August 2022. Indeed, we said that the breakout above the sloping support/resistance would lead to such action. Then shortly after that, USOIL rose from its lows and broke above the resistance, halting its rise at 97.65 USD per barrel.
Since then, the price fell back below the 90 USD price tag. However, the drop stopped slightly above the sloping support, which is bullish. Accordingly, we are bullish on oil for as long as the price stays above the support. However, an alternative position can be taken (with a tight stop-loss) on the breakout below the support.
In the short-term future, we will pay close attention to OPEC's rhetoric and any potential talks about more production cuts. In our opinion, cutting production risks higher prices for oil in the short term. Although with the prospect of global recession unraveling, we think production cuts will only have a temporary effect if any.
Illustration 1.01
The picture above shows the daily chart of USOIL. Yellow arrows indicate a bullish breakout above the sloping support/resistance and subsequent failure of the price to retrace below it. As long as the price stays above the sloping support/resistance, it stays in the bullish area.
Technical analysis - daily time frame
RSI and MACD are neutral. Stochastic is bearish. Overall, the daily time frame is neutral/slightly bearish.
Illustration 1.02
Illustration 1.02 shows the daily chart of USOIL and two simple moving averages, which still reflect a bearish constellation.
Technical analysis - weekly time frame
RSI is neutral. Stochastic and MACD are bearish. DM+ and DM- are bearish. Overall, the weekly time frame is bearish.
Please feel free to express your ideas and thoughts in the comment section.
DISCLAIMER: This analysis is not intended to encourage any buying or selling of any particular securities. Furthermore, it should not be a basis for taking any trade action by an individual investor. Therefore, your own due diligence is highly advised before entering a trade.

WTI - 5 Sep 2022After the existing trend and the decrease in demand, oil has taken a downward trend and is waiting for Iran and 5+1 negotiations because OPEC intends to reduce production.

WTI Crude Oil OPEC+ Token Supply CutOPEC+ unexpectedly decided to cut output in October by 100,000 barrels a day.
Emily Ashford (Standard Chartered analyst): “Last month’s adjustment provided a nod to the demands of the consumers, this monthly adjustment is a small nod to the concerns of the producers,”
Deepening energy crisis in Europe after Russian energy giant Gazprom PJSC said gas flows along a key pipeline to Germany would not resume.
In this economic context my short term price target for WTI Crude Oil is $99.
Looking forward to read your opinion about it.
