WTI Oil - New Highs to Come?It is incredibly difficult to analyse this commodity fundamentally so let's see what technical analysis may suggest?
Technical Analysis (Elliott Waves):
Since the sharp fall of March 2020 it is likely that we are observing the development of a global zig-zag ABC
Five waves of the first impulse A completed in July 2021
Wave B took shape of a complex Running Correction WXY finishing in November 2021
And since then we can see formation of another impulse in wave C
Waves 1 to 3 of this impulse culminating in March 2022 are quite clear which have been followed by a flat correction in the shape of Double Threes WXY
The crux of the analysis is developing right now when the price started moving in a very choppy way
The previous scenario still stands and it is very likely that we are observing development of an Ending Diagonal in wave 5 (see educational post below about the structure of this wave)
Waves 1-3 have formed and we can expect correction of wave 4 to last at least until end of June / fist week of July to the level of $103, followed by the last zigzag to top the high of $129
This is quite complex scenario so it needs to be monitored against all the rules of Ending Diagonal.
What do you think about WTI Oil and its short term prospects?
Also let me know if you would like to see other stocks, indices, Forex or Crypto analysed using Elliott Waves.
Thanks
Educational post on Ending Diagonal
Wticrude

crude oil ShortHi Traders,
Interesting price action on crude oil. On Friday we saw a massive sell forcing price back below the support of 114.46. Price created a very strong bearish engulfing candle and I would like to see price now retrace before looking for shorts.
We have seen the price of oil rise heavily over the last few months due to the shortage of supply as well as the war between Ukraine and Russia, although these fundamental factors heavily influence the market, Price always tends to follow the technicals, could this perhaps be a sign that war may be coming to an end?
I will wait for the retest and then find potential shorting opportunities. My target is 94.9 which means this will be a trade I hold for a while if price does not hit my stops.
As always, the week is young and patient traders are always head of the game.
Renaldo Philander.

" USOiL" BUY Trade ( With 500 Pips Target )Pair Name : USOIL
Time Frame : 15 Min
Analysis Type : Scalping Trade
--------------------------------------
➡️ Main Support Level : 106
➡️ Main Resistance Level : 116.60
➡️ Time To Entry : After Break Out The Area And Test it
➡️ Target : 116 - 118
➡️ Stop Lose : 150 Pips After Break Out And Test
USOIL 20th JUNE 2022Before July, USOIL was seen moving in the consolidation channel area which tends to be bullish . in July, USOIL sentiment will tend to be bearish .
The Organization of the Petroleum Exporting Countries (OPEC) member states announced plans to adjust oil production upward in July by 0.648 million barrels per day.
In my view Oil prices are bearish but still not stable. Moderate bearish confirmation has not occurred, because the price has not yet breakout below the support area.
So I will place a buy limit near the support area, with the target not exceeding the weekly resistance which is drawn in the red area.
stop loss as well as sellstop below the support area.

$RRC ~ Correction in progress...As shown, majority of energy stocks are starting to correct. Looking into the future, we believe these companies will provide amazing opportunities. We expect barrels of oil to reach $300-400 a barrel by the end of the decade. Recommend tracking this sector very closely for amazing opportunities.

Crude Oil testing 2008 and 2014 key areasvolume profile from 2008 and 2014. 2008 looks like some of its key aspects (volume area and point of control) influenced market 6+ years later. 2014 looks to be key influencer now. Both 2008 and 2014 CL vol POC aligned in the 103 to 102.50 area so I think this line price will now move toward. Time will tell if support for higher prices or not. The red dashed lines are the vol POCs while the deep purple dashed lines in the pink volume areas are 50% lines of the area.
109 to 102.50 is the key area to hold for higher prices. From 2011 to 2014 this area proved to be the area that price tested but couldn't break. Now that price has broken through decisively, holding as support could indicate considerable higher oil prices.

OIL Switching Uptrend to DowntrendWe had a massive downtrend on Friday due to recession fears. Chances are we can see some pullback to the 115 or 116 areas which could be a great shorting opportunity. There are also opportunities of scalping quick longs but do not long at the smoothed moving averages or LR Channel tops (Linear Regression) as they can be rejected from there. My trading strategy for opening would be quick longs and then reshorting at higher levels region as there still are recession fears. The higher levels would be at 5min, 15 min, 1hr, 2hr, 4hr LR Channel tops where I would short.
I do not expect a 119 area to be reached in the next week (maximum 117).

Crude Oil Uptrend Faces Key Test at Trendline SupportWTI crude oil prices weakened 8.5% last week in the worst 5-day performance since March.
That has brought oil to a key rising trendline from December after falling back under the 113.72 - 116.61 inflection zone.
In the week ahead, traders will be watching if this trendline will be taken out. Such an outcome could spell more trouble for WTI, exposing the 38.2% Fibonacci retracement at 103.83.
Further losses would then place the focus on the 92.95 - 95.11 support zone.
TVC:USOIL


Bearish for WTI - US OIL Short opportunity for WTI in lower time frame.
Some support at reversal zone - may attract price to this lower level before forming another structure.
Target around reversal zone - as drawn arrow.

CRUDE OIL intraday trading & flying to the moom 🚀 13 JUN 2022CRUDE OIL intraday trading alert
3 steps must fulfill before entry
1. 1st breakout done
2. Retracement done
3. 2nd breakout and see you in the SKY 🚀
More info in my profile..
Good luck traders..

WTI CRUDE SELL SELL ON THREE MONTH HIGHIts Time to Sale WTI Crude at 121 Today it Goes Around 118.50 and Further to 114.75 near three Month High and Some Global Issues Big Selloff Expected Today

Wti almost at daily equal highsWhats up guys, Oil has been moving just like I expected. Its given multiple intraday bullish opportunities. Im waiting on it to fill another imbalance before I go long again. Watch out for daily equal highs at 122. We also have 1:1 impulse completion at 122.50.

Pullback Buy In July WTI Crude Oil Massive action in WTI futures today. Here's a late day trade:
1) Buy @ $120.09
2) Stop Loss @ $119.89
3) Take Profit @ $120.29, 1:1 risk vs reward
The best timing for this trade is between 2:00 PM and 2:30 PM EST. Should be good for a nice short-term bounce and close above $120.25.

Short Scalp In WTI Crude OilToday featured a strong close for July WTI futures. If the $120.00 area comes into play again, a countertrend scalp may set up in the next 24 hours.
Here's the trade:
1) Sell $119.94
2) Initial Stop Loss @ $120.09
3) Profit Target @ $119.79, 1:1 risk vs reward ratio

Wti headed to liquidity Whats up guys! Been a long time but Im back. With my bullish bias in mind, Oil has taken out some liquidity above a previous high on 1hr. Now Im waiting on price to pullback to a short time imbalance before heading to take out liquidity near equal highs on the daily timeframe.

OIL 5th JUNE 2022The Organization of the Petroleum Exporting Countries and its allies (OPEC), agreed on Thursday to increase output by 648,000 barrels per day (bpd) per month in July and August instead of the previously agreed 432,000 bpd. OPEC decision to increase production targets slightly more than planned.
As a result of that expectation, it will have little effect on tight global supply and by increasing demand as China loosens Covid restrictions.
From the existing fundamental trend, the oil price tends to be bullish, it is possible that the price will breakout the resistance area. However, market participants still think the price of oil is too high, this can make the price rebound to the resistance area, and make the price will correct down.
OIL 26th MAY 2022

WTI Crude Oil Hold above 21-EMAWTI on track for further downside. Bears eye cloud support at 109.23.
WTI remains on the back foot for the third consecutive session, OPEC meeting in focus

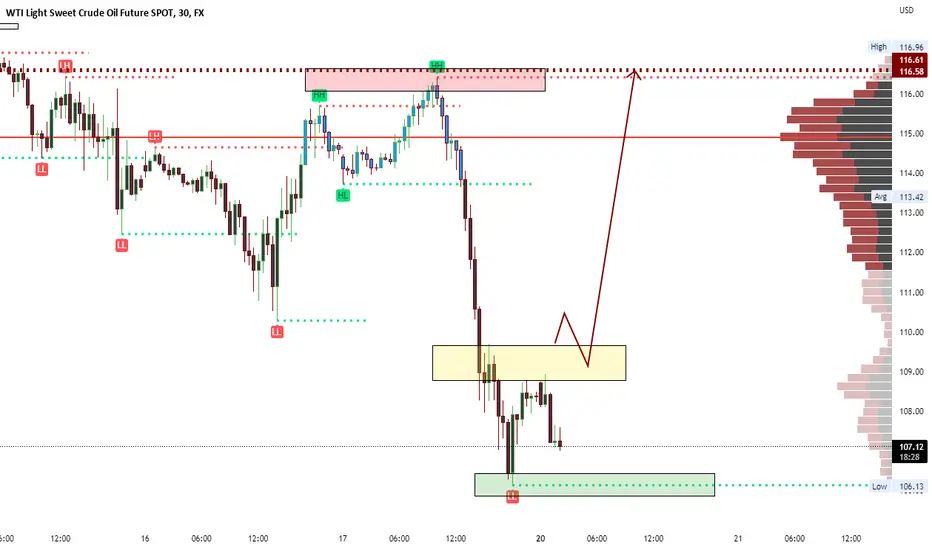
CRUDE OIL (WTI) Very Bullish Outlook 🛢
Crude oil is retesting a solid horizontal key level.
The price formed a cute double bottom formation on that and broke its neckline.
Now I expect a bullish rally to 117.6 / 119.0
❤️If you have any questions, please, ask me in the comment section.
Please, support my work with like, thank you!❤️

CRUDE OIL SELL BIG DOWNSIDETime To Exit Longs in Crude WTI Will See Big Downside Till Todays Close Target will be 114. and 111.50

US Oil WTI mid term outlookI think we will see another new high within the ongoing correction in the form of the orange z at the beginning of next week. Subsequently, the price should fall to the 1.00. Only afterwards, the rally could continue and WTI form a multi-year high in the area of $ 137

Oil falling to a lower SupportHave a look at my IDEA!
It seems like that OIL has hit a Resistance again and will fall back to its Support.
Share your thoughts with US, please

USOIL 26th MAY 2022The United States government said US crude stockpiles fell by one million barrels last week, with gasoline inventories also falling slightly. The oil and gas commodity did not budge after volatile trade as fears of tight supply offset concerns over a possible recession and China's Covid-19 restrictions. World oil prices turned negative after US Energy Secretary Jennifer Granholm said President Joe Biden had not ruled out using export restrictions to reduce soaring domestic fuel prices. This makes world oil prices tend to be sideways , this is my USOIL trading plan.
