oil Long Position RR 1:4Dear Friends
i see Usoil(WTI) in good momentum and in yellow area take a position for RR 1:4 but take care to Trace in h1 if strong Bullish Candle you saw , Save Profit in 1:3 and more
Wticrudeoil

WTI - Next week CRUDE OIL AnalysisMy thoughts on WTI. Leave a like if you agree or have the same idea as mine.

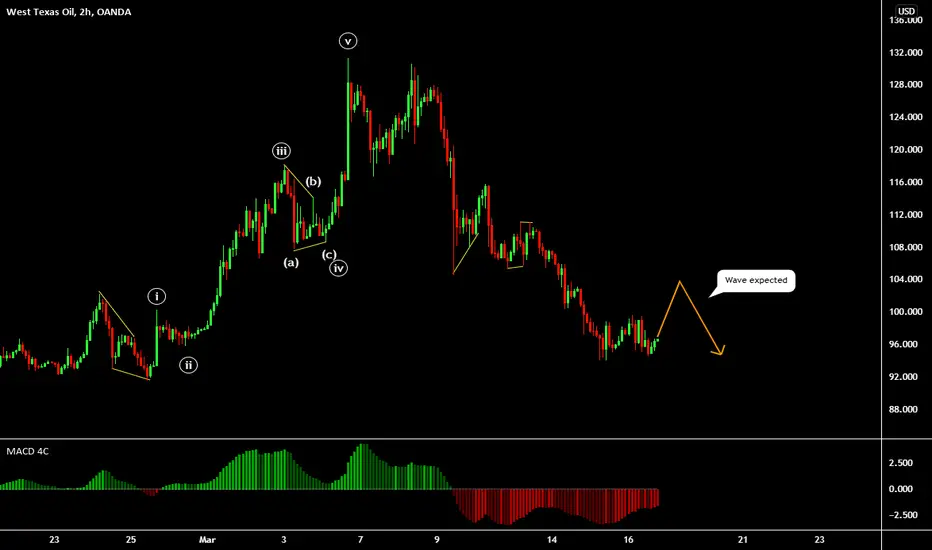
WTIUSD OIL bearish mediumtermWTIUSD OIL bearish
WTI broke below a key long-term pennant that had been squeezing the price action earlier in the week, with some technicians taking this as a sign that WTI will fall back towards support in the $90 area.
Projection would be 60. But on Mediumterm i think we will have conditions to go to 93.50 or 90.00. Would be our targets.
I will be a false breakout we will recover to retest ma50 4h near 102 area.
For now seems we retested today the pennant and we have conditions to have an impulse to the downside.
Targets. Supports, Resistances on chart.
I will love to read your comments. Please put a like, join use following and give us your comment.
Be carefull, patient and discipline.
❗ DISCLAIMER ❗
This post does not provide financial advice. It is for educational purposes only! You can use the information from the post to make your own trading plan for the market.
But you must do your own research and use it as the priority. Trading is risky, and it is not suitable for everyone. You deserve the profit and you are responsible for your potential loss.
Only you can be responsible for your trading.
Any opinions, news, research, analyses, prices, or other information discussed in this presentation or linked to from this presentation are provided as general market commentary and do not constitute investment advice.
This Plan can be changed anytime, depending on how the price will arrive at the level and what will be happening on my level of interest for entry. Then I will decide if I will enter or not.
So please don't just blindly follow this. The author of the analysis does not accept liability for any loss or damage.
Legal Risk Disclosure
Trading foreign exchange or CFD on margin carries a high level of risk, and may not be suitable for all investors. The high degree of leverage can work against you as well as for you.
Before deciding to trade foreign exchange you should carefully consider your investment objectives, level of experience, and risk appetite.
The possibility that you could sustain a loss of some or all of your initial investment and therefore you should not invest money that you cannot afford to lose.
You should be aware of all the risks associated with foreign exchange trading, and seek advice from an independent financial advisor.
The FX market is a quickly changing environment and it requires full focus on the levels for the precise entry with low risk.

US oil will try to reach for new high Biden's new policy of releasing preserved oil could be effective if the war finishes earlier.
but it seems to be long run.
Also the monthly candle is pointing out the edge high to upperside.
This energy and circumstances will create new high for the WTI oil.

WTI OIL UPTREND TO 110WTI OIL UPTREND TO 110
Disclaimer:
I am not a financial advisor nor am I telling you what to do with your capital.
I am simply stating my thoughts on the financial markets.
Take what I say with caution and do your own research.
The financial markets are risky and should be treated as such. You are 100% responsible
for all of your actions within these markets, I am not at fault for any losses or wins you may acquire.
I never tell anyone what to do in these markets, I am simply making my opinions public.
Results are not typical so anything can happen in these markets, so proceed with caution.

Crude oil #WTI Long position 1:3 RRDear Friends
This Week i See WTI chart bullish so for First Postion I suggest Take Long Postion As Described in Picture
Risk:Riward=1:3 Free 80% Cash and Move SL To Last 1H Swing Low

Buy or Sell decision on Oil is about to comeAs expected price broken down the wedge which is a reaction of 618 retracement of the downside movement. This will potentially create an impulse move to the downside when price retrace a little bit up and unable to break the resistance. However, it's also in its crucial area as it rejected in SMA(20). Buy Oil when price breaks up the resistance / the last swing high

WTI OIL Can the death fractal of 2008 be repeated?We haven't looked into WTI Oil recently, the last post I made was on March 08, calling what I thought at the time as the medium-term peak:
The price did eventually pull-back to the 1D MA50 (blue trend-line) and rebounded as it constitutes the medium-term Support, following the March 2021 sequence.
On a much larger scale though, and since the war isn't over yet and inflation runs wild, I thought it would be beneficial looking at the last time similar conditions were leading the Oil market higher. Sadly, that was during the 2008 peak of the U.S. Housing Bubble.
As you see, today's 2021-2022 fractal can be related to a great extent to the 2007-2008 sequence. If the market dynamics have been indeed aligned as in 2008, then Oil has entered the final phase towards the blow-off top, as it rebounded on its 1D MA50. Now of course, reaching the 2.382 Fibonacci extension around $178.00 for a blow-off top, seems even under the latest aggressive conditions, as unrealistic. But a value around $150.00 as a Higher High to the March 08 shock, could very well be printed.
Do you think the market will follow in 2008's footsteps and if so what is your projected top?
--------------------------------------------------------------------------------------------------------
** Please support this idea with your likes and comments, it is the best way to keep it relevant and support me. **
--------------------------------------------------------------------------------------------------------

WTI Cude (OIL) BUY TRADE IDEA
Hello Traders, here is the full analysis for this pair,
let me know in the comment section below if you have any questions,
the entry will be taken only if all rules of the strategies will be
satisfied. I suggest you keep this pair on your watch list and see if
the rules of your strategy are satisfied.
Dear Traders,
If you like this idea, do not forget to support with a like and follow.
PLZ! LIKE COMMAND AND SUBSCRIBE

US OIL SELL (WEST TEXAS INTERMEDIATE CRUDE OIL - US DOLLAR)Hi there.
Price is moving impulsively to the downside.
Wait for the price to complete the continuation pattern that its forming and watch strong price action for sell.
WTICO USD SELL (WEST TEXAS INTERMEDIATE CRUDE OIL - US DOLLAR)Hi there.
Price is moving impulsively to the downside.
Wait for the price to form a continuation pattern and watch strong price action for sell.

WTI oil - Price drops due to release of the SPRWTI oil rose to as high as 129.98 USD on 7th March 2022. However, today USOIL fell to as low as 115.51 USD. Currently, the price of USOIL trades around 170 USD price tag. We remain bullish on oil as we expect bullish factors to persist for a while longer. However, we also remain very cautious as we think any progress in peace talks between Russia and Ukraine could possibly put pressure on rising oil prices.
Technical analysis - daily time frame
RSI exhibits extreme strength of the bullish trend as it holds for so long in the overbought territory. However, this raises a warning signal. MACD and Stochastic remain bullish. DM+ and DM- show that same condition in the market. ADX grows which suggests the trend is gaining strength. Overall, the daily time frame is bullish; however, it starts to flash first warning signs.
Technical analysis - weekly time frame
RSI is overbought. MACD and Stochastic are bullish. DM+ and DM- are also bullish. ADX increases which suggests the trend is gaining momentum. Overall, the weekly time frame is bullish.
Please feel free to express your own ideas and thoughts in the comment section.
DISCLAIMER: This analysis is not intended to encourage any buying or selling of any particular securities. Furthermore, it should not serve as a basis for taking any trade action by an individual investor. Your own due diligence is highly advised before entering trade.

WTICO USD SELL (WEST TEXAS INTERMEDIATE CRUDE OIL - US DOLLAR)Hi there.
Price is moving impulsively to the downside.
Wait for the price to form a continuation pattern and watch strong price action for sell.

USOIL BuyWe had a bullish break again. OB is marked in a grey box. Look for a buy from there.
NOTE: I always wait for a candle close below the grey box for setup to invalidate. So either set sl with some margin or manually monitor the price on 15m chart.


There's 90% chance this is the bottom of the $oil pricehistoric falls of oil shows 77% before the next rally. we might be at the end of it. current drop is 77% from near top.
also to notice this is making massive falling wedge, for this to be reality. oil has to close above 20$ on weekly chart. which is most possibly as looking at shorts are very high. short squeez is immanent.

US Crude Oil WTI Long H42008 was the last time US crude oil saw prices above $113 . Using the monthly chart and the Fib retracement fan, I am expecting oil to continue onto the price $120 at minimum with a resistance of $148 or 0 on the Fib scale.


WTI Oil Turning Parabolic 82.50Since WTI Oil broke the former two Resistance levels (74.15 and 77.00), the price turned parabolic outside the Channel Up that dominated most of the price action in September. There seems to be a Buy/ Support Zone consisting of the 4H MA50 (blue trend-line) and the 4H MA100 (green trend-line) and a Resistance Zone on the RSI Higher Highs trend-line.
Technically those two pressure levels should provide the next dip buy and target. I've applied the Fibonacci Channel to assist in finding the target and as you see every Fib extension prices a Higher High (1.0, 1.5, 2.0). Naturally the 2.5 Fib extension is next, I project a Higher High around $82.50.
** Please support this idea with your likes and comments, it is the best way to keep it relevant and support me. **

Crude Oil Finds Buyers on Dips | WTIWTI crude oil prices remain on the front foot at around $91.45, up 1.30% intraday while consolidating the first weekly loss in nine during Monday’s Asian session.
Although fears among the energy bulls could be spotted as the key catalyst for the black gold’s first weekly loss in multiple weeks, geopolitical noise surrounding Russia and Ukraine joins the OPEC+ supply concerns to keep WTI buyers hopeful. It’s worth noting that the Fed’s rate hike chatters and inflation woes add to the upside filters of the energy prices.
That said, Ukraine and the West continue to suggest an imminent Russian military attack on Ukraine. However, Moscow rejects the claims. Recently, a Reuters’ witness said, “Explosion was heard in the center of the rebel-held city of Donetsk in eastern Ukraine.” It’s worth noting that a diplomatic meeting between US Secretary of State Antony Blinken and Russian Foreign Minister Sergei Lavrov can provide a ray of hope to witness a de-escalation of the geopolitical fears and hence the WTI bulls take a cautious approach ahead of the key meeting outcome.
Elsewhere, the OPEC+, a group of the Organization of the Petroleum Exporting Countries (OPEC) and allies led by Russia, struggle to match the output hike promises. Recently, OPEC President Bruno Jean-Richard Itoua mentioned that the oil supply is not now enough and blamed oil companies for not investing enough. "OPEC+ should stick to its current agreement to add 400,000 barrels of oil per day each month to output, ministers of Arab oil-producing countries said on Sunday as they gathered in Saudi Arabia, rejecting calls to pump more to ease pressure on prices," said Reuters.
Alternatively, fears of the Fed’s faster rate hikes and inflation woes challenge oil traders at multi-month highs. On the same line is the latest risk-off mood, portrayed by downbeat US Treasury yields and stock futures.
WTI crude oil traders will keep their eyes on the Russia-Ukraine developments for fresh impulse ahead of the key US-Russia meeting late in the week. Should the tension de-escalate, the odds of witnessing a sharp pullback in the oil prices can’t be ruled out.
Technical analysis:
The 21-DMA precedes a monthly support line, respectively around $89.10 and $87.95, to limit WTI pullback. However, firmer RSI and ability to stay beyond key supports, not to forget strong fundamentals, keep oil buyers hopeful to renew 2022 high, currently around $94.00.
- WTI bulls keep reins despite snapping an eight-week uptrend.
- US highlights possibilities of imminent Russian invasion, Moscow rejects claims.
- DXY fails to cheer risk-off mood amid downbeat yields.
- Fedspeak, PBOC rate decision may offer immediate catalysts, PMIs, US PCE Inflation will be crucial.
- It's important to keep in mind that cryptocurrency markets are extremely volatile, making it difficult to accurately predict what a coin’s price will be in a few hours or a few days and even harder to give long-term estimates. As such, analysts and online forecasting sites can get their predictions wrong. We recommend that you always do your own research and consider the latest market trends, news, technical and fundamental analysis, and expert opinion before making any investment decisions. Be patient and look long-term wisely and never invest more than you can afford to lose.
Trading & Investing both are masters of RISK.
Please comment, like, and follow if it was helpful for you.
Thank you for your time.
Have a profitable day.
| Review and analysis by Samadi.Finance |

Short for USOilSince the dramatic drop May 2020, USOil is in the bullish momentum. It has been in this bullish channel and whenever we touch this trendline, we got reaction. I expect further drop upcoming weeks due to agreement of US and Iran as well. However, markets did not react yesterday. I am betting on a short position, i will go for BE if we reach 88usd, also i am looking closely to USDCAD pair as well.

WTI CRUDE OILFor the fifth week running, WTI Crude Oil made its highest weekly close in 7 years last week and printed a relatively large bullish candlestick which looks healthy, closing very close to the high of its price range. This suggests a further rise to come, with the price perhaps being boosted by fears of war between Russia and Ukraine. There are bullish signs, and I continue to see WTI Crude Oil as an interesting buy.

WTI Crude Oil Forecast: Crude Oil Looking for a PullbackThe West Texas Intermediate Crude Oil market has initially tried to rally during the trading session on Thursday as we have seen a lot of volatility in various markets. That being said, the market has rallied significantly during the course of the trading session, only to turn around and fall towards the $90 level. That being said, we did up forming a bit of a shooting star, and it does suggest that maybe we get a little bit of a pullback.
However, the market has seen a hammer from the previous session, so be interesting to see if we just definitely hang about the $90 level, or if we are going to have a little bit deeper pullback. Quite frankly, I would love to see a little bit more of a pullback, but I do not know that we get it. If we break down below the bottom of the candlestick from the Wednesday session, then I will start looking to pick up this market somewhere around the $86.50 level with an eye on the $85 level underneath being massive support. The 50 day EMA is also reaching higher, and therefore it is likely it will kind of combined to add a massive “floor in the trend.”
If we do turn around a break above the top of the candlestick for the trading session on Thursday, then it could open up a move towards the highs. Either way, I do not have any interest in shorting this market, due to the massive uptrend that we have seen, but quite frankly this is a market that is probably due for some type of correction. This will be especially true if the US dollar starts to spike going forward, which obviously has a small influence on this market.
I think the only thing you can count on at this point is a bit of volatility as we are at a major level, and of course the markets in general are freaking out about the Federal Reserve and the high inflation that we see. If they slam on the brakes by tightening monetary policy, it could drive down demand in the world’s biggest economy, which has a knock on effect in several other economies. Because of this, crude oil will more than likely have to cool off a bit in order to build up momentum to the upside.
