WTI before RESISTANCE ZONE!Technical analysis of WTI CRUDE OIL
The US WTI oil price shows a dynamic long-term upward trend. The last relevant follow-up buy signal in the medium term was generated by the listing at the beginning of June with the bullish dissolution of several weeks of sideways consolidation. Most recently, differences within the OPEC + alliance acted as an informational price driver. The United Arab Emirates and Saudi Arabia could not agree on the specific conditions for an increase in the production quotas in August. Previously, there had been speculation about an upcoming expansion of production by 400,000 barrels per day with a simultaneous extension of the production restrictions until the end of 2022 (currently April 2022). There is now a threat of an expansion of the supply deficit with correspondingly further increases in prices. But some observers do not rule out a complete breakup of the alliance either. That would then mean the elimination of the current production restrictions and a price war, which is likely to put the prices under massive pressure. Market participants are currently interpreting the differences as driving prices. However, the situation is extremely uncertain, as the alliance can get together again at short notice and decide on the planned expansion of production.
Central hurdle ahead
In terms of the chart, the focus is on the long-term significant resistance zone at USD 76.88, which is within shouting distance. There the price had made a cyclical high in October 2018 and had turned into a dramatic bear market. Accordingly, a consolidation at this point would not surprise us. Signals for this remain to be seen, however. We see possible expansion targets in the event of an immediate breakthrough above this hurdle at USD 78.61 and USD 85.20. Looking to the bottom, the listing has closest support areas at $ 74.42 and $ 72.00. A slide below the latter level would, in our view, make a more pronounced correction towards USD 67/68 likely.
Note:
Despite careful analysis, Global Investa accepts no liability for the content, topicality, correctness or completeness of the information provided. The information provided does not constitute investment advice, purchase recommendations or investment brokerage.
Wticrudeoil

WTI: Swing High?A Rising Wedge within a potential Ascending Channel.
And the same old game of waiting for a Breakout and a Retest?
Current PA is:
1. At an Critical Level of $75.00 (Big, Round Number);
2. At the Apex of the Rising Wedge, and
3. Been capped by the Resistance of the potential Ascending Channel.
The coming Candlestick Pattern next week will helps to decide the direction.
Nevertheless, I am Bearish Bias about Oil because of the appearance of a Northern Doji right at the apex of the Wedge. However, take note that it is a Friday Candle before the US Holiday.
I am of the opinion that if ever an Evening Doji Star is developed, it could possibly send the Oil down to well below the $72 areas.
Disclaimer: “Trade at your Own Risk”

WTI bulls welcoming July
Bulls took control before the opening of the London session, taking the American benchmark to fresh grounds testing the $74.52 level. ON WEDNESDAY, the US energy market reported a drawdown of 6.7MM in their inventories, signaling a potential upward momentum.
However, in the long run, we may potentially see a market correction after two months of a clear bullish market.
The Delta COVID variant might bring some concern to the market and the still unheard details from the OPEC+ on how to inject their spare capacity into the market.
In the short-term, the price may challenges recent highs, despite the virus variant and Cartel supply. Although technically speaking, if bulls fail to conquer the $80 mark, we could expect some correction towards the previous supply level in confluence with the ascending trendline around the $66 handle. Let's see what the energy market brings in July.
--
*** If you like the idea, please don't be shy and click on the like button; also, comments are very welcome. | Thanks for your support!!! ***

WTI OIL Channel Up rejection shows strong pull-back nextPattern: Channel Up on 1D.
Signal: Sell as the price got rejected on the Higher Highs trend-line of the Channel Up. This will be confirmed once the 1D MACD makes a Bearish Cross.
Target: The 4H MA200 initially (red trend-line) and the 1D MA50 (blue trend-line) in extension where yuo can shift to a buy.
** Please support this idea with your likes and comments, it is the best way to keep it relevant and support me. **
--------------------------------------------------------------------------------------------------------
!! Donations via TradingView coins also help me a great deal at posting more free trading content and signals here !!
🎉 👍 Shout-out to TradingShot's 💰 top TradingView Coin donor 💰 this week ==> fract
--------------------------------------------------------------------------------------------------------

WTI Oil long positions hit recommended targets around 74 handleBuy signals given around 67-68.50 hit the target of 74 Handle . One more possible upside target is there around 76.50 handle however since the R-R is bad , its not good to enter fresh long positions .


US Oil (WTI Crude Oil)Trade IdeaPrice has finally made it back to the untested supply zone. I expect some bearish price action when it finally makes contact. Price seems overdue for a real retracement. OVB on the Stoch's, as well.

WTI OIL overbought stillPattern: Channel Up on 1D.
Signal: Buy once the price breaks below the 1D MA50 again (blue trend-line).
Target: 76.00 (closer to the top of the inner Channel).
** Please support this idea with your likes and comments, it is the best way to keep it relevant and support me. **
--------------------------------------------------------------------------------------------------------
!! Donations via TradingView coins also help me a great deal at posting more free trading content and signals here !!
🎉 👍 Shout-out to TradingShot's 💰 top TradingView Coin donor 💰 this week ==> mused_Aurorah
--------------------------------------------------------------------------------------------------------


WTI Oil An interesting fractalWhat do you think of this fractal on the 1W time-frame? The price action since mid 2020 resembles that from early 2017 to mid-late 2018. During that time, WTI started off a Channel Down (blue), then as it broke above the 1W MA50 (blue trend-line) it rose aggressive and after it broke above the 1W MA200 (orange trend-line) as well, it entered a a 9 month Channel Up (green) that eventually led to the October - December 2018 collapse. During that Channel Up, a 1W Golden Cross got formed.
Since mid 2020, the price seems to be following the 2017/2018 sequence. We are currently inside the (green) Channel Up. Even the RSI and MACD are printing similar sequences. Will another 1W Golden Cross emerge that will lead the Channel Up to a blow-off top? What do you think?
** Please support this idea with your likes and comments, it is the best way to keep it relevant and support me. **
--------------------------------------------------------------------------------------------------------
!! Donations via TradingView coins also help me a great deal at posting more free trading content and signals here !!
🎉 👍 Shout-out to TradingShot's 💰 top TradingView Coin donor 💰 this week ==> crypto-strong
--------------------------------------------------------------------------------------------------------

WTI Oil : 73.75-76 level possible short term target ?Seems like a clear upside break out with a short term support near 67 handle ( previous resistance) + SSI is around 30% on an average
Trend : Bullish
Signal : Buy @ 68.50 (weekly pivot) , Buy limits above 64.25 - 66.00 (Supports)
Strategy : Split positions
Target : 73.75 - 76 Handle
Stop Loss : Manual close / Parallel position below 64


WTI visited high grounds
The American oil benchmark was able to visit higher grounds, testing the 69.37 handle, a level that hasn't been seen in 2 years.
However, sellers have shown some control in the daily candles forming a bearish pin bar right after the visit. Let's pay attention to EIA inventory report in about 3 hrs.
In case of a correction, the handle about 66.30 shows some strong resistance with 382 Fib and ascending trendline in confluence.

WTI Oil : Upside break out is possible targeting 72-74 Handle As of now trading around 67 area with speculative sentiment index around 20% hence an upside break out is highly possible targeting the 72+ levels coming weeks . However, considering the trade on the last day of month + price around the range top , You can try putting sell limit orders 100-150 pips above the 67 top although success rate will probably very low as the HERD is in mass selling mode.
Trend : Up
Pattern : Possible upside break out
Signal : Buy Dips
Target : 72-74 handle
Trade to try : Sell limit @ 68-68.50
Stop Loss : 69
Target : 63-64
Accuracy : Less than 50%

WTI Oil : Stop Hunt /HH to 67.80 -68.20 handle possibleAfter the stop hunt /HL around 61.65 ,Price returned to the old daily range 63.50-67 indicating it will continue to trade inside the range or an upside break out since the SSI is around 25% and every dip is bought strongly .
Trend : Range
Signal : Sell Limit 67.80-68.20
Stop Loss : 68.75
Target : 65-63.75

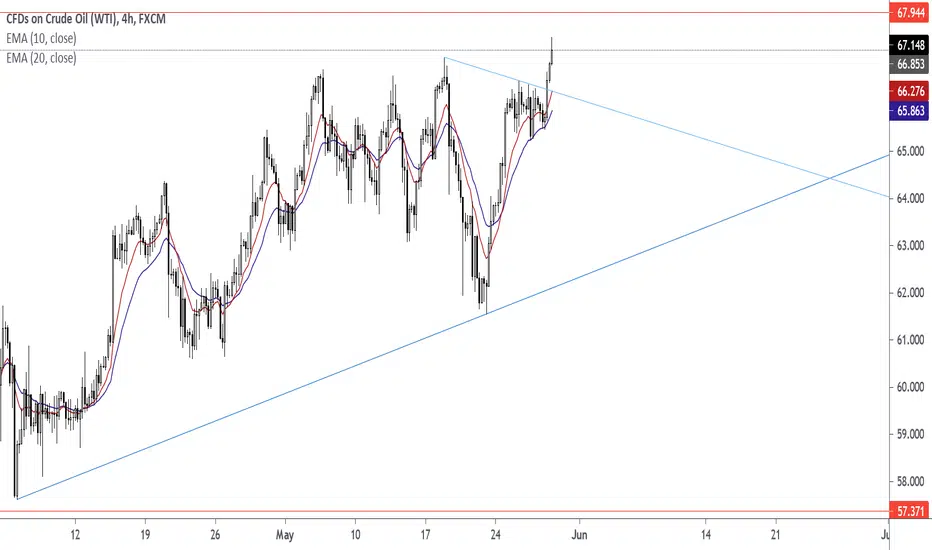
WTI OIL Resistance Zone being tested. Action plan.Pattern: Descending Triangle on 4H.
Signal: As long as the Resistance Zone stays intact, sell (A). If broken buy (B).
Target: (A) 62.50 (the 0.382 Fibonacci retracement level), (B) 68.30 (the 1.618 Fibonacci extension level).
** Please support this idea with your likes and comments, it is the best way to keep it relevant and support me. **
--------------------------------------------------------------------------------------------------------
!! Donations via TradingView coins also help me a great deal at posting more free trading content and signals here !!
🎉 👍 Shout-out to TradingShot's 💰 top TradingView Coin donor 💰 this week ==> NMOTION29
--------------------------------------------------------------------------------------------------------

Crude Oil to 75???? Looks like it...After the recent drop under 60, bulls took control and drove the price to 66 resistance again.
The bullish sentiment for Oil is obvious and a break above this resistance looks imminent
The next technical target is 75

USOIL Can Go Ballistic If This Happens...Traders, USOIL Can Go Ballistic If This Happens:
1. It is right now in an FCP zone which acted as resistance we found good short trades.
2. If this FCP zone is violated and the price action confirms it, we can look for upwards FCP zones that we found in the previous analysis.
3. The first FCP (Fibonacci Confluence Zone) is at good round number USD 70.
4. If expect a move down or some reaction to that zone to the downside
5. If that's broken, we are looking at 74-75 FCP zone.
Beware, this market is over stretched and can have large sudden corrections to the downside.
Rules:
1. Never trade too much
2. Never trade without a confirmation
3. Never rely on signals, do your own analysis and research too
✅ If you found this idea useful, hit the like button, subscribe and share it in other trading forums.
✅ Follow me for future ideas, trade set ups and the updates of this analysis
✅ Don't hesitate to share your ideas, comments, opinions and questions.
Take care and trade well
-Vik
____________________________________________________
📌 DISCLAIMER
The content on this analysis is subject to change at any time without notice, and is provided for the sole purpose of education only.
Not a financial advice or signal. Please make your own independent investment decisions.
____________________________________________________


WTI - MUST GO UP ! Fluctuating stocks, Iran on the horizon, yet oil must rise. primarily because we have an increase in consumption. Then because commodity inflation is increasingly visible. And last but not least, because he is still needed. Long oil!

Technical analysis update: WTI oil (28th April 2021)West Texas Intermediate oil is consolidating in neutral trend since 8th March 2021. Since then, price action took WTI back to its 20-day moving average and 50-day moving average which suggests that consolidation might be near its end and upward movement can be anticipated. This is further supported by reversal in RSI. Our price target for short term is 65 USD per barrel.
Disclaimer: This analysis is not intended to encourage buying or selling of any particular securities. Furthermore, it should not serve as basis for taking any trade action by individual investor. Your own due dilligence is highly advised before entering trade.
