WTI CRUDE INTRADAY OPPORTUNITYWTI Crude is beginning to show signs of weakness after a 4 months bullrun. We see the possibility of a short term sell off to 57.40 a QP level with potential buyside liquidity. There are two potential areas of entry: 60.00 a QP level and 60.62 a OB level. Both positions targeting 57.50 with an oportunity to take some profit at 58.50.
This does not suffice as a signal or financial advice so please do your due deligence.
Wticrudeoil

Open your favorite energy drink boys: we're bullish with wingsMy crystal ball has again spoken to me: USOIL be pumpin' it. And not just from the ground. Covid is saying a big NO to newer sources of energy. This year we're falling back on the good old black gold. So bring out your Justin boots and go loooong on that sweet USOIL, partner.

💡WTI . Weekly Technical Analysis UpdateMidterm forecast:
51.60 is a major support, while this level is not broken, the Midterm wave will be uptrend.
Technical analysis:
While the RSI uptrend #1 is not broken, bullish wave in price would continue.
A trough is formed in daily chart at 51.60 on 02/01/2021, so more gains to resistance(s) 63.10, 66.50, 72.55 and more heights is expected.
Price is above WEMA21, if price drops more, this line can act as dynamic support against more losses.
Relative strength index (RSI) is 79.
❤️ If you find this helpful and want more FREE forecasts in TradingView
. . . . . Please show your support back,
. . . . . . . . Hit the 👍 LIKE button,
. . . . . . . . . . Drop some feedback below in the comment!
❤️ Your Support is very much 🙏 appreciated! ❤️
💎 Want us to help you become a better Forex trader ?
Now, It's your turn !
Be sure to leave a comment let us know how you see this opportunity and forecast.
Trade well, ❤️
ForecastCity English Support Team ❤️


WTICO USD SELL (WEST TEXAS INTERMEDIATE CRUDE OIL - US DOLLAR)Hi there. Price is forming a reversal pattern to change its direction.
Watch strong price action at the current levels for sell.

USOIL VERY IMPORTANT WEEKLY TRENDLINE WTIOIL CRUDE OILUSOIL VERY IMPORTANT WEEKLY TRENDLINE WTIOIL CRUDE OIL

US OIL @ WTIBreak UP of Downward Structure in Monthly .
It may pullback to retest the breakout zone and then continue higher

WTI OIL Buy SignalPattern: Bullish Megaphone on 4H.
Signal: Buy if the 53.90 Resistanct breaks, as the 4H MACD and RSI is repeating the December 02 - 10 bottom fractal.
Target: 56.00 (the 2.0 Fibonacci extension, which has been holding since late November).
** Please support this idea with your likes and comments, it is the best way to keep it relevant and support me. **
--------------------------------------------------------------------------------------------------------
!! Donations via TradingView coins also help me a great deal at posting more free trading content and signals here !!
🎉 👍 Shout-out to TradingShot's 💰 top TradingView Coin donor 💰 this week ==> michaelzerna
--------------------------------------------------------------------------------------------------------

Oil Tested Support At $51.50Oil made an attempt to settle below the support at $51.50 but failed to develop sufficient downside momentum and rebounded closer to the resistance at $52.70. If oil settles above this level, it will move towards the next resistance at $53.30. A successful test of this level will push oil towards the next resistance level which is located near recent highs at $53.80.
On the support side, oil needs to get back below the $52 level to have a chance to develop downside momentum. If oil settles below this level, it will move towards the recent lows near $51.50.

Oil Mixed After API ReportOil has recently made an attempt to settle above the resistance at $53.80 but failed to gain additional upside momentum and pulled back. At this point, oil needs to settle back above $53.30 to have a chance to get to the test of the recent highs. A move above the resistance at $53.80 will push oil towards the next resistance level which is located at $54.40.
On the support side, oil continues to get material support near $52.70. If oil settles below this level, it will head towards the $52 level. A successful test of this level will open the way to the test of the support at $51.50.

Oil Tries To Settle Above Multi-Month HighsOil managed to get above the resistance at $53.30 and made an attempt to settle above the resistance at $53.80 which is located near multi-month highs at $53.90. In case oil settles above this level, it will move towards the next resistance at $54.40. A successful test of this level will push oil towards the $55 level.
On the support side, a move below $53.30 will open the way to the test of the support level at $52.70. In case oil declines below this level, it will head towards the next support at the $52 level.

Oil Moves Towards The Resistance At $53.30Oil managed to get above the resistance at $52.70 and is trying to settle above the $53 level. If this attempt is successful, oil will get to the test of the next resistance at $53.30. A move above this level will push oil towards the resistance near the recent highs at $53.80. In case oil gets above $53.80, it will move towards the resistance at $54.40.
On the support side, the previous resistance at $52.70 will likely serve as the first support level for oil. If oil settles below this level, it will head towards the support at $52.00. This support level has been tested several times in recent trading sessions and proved its strength. A move below this level will open the way to the test of the support at $51.50.

WTI CRUDE LONG TERM VIEWoil prices maybe on the road for another bottom in 2021.
ATH possible in 5 years possible due to massive demands followed by a robust economic recovery .

Oil Tries to Settle Below $52Oil failed to settle above the resistance at $53.80 and gained strong downside momentum. Currently, oil is trying to settle below the support level at $52.00 The next support level is located at $51.50. If oil declines below this level, it will head towards the support at $50.90. A move below $50.90 will push oil towards the 20 EMA at $50.10.
On the upside, oil needs to get back above the $52 level to have a chance to develop upside momentum in the near term. The next resistance level is located at $52.70. If oil gets above this level, it will head towards the resistance at $53.30. A move above this level will push oil towards the resistance at $53.80.

Oil Pulls Back Below The $53 LevelOil managed to get below the $53 level and is trying to settle below the support level at $52.70. If this attempt is successful, oil will head towards the next support at $52. A move below this level will push oil towards the next support at $51.50.
On the upside, oil needs to get back above the resistance at $53.30 to continue its upside move. This resistance level has been tested during the current trading session and proved its strength. The next resistance level is located at $53.80. If oil manages to get above this level, it will head towards the next resistance at $54.40.

WTI OIL needs to hit the 4H MA50 to accumulate buyersPattern: Bullish Megaphone on 4H.
Signal: Buy once contact is made with the 4H MA50 (blue trend-line) and after the price consolidates with a Double Bottom. Every drop below the 4H MA50 has been the optimal buy entry.
Target: 53.90 (the Resistance) and for those seeking more risk 56.00.
Most recent WTI signal:
** Please support this idea with your likes and comments, it is the best way to keep it relevant and support me. **
--------------------------------------------------------------------------------------------------------
!! Donations via TradingView coins also help me a great deal at posting more free trading content and signals here !!
🎉 👍 Shout-out to TradingShot's 💰 top TradingView Coin donor 💰 this week ==> ProjectSyndicate
--------------------------------------------------------------------------------------------------------

Oil Tried To Settle Above $54Oil tested the resistance at $53.80 but failed to develop sufficient upside momentum and pulled back. If oil manages to settle above the resistance at $53.80, it will head towards the next resistance level at $54.40. A successful test of this level will open the way to the test of the psychologically important $55 level.
RSI remains in the overbought territory, and oil has already made an attempt to develop downside momentum which was stopped near the support level at $52.70. If oil declines below this level, it will head towards the next support at the $52 level.

Oil Tests The $53 LevelOil gained strong upside momentum and almost managed to get to the test of the resistance level at $53.30. If oil gets above this level, it will head towards the next resistance at $53.80. A successful test of this level will open the way to the test of the resistance at $54.40.
It should be noted that RSI is in the overbought territory so the risks of a pullback are increasing day by day. The nearest support level for oil is located at $52.70. If oil declines below this level, it will move towards the next support at the $52 level. A move below $52 will push oil towards the support at $51.50.

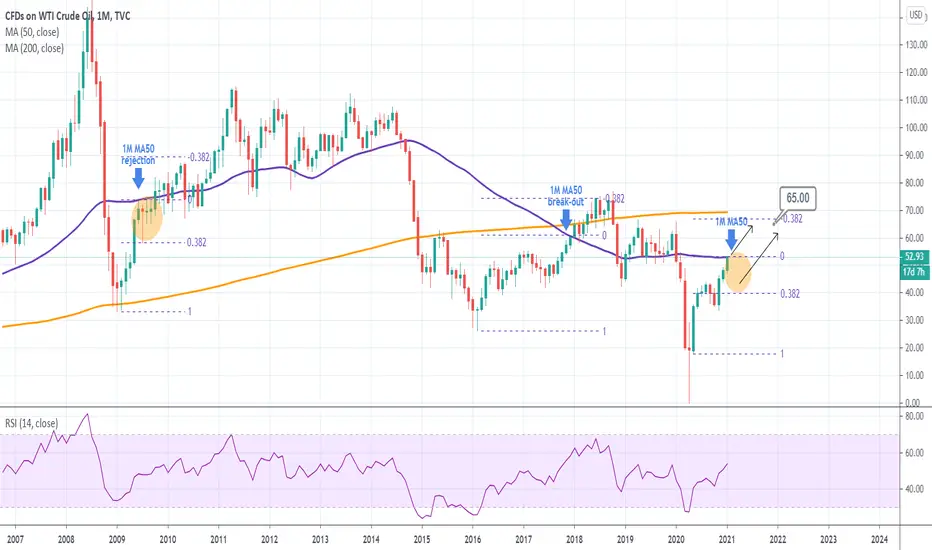
WTI OIL Testing the monthly MA50 for the first time since FebAttention is needed now for WTI Crude Oil traders as the asset has made contact with the 1M MA50. That is the first touch on that trend-line since February 2020, right before the massive March COVID melt-down.
Last time this level was tested as a Resistance, recovering from a similar melt-down, was in December 2017. The price easily broke above it on the next candle and made a top on the -0.382 Fibonacci extension.
Before that, the previous 1M MA50 test as a Resistance, was in June 2009. It failed to close the monthly candle above it and pulled back to the 0.382 Fibonnaci retracement level. Then a few months later, it closed its first candle above it (October 2009) and as in 2018, it peaked just below the -0.382 Fib extension.
What could this mean for oil traders? Well unless we close one 1M candle above the MA50 (53.00), then it is more likely to get a pull back to the 0.382 Fibonacci retracement level (40.00) before the price peaks on the -0.382 extension (65.00).
Do you agree? Feel free to share your work and let me know in the comments section!
Most recent WTI signal:
Please like, subscribe and share your ideas and charts with the community!
--------------------------------------------------------------------------------------------------------
!! Donations via TradingView coins also help me a great deal at posting more free trading content and signals here !!
🎉 👍 Shout-out to TradingShot's 💰 top TradingView Coin donor 💰 this week ==> ProjectSyndicate
--------------------------------------------------------------------------------------------------------
Oil Pulls Back Towards The $52 LevelOil faced strong resistance near $52.70 and pulled back closer to the $52 level. RSI is still in the overbought territory so the pullback has decent chances to continue. If oil manages to settle below the $52 level, it will be able to get to another test of the support at $51.50. A move below the support level at $51.50 will push oil towards the support at $50.90.
On the upside, oil needs to stay above the $52 level to continue its upside move in the near term. The nearest resistance level is located at the recent highs at $52.70. If oil settles above this level, it will head towards the next resistance at $53.30.

