Market Analysis: WTI Crude Oil Crashes As Trade War EscalatesMarket Analysis: WTI Crude Oil Crashes As Trade War Escalates
WTI Crude oil is down over 10% and remains at risk of more losses.
Important Takeaways for WTI Crude Oil Prices Analysis Today
- WTI Crude oil prices extended downsides below the $65.00 support zone.
- A major bearish trend line is forming with resistance near $60.70 on the hourly chart of XTI/USD at FXOpen.
WTI Crude Oil Price Technical Analysis
On the hourly chart of WTI Crude Oil at FXOpen, the price struggled to continue higher above $72.00 against the US Dollar. The price formed a short-term top and started a fresh decline below $70.00.
There was a steady decline below the $65.60 pivot level. The bears even pushed the price below $62.20 and the 50-hour simple moving average. Finally, the price tested the $59.20 zone. The recent swing low was formed near $59.21, and the price is now consolidating losses.
There was a minor move above the $60.00 level. On the upside, immediate resistance is near the $60.70 level. There is also a major bearish trend line forming with resistance near $60.70.
The next resistance is near the $62.20 level and the 23.6% Fib retracement level of the downward move from the $71.97 swing high to the $59.21 low. The main resistance is near a trend line at $65.60.
The 50% Fib retracement level of the downward move from the $71.97 swing high to the $59.21 low is also near $65.60. A clear move above the $65.60 zone could send the price toward $68.70. The next key resistance is near $71.85. If the price climbs further higher, it could face resistance near $72.20. Any more gains might send the price toward the $75.00 level.
Immediate support is near the $59.20 level. The next major support on the WTI crude oil chart is near $58.00. If there is a downside break, the price might decline toward $55.00. Any more losses may perhaps open the doors for a move toward the $52.00 support zone.
This article represents the opinion of the Companies operating under the FXOpen brand only. It is not to be construed as an offer, solicitation, or recommendation with respect to products and services provided by the Companies operating under the FXOpen brand, nor is it to be considered financial advice.
Wticrudeoil

XTI/USD "WTI LIGHT CRUDE OIL" Energy Market Heist Plan🌟Hi! Hola! Ola! Bonjour! Hallo! Marhaba!🌟
Dear Money Makers & Robbers, 🤑 💰💸✈️
Based on 🔥Thief Trading style technical and fundamental analysis🔥, here is our master plan to heist the XTI/USD "WTI LIGHT CRUDE OIL" Energy market. Please adhere to the strategy I've outlined in the chart, which emphasizes long entry. Our aim is the high-risk Red Zone. Risky level, overbought market, consolidation, trend reversal, trap at the level where traders and bearish robbers are stronger. 🏆💸Book Profits Be wealthy and safe trade.💪🏆🎉
Entry 📈 : "The heist is on! Buy above (68.00) then make your move - Bullish profits await!"
however I advise to placing the Buy Stop Orders above the breakout Level (or) placing the Buy limit orders within a 15 or 30 minute timeframe, Entry from the most Recent or Swing low or high level should be in retest.
Stop Loss 🛑:
Thief SL placed at the recent / nearest low level Using the 4H timeframe (66.00) swing trade basis.
SL is based on your risk of the trade, lot size and how many multiple orders you have to take.
Target 🎯:
🏴☠️Primary Target - 71.00 (or) Escape Before the Target
🏴☠️Secondary Target - 74.00 (or) Escape Before the Target
🧲Scalpers, take note 👀 : only scalp on the Long side. If you have a lot of money, you can go straight away; if not, you can join swing traders and carry out the robbery plan. Use trailing SL to safeguard your money 💰.
🛢️ XTI/USD "WTI LIGHT CRUDE OIL" Energy Market is currently experiencing a neutral trend (high chance to bullishness),., driven by several key factors.
📰🗞️Read the Fundamental, Macro Economics, COT Report, Seasonal Factors, Intermarket Analysis, Inventory and Storage Analysis, Sentimental Outlook, Future trend predict.
Before start the heist plan read it.👉👉👉
📌Keep in mind that these factors can change rapidly, and it's essential to stay up-to-date with market developments and adjust your analysis accordingly.
⚠️Trading Alert : News Releases and Position Management 📰 🗞️ 🚫🚏
As a reminder, news releases can have a significant impact on market prices and volatility. To minimize potential losses and protect your running positions,
we recommend the following:
Avoid taking new trades during news releases
Use trailing stop-loss orders to protect your running positions and lock in profits
💖Supporting our robbery plan 💥Hit the Boost Button💥 will enable us to effortlessly make and steal money 💰💵. Boost the strength of our robbery team. Every day in this market make money with ease by using the Thief Trading Style.🏆💪🤝❤️🎉🚀
I'll see you soon with another heist plan, so stay tuned 🤑🐱👤🤗🤩

XTI/USD "WTI Crude Oil" Energy Market Heist Plan (Scalping/Day)🌟Hi! Hola! Ola! Bonjour! Hallo! Marhaba!🌟
Dear Money Makers & Robbers, 🤑 💰💸✈️
Based on 🔥Thief Trading style technical and fundamental analysis🔥, here is our master plan to heist the XTI/USD "WTI Light Crude Oil" Energy Market. Please adhere to the strategy I've outlined in the chart, which emphasizes long entry. Our aim is the high-risk ATR Zone. Risky level, overbought market, consolidation, trend reversal, trap at the level where traders and bearish robbers are stronger. 🏆💸"Take profit and treat yourself, traders. You deserve it!💪🏆🎉
Entry 📈 : "The heist is on! Wait for the MA breakout (71.000) then make your move - Bullish profits await!"
however I advise to Place Buy stop orders above the Moving average (or) Place buy limit orders within a 15 or 30 minute timeframe most recent or swing, low or high level.
📌I strongly advise you to set an "alert (Alarm)" on your chart so you can see when the breakout entry occurs.
Stop Loss 🛑:
Thief SL placed at the recent/swing low level Using the 1H timeframe (68.500) Day / scalping trade basis.
SL is based on your risk of the trade, lot size and how many multiple orders you have to take.
🏴☠️Target 🎯: 73.500 (or) Escape Before the Target
🧲Scalpers, take note 👀 : only scalp on the Long side. If you have a lot of money, you can go straight away; if not, you can join swing traders and carry out the robbery plan. Use trailing SL to safeguard your money 💰.
🛢🔥XTI/USD "WTI Light Crude Oil" Energy Market Heist Plan (Day/Scalping Trade) is currently experiencing a bullishness,., driven by several key factors.
📰🗞️Get & Read the Fundamental, Macro, COT Report, Inventory and Storage Analysis, Seasonal Factors, Sentimental Outlook, Intermarket Analysis, Future trend targets.. go ahead to check 👉👉👉🔗
⚠️Trading Alert : News Releases and Position Management 📰 🗞️ 🚫🚏
As a reminder, news releases can have a significant impact on market prices and volatility. To minimize potential losses and protect your running positions,
we recommend the following:
Avoid taking new trades during news releases
Use trailing stop-loss orders to protect your running positions and lock in profits
💖Supporting our robbery plan 💥Hit the Boost Button💥 will enable us to effortlessly make and steal money 💰💵. Boost the strength of our robbery team. Every day in this market make money with ease by using the Thief Trading Style.🏆💪🤝❤️🎉🚀
I'll see you soon with another heist plan, so stay tuned 🤑🐱👤🤗🤩

Oil - Short Term Buy Idea Update!!!Hi Traders, on March 25th I shared this "Oil - Expecting Retraces and Further Continuation Higher"
I expected to see retraces and further continuation higher. You can read the full post using the link above.
The bullish move delivered as expected!!!
If you enjoy this idea, don’t forget to LIKE 👍, FOLLOW ✅, SHARE 🙌, and COMMENT ✍! Drop your thoughts and charts below to keep the discussion going. Your support helps keep this content free and reach more people! 🚀
-------------------------------------------------------------------------------------------------------------------
Disclosure: I am part of Trade Nation's Influencer program and receive a monthly fee for using their TradingView charts in my analysis.

WTI OIL Approaching a potential rejection level.Our last short-term analysis (March 18, see chart below) on WTI Oil (USOIL) hit the $70.00 Target and is currently extending the uptrend:
We believe however that this uptrend may be coming to a temporary end as not only does it approach the 1D MA200 (orange trend-line) that has been intact since February 03, but also the 73.40 Symmetrical Resistance that kick started the -7.70% September 24 2024 rejection.
As you can this this is also where the 1D RSI 67.00 Resistance is, which has also caused 2 rejections.
Based on that, we will wait for a short on the 1D MA200 to target $68.00.
-------------------------------------------------------------------------------
** Please LIKE 👍, FOLLOW ✅, SHARE 🙌 and COMMENT ✍ if you enjoy this idea! Also share your ideas and charts in the comments section below! This is best way to keep it relevant, support us, keep the content here free and allow the idea to reach as many people as possible. **
-------------------------------------------------------------------------------
💸💸💸💸💸💸
👇 👇 👇 👇 👇 👇

Oil - Expecting The Price To Bounce Higher FurtherH1 - Price has created series of higher highs, higher lows structure
Strong bullish momentum
Higher highs based on the moving averages of the MACD indicator
Expecting retraces and further continuation higher until the two strong support zones hold.
If you enjoy this idea, don’t forget to LIKE 👍, FOLLOW ✅, SHARE 🙌, and COMMENT ✍! Drop your thoughts and charts below to keep the discussion going. Your support helps keep this content free and reach more people! 🚀
--------------------------------------------------------------------------------------------------------------------
Disclosure: I am part of Trade Nation's Influencer program and receive a monthly fee for using their TradingView charts in my analysis.

USOil Key Resistance Hit: Is WTI Crude Due for a Correction?WTI crude oil appears overextended after a strong bullish rally, trading into a key resistance level amid heightened geopolitical tensions and market volatility. The current price action suggests a potential retracement, with equilibrium around the 50% Fibonacci level being a likely target for correction 📉. Given the reactionary nature of the market, traders should remain cautious as political developments could drive further instability ⚠️. While the technical setup supports a pullback, external factors may disrupt this scenario, so risk management is essential. 📊
Disclaimer: This analysis is for informational purposes only and does not constitute financial advice. Always conduct your own research before making trading decisions.

WTI Crude INTRADAY oversold bounce back on maritime ceasefireThe WTI Crude Oil price action remains bearish, aligning with the prevailing downtrend. The current movement suggests an oversold bounce, but the broader outlook remains weak unless a significant breakout occurs.
Key Levels to Watch:
Resistance Levels: 70.50 (critical level), 71.30, 72.11
Support Levels: 67.95, 67.00, 65.40
Bearish Scenario:
A rejection from the 70.50 resistance level could reaffirm the downside bias, leading to a continuation of the bearish move toward 67.95, with further downside targets at 67.00 and 65.40 over the longer timeframe.
Bullish Scenario:
A breakout above 70.50 with a daily close above this level would challenge the bearish sentiment, paving the way for further gains toward 71.30, followed by 72.11.
Conclusion:
The market sentiment remains bearish, with the 70.50 level acting as a crucial resistance zone. A rejection at this level could reinforce the downside trend, while a confirmed breakout would shift the outlook to bullish, favoring a potential rally. Traders should watch price action at this key level for further confirmation.
This communication is for informational purposes only and should not be viewed as any form of recommendation as to a particular course of action or as investment advice. It is not intended as an offer or solicitation for the purchase or sale of any financial instrument or as an official confirmation of any transaction. Opinions, estimates and assumptions expressed herein are made as of the date of this communication and are subject to change without notice. This communication has been prepared based upon information, including market prices, data and other information, believed to be reliable; however, Trade Nation does not warrant its completeness or accuracy. All market prices and market data contained in or attached to this communication are indicative and subject to change without notice.

“WTI Poised for a Renewed Upswing?”On the weekly timeframe, USOIL (WTI) is currently estimated to be in the early stages of wave Y of wave (B). This suggests that USOIL still has the potential to strengthen further, targeting the 72.66–79.14 area.

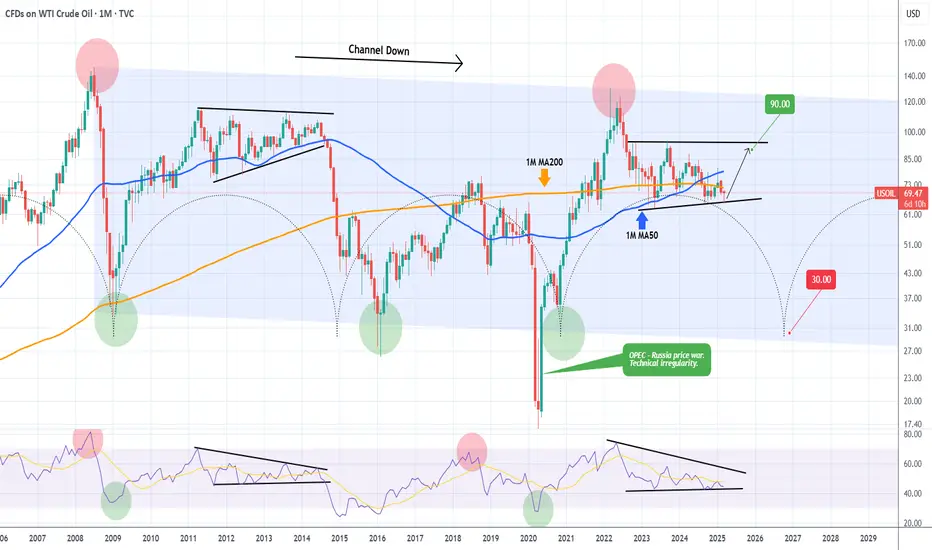
WTI OIL Ultimate long-term guide.WTI Oil (USOIL) has a tendency, like a number of key traditional assets, to follow long-term Cycles. Market psychology more times than not makes investors and the market behave in similar ways (euphoria buying, panic selling) given the same market conditions. Fundamentals and catalysts can often be used as reasons and excuses to confirm the technical trends and long-term Cycles.
Oil is no different and on this 1M time-frame analysis we see why. The dominant multi-year pattern is a Channel Down and it has started on the July 2008 All Time High (ATH). Right now it appears that we are inside a Wedge pattern similar to 2011 - 2014 and more specifically on the final Bullish Leg towards the top.
The 1M RSI sequence among those two fractals is identical so based on all these parameters we believe WTI will test $90.00 by late 2025 - early 2026 and if rejected, start a brutal long-term sell-off towards the bottom of the Channel Down and the 35.00 - 30.00 range by late 2026 as the Time Cycles suggest.
-------------------------------------------------------------------------------
** Please LIKE 👍, FOLLOW ✅, SHARE 🙌 and COMMENT ✍ if you enjoy this idea! Also share your ideas and charts in the comments section below! This is best way to keep it relevant, support us, keep the content here free and allow the idea to reach as many people as possible. **
-------------------------------------------------------------------------------
💸💸💸💸💸💸
👇 👇 👇 👇 👇 👇
Oil - Expecting Retraces and Further Continuation HigherH1 - Bullish trend pattern in the form of higher highs, higher lows structure
Strong bullish momentum
Bearish divergence on the moving averages of the MACD indicator.
Expecting retraces and further continuation higher until the two strong support zones hold.
If you enjoy this idea, don’t forget to LIKE 👍, FOLLOW ✅, SHARE 🙌, and COMMENT ✍! Drop your thoughts and charts below to keep the discussion going. Your support helps keep this content free and reach more people! 🚀
--------------------------------------------------------------------------------------------------------------------
Disclosure: I am part of Trade Nation's Influencer program and receive a monthly fee for using their TradingView charts in my analysis.

Market Analysis: WTI Crude Oil Face HurdlesMarket Analysis: WTI Crude Oil Face Hurdles
Crude oil is attempting a recovery wave but upsides could be limited.
Important Takeaways for WTI Crude Oil Price Analysis Today
- WTI Crude oil prices started a recovery wave from the $66.00 support zone.
- There is a key bullish trend line forming with support at $67.50 on the hourly chart of XTI/USD at FXOpen.
WTI Crude Oil Price Technical Analysis
On the hourly chart of WTI Crude Oil at FXOpen, the price remained in a bearish zone below the $70.00 level against the US Dollar. The price started a fresh decline below the $68.00 support.
The price even dipped below the $67.50 level and the 50-hour simple moving average. Finally, the bulls appeared near $66.00 and the price started a recovery wave. The price recovered above $67.50 and tested the $68.50 zone.
The price is now consolidating gains below the 23.6% Fib retracement level of the upward move from the $66.54 swing low to the $68.48 high. There is also a key bullish trend line forming with support at $67.50.
If there is a fresh increase, it could face resistance near the $68.30 level. The first major resistance is near the $68.50 level. Any more gains might send the price toward the $69.20 level.
The main resistance could be near the $70.00 level. Conversely, the price might continue to move down and revisit the $67.50 support and the 50% Fib retracement level of the upward move from the $66.54 swing low to the $68.48 high. The next major support on the WTI crude oil chart is $67.00.
If there is a downside break, the price might decline toward $66.55. Any more losses may perhaps open the doors for a move toward the $66.10 support zone.
This article represents the opinion of the Companies operating under the FXOpen brand only. It is not to be construed as an offer, solicitation, or recommendation with respect to products and services provided by the Companies operating under the FXOpen brand, nor is it to be considered financial advice.

WTI Price Analysis: Key Insights for Next Week Trading DecisionOil prices are showing signs of recovery after a strong bearish move, with $68.00 as a key level that will play a significant role in guiding our trading decisions for the new week.
📌 Key Technical Outlook:
🔹 Oil is currently trading within an ascending channel on the 4H timeframe.
🔹 I’ll be watching for a breakout/retest of the channel resistance and $68.50 for buying opportunities.
🔹 If selling pressure remains below the resistance line of the channel and the $68.00 key level, I will be considering selling opportunities.
📌 Major Market Drivers:
🔹 US Sanctions on Iran: The US Treasury imposed new sanctions targeting entities involved in supplying Iranian crude oil to China. Analysts expect a 1 million bpd drop in Iranian exports, which could support prices.
🔹 OPEC+ Production Cuts: A new plan will see seven member nations cut production by 189,000–435,000 bpd per month until June 2026.
🔹 Geopolitical Risks: Ongoing tensions in the Middle East & the Russia-Ukraine war continue to add a risk premium to oil prices.
📅 Key Economic Events on Our Radar Next Week:
🛢 Tuesday: API Crude Oil Stock Report – Offers insight into US oil inventory levels.
🛢 Wednesday: EIA Crude Oil Inventories Report – A key supply indicator affecting price movements.
🗓 Tuesday: US S&P Global PMI – Important for economic sentiment and demand expectations.
🗓 Thursday: US GDP (Q4 Final) – Provides clues on economic growth and potential impact on oil demand.
🗓 Friday: US Core PCE Index – The Fed’s preferred inflation measure, critical for policy direction.
Oil remains bullish in the short term, but I’ll be monitoring price action closely at $68.00 and $68.50 for trade setups. We’ll break it all down in Forex Morning Mastery tomorrow—stay tuned! 🔥📈

WTI Crude Oil The Week Ahead 24th March '25WTI Crude Oil bearish & oversold, the key trading level is at 69.50
This communication is for informational purposes only and should not be viewed as any form of recommendation as to a particular course of action or as investment advice. It is not intended as an offer or solicitation for the purchase or sale of any financial instrument or as an official confirmation of any transaction. Opinions, estimates and assumptions expressed herein are made as of the date of this communication and are subject to change without notice. This communication has been prepared based upon information, including market prices, data and other information, believed to be reliable; however, Trade Nation does not warrant its completeness or accuracy. All market prices and market data contained in or attached to this communication are indicative and subject to change without notice.

WTI - Weekly Forecast - Technical Analysis & Trading IdeasMidterm forecast:
While the price is above the support 64.000, resumption of uptrend is expected.
We make sure when the resistance at 79.361 breaks.
If the support at 64.000 is broken, the short-term forecast -resumption of uptrend- will be invalid.
TVC:USOIL BLACKBULL:WTI
Technical analysis:
A peak is formed in daily chart at 79.355 on 01/15/2025, so more losses to support(s) 64.900 and minimum to Major Support (64.000) is expected.
Take Profits:
68.354
70.182
72.434
74.449
77.410
79.361
83.961
87.000
93.882
100.802
109.192
126.350
__________________________________________________________________
❤️ If you find this helpful and want more FREE forecasts in TradingView,
. . . . . . . . Hit the 'BOOST' button 👍
. . . . . . . . . . . Drop some feedback in the comments below! (e.g., What did you find most useful? How can we improve?)
🙏 Your support is appreciated!
Now, it's your turn!
Be sure to leave a comment; let us know how you see this opportunity and forecast.
Have a successful week,
ForecastCity Support Team

WTI OIL Massive 4-year Support hit. Bullish reversal ahead??WTI Oil (USOIL) hit on last week's 1W candle the 1M MA100 (red trend-line), a massive long-term Support level that has been holding since the week of April 26 2021, i.e. almost 4 years.
At the same time, the price entered the 2-year Support Zone, which has produced all major Bullish Phases (green Rectangles) during this time span. The last one got rejected twice on the 1W MA200 (orange trend-line).
Given the fact that this most recent rejection formed the current 2-month Bearish Phase (red Rectangle), which even based on 1W RSI terms, is similar to all previous Bearish Phases that found Support on the 2-year Support Zone, we have a massive long-term Support Cluster in front of us.
Naturally, until the 1W MA200 breaks, that should be the first Target of any buy attempts. As a result, we expect $80.00 to be tested by June 2025 the earliest.
-------------------------------------------------------------------------------
** Please LIKE 👍, FOLLOW ✅, SHARE 🙌 and COMMENT ✍ if you enjoy this idea! Also share your ideas and charts in the comments section below! This is best way to keep it relevant, support us, keep the content here free and allow the idea to reach as many people as possible. **
-------------------------------------------------------------------------------
Disclosure: I am part of Trade Nation's Influencer program and receive a monthly fee for using their TradingView charts in my analysis.
💸💸💸💸💸💸
👇 👇 👇 👇 👇 👇

WTI CRUDE OIL: 4H Channel Down targeting 64.00WTI Crude Oil is almost oversold on its 1D technical outlook (RSI = 33.014, MACD = -1.680, ADX = 27.887) but on the lower 4h timeframe its formed a Channel Down that just completed a peak formation. This indicates that it is ready for its next bearish wave, with the previous two registering -6.55% declines. The trade is short, TP = 64.00.
## If you like our free content follow our profile to get more daily ideas. ##
## Comments and likes are greatly appreciated. ##

WTI Price Analysis: Key Insights for Next Week Trading DecisionMarket Overview:
📉 WTI at $66.00: Trading defensively near a three-year low amid tariff concerns and OPEC+ output hikes.
📊 Inventory Build: A larger-than-expected US crude inventory build (up by 3.614M barrels vs. a forecasted decline) is adding pressure on prices.
⚖️ Tariff Uncertainty: Despite Trump's recent executive order exempting goods from Canada and Mexico under USMCA, overall tariff uncertainty remains a key concern.
🔺 OPEC+ Output Increase: For the first time since 2022, OPEC+ has ramped up production, weighing further on WTI.
Technical Insights:
📉 Descending Channel: The 4H chart shows a clear descending channel. Watch for the potential break of the channel's resistance line to the upside.
🎯 Key Level: Next week, the critical level to monitor is $66.50 – consider a buy if prices break above, and sell if they remain below.
Upcoming Catalysts:
⏰ US Employment Data: Keep an eye on the Consumer Price Index, Producer Price Index, Michigan Consumer Sentiment Index, EIA and API report. A weaker-than-expected report could lift the USD and boost oil prices.
Stay Tuned:
I'll provide a detailed update at the beginning of next week. Follow along for more insights and actionable trading strategies!
#WTI #CrudeOil #OilTrading #OilMarket #CommodityTrading #EnergyMarket #OilPrice #MarketAnalysis #TradingInsights #OPEC
Happy trading!
Disclaimer:
Forex and other market trading involve high risk and may not be for everyone. This content is educational only—not financial advice. Always assess your situation and consult a professional before investing. Past performance doesn’t guarantee future results.

Oil Prices Plummet as Trade Tensions RiseOil prices took a hit after Trump's tariffs were announced, and it's essential to understand the reasoning behind this drop.
When US imposed tariffs on Chinese goods, China retaliated by placing tariffs on US goods, including oil. This move led to a decrease in oil demand from China, which is the world's largest oil importer. As a result, oil prices plummeted.
◉ Key Factors Behind the Decline
● Trade Tensions: The escalation of trade tensions between the US and China led to a decrease in oil demand, causing prices to drop.
● China's Tariffs on US Oil: China's decision to impose tariffs on US oil imports reduced demand for US oil, contributing to the price decline.
● Global Economic Slowdown: The ongoing trade tensions and tariffs have led to a slowdown in global economic growth, further reducing oil demand and prices.
● Increased Oil Production: The US has been increasing its oil production, leading to a surplus in the market and contributing to the decline in oil prices.
◉ Technical Observations
● A notable decline in oil prices has been observed since mid-January 2025.
● Prices are currently hovering near the critical support zone around $66, a level that has historically provided a floor for prices.
● If this support level is breached, it may trigger a further decline in oil prices.

WTI Oil Analysis and Trade Idea📊 Dive into a detailed technical analysis of WTI Oil as we explore monthly, weekly, and 4-hour levels, liquidity zones, and potential trading setups. Not financial advice.

WTI crude oil shows the potential for a bounceThis is a bit of a scrappy chart, but I still see the potential for a cheeky bounce.
WTI crude oil is trying to snap a 4-week losing streak, by stalling around a 50% retracement level. Last week's candle was an inverted hammer, and the previous two weeks have both closed above the 50% level.
A bullish divergence formed on the daily RSI (2) ahead price action finding support at the 200-day SMA and 200-day EMA.
From here, the bias remains bullish while prices hold above last week's low. Bulls could seek dips towards the 200-day MAs, with a near-term upside target of $72. A break above which brings $74 into focus, near the monthly pivot point.
Matt Simpson, Market Analyst at City Index and Forex.com

WTI OIL potential rejection leading to the Channel's bottom.WTI Oil (USOIL) has been trading within a Channel Up pattern on the 1D time-frame with the price on a Bearish Leg since its January 15 Higher High.
The price is right now being rejected on its 1D MA50 (blue trend-line) and based on the last two main bearish sequences since July 2024, a 1D MA200 (orange trend-line) max rejection is quite possible here to continue the Bearish Leg.
Our Target is the bottom of the Channel Up at $69.
-------------------------------------------------------------------------------
** Please LIKE 👍, FOLLOW ✅, SHARE 🙌 and COMMENT ✍ if you enjoy this idea! Also share your ideas and charts in the comments section below! This is best way to keep it relevant, support us, keep the content here free and allow the idea to reach as many people as possible. **
-------------------------------------------------------------------------------
Disclosure: I am part of Trade Nation's Influencer program and receive a monthly fee for using their TradingView charts in my analysis.
💸💸💸💸💸💸
👇 👇 👇 👇 👇 👇

WTI Oil Trade IdeaWTI oil has reached a key support zone and appears overextended on the four-hour chart. I'm considering a counter-trend scalp, as demonstrated in the video. This is not financial advice.
