WTI CRUDE OIL: First time on the 1W MA50 since August 2022!WTI Crude Oil reached the 1W MA50 on today's session for the first time since the weekly candle of August 29th 2022, so the level has been kept intact as a Resistance for 11 months straight. The 1W time-frame is neutral (RSI = 54.478, MACD = -1.030, ADX = 19.324) indicating that on such a strong long term Resistance, this is a low risk sell entry.
We will trade this however after a bearish breakout and the trigger will be give if the price crosses under the HL trendline, in which case we will target slightly over the 1D MA100 and S1 (TP = 74.00). Beyond that, if a subsequent rebound gets rejected on the 1D MA200, we will sell again and target slightly over S2 (TP = 67.10).
Watch if the 1D RSI gets rejected on the 68.75 Resistance. It will be a Double Top rejection.
Prior idea:
## If you like our free content follow our profile to get more daily ideas. ##
## Comments and likes are greatly appreciated. ##
Wtioil

WTI CRUDE OIL: Critical triple Support level. Huge downside beloWTI Crude Oil got heavily rejected on the 1D MA200 on Friday (the 1D RSI also on the oversold 70.000 level), the long term technical Resistance of the asset, and now the 1D timeframe is very close to turning neutral (RSI = 55.9310, MACD = 1.200, ADX = 35.829) for the first time since July 5th.
Today the price has hit three key support levels, the HL trendline since the bug rally started, the 1D MA100 and the 4H MA50. Practically, a candle close under the 1D MA100, is a sell extension validation and we will see to target first the 1D MA50 (TP1 = 71.75) and secondly the S1 (TP2 = 66.80).
As long as the Triple Support holds, we will buy since the risk is very low and target the 1D MA200 again (TP = 76.90).
Prior idea:
## If you like our free content follow our profile to get more daily ideas. ##
## Comments and likes are greatly appreciated. ##

WTI ANALYSIS after change of charatcter we will see a retracement of the price to fill FVG '' FareValueGAp'' and retest ob ''order block'' after we will see a continuation to wards supply zone

WTI CRUDE OIL approaching the MA200 (1d) for the ultimate sellWTI Crude Oil crossed over the MA100 (1d) and is headed for the MA200 (1d) where 3 months ago (April 12th) had the strongest rejection possible.
This is a strong technical sell opportunity, with the price also being near the top of the 1 year Channel Down.
Trading Plan:
1. Sell on the current market price.
Targets:
1. 66.80 (Support 1) and if a (1d) candle closes below, extend selling to 63.65 (Support 2).
Tips:
1. The RSI (1d) is headed for the 70.00 overbought level. Last time that high it was on the April 12th High rejection.
Please like, follow and comment!!
Notes:
Past trading plan:

WTI CRUDE OIL Over the 1day MA50. Bullish break out.WTI Crude Oil closed yesterday over the 1day MA50 for the first time since April 28th. The 1day MA50 was a Resistance with 3 clear rejections since.
This is a technical bullish breakout, targeting the 1day MA100 at 73.50.
If rejected there, sell and target the Support Zone at 67.50.
If it closes a candle over the 1day MA100 too, buy again and target the 1day MA200 at 76.50.
The 1day RSI is on a Rising Support, which can be used as a sell target and buy entry.
Previous chart:
Follow us, like the idea and leave a comment below!!

wti scalp trade trade scalp on wti
tp 20 to 30 pip
and after 20pip risk free
no stop but You just have to follow the capital management
You will enter one tenth of the capital
Consider the spread

✅WTI OIL BREAKOUT|LONG🚀
✅WTI OIL broke the key
Horizontal level of 69.7
So out local bias is bullish
And I think that the price
Will go further up
LONG🚀
✅Like and subscribe to never miss a new idea!✅

Short Crude Oil on ResistanceIn crude oil trading today, we made good profits in the trading strategy of shorting crude oil in the 70.6-70.8 area twice.
Judging from the current structural trend, crude oil will maintain range shocks in the short term, and fundamentally still maintain a short position. Although the inventory data has declined for two consecutive weeks, the pressure on the demand side is still very weak, and the U.S. dollar index has rebounded.Crude oil as a whole tends to run in a bearish trend. In terms of short-term structure, crude oil is currently facing the resistance of 71-71.2. If this area cannot be effectively broken through, then crude oil may still fall to the 69 position area at any time.
Therefore, before crude oil fails to break through the short-term resistance, it is mainly to short crude oil.
USOIL: @70.8-71 Sell, TP: 70.2
For more trading signals and trading plans, you can follow the bottom of the article to view the details!

🚨 WTI HIGH PROBABILITY BUY SETUP 🚨🚨 WTI HIGH PROBABILITY BUY SETUP 🚨
* Here we can see clearly the next potential move for West Texas Oil in coming trading week.
* It's going to be worth keeping a close eye on this trade, as WTI can generate tremendous profits if it is right trade.
* EP(BUY): 69.701
* TP: 70.747
* TP1: 71.550
* TP2: 72.153
* SL: 68.547
* Keep your eye close on your trading positions.
* Happy pip hunting traders.
* FXKILLA *

WTI rallies form range lows - break of $70 up next?WTI crude posted a strong rally from the $67 support level thanks to another strong drawdown of crude inventories. The fact it rallied over 3% despite the stronger US dollar and hawkish comments from Powell makes us wonder if it could have broken above $70 were the dollar not to dominate FX majors on Wednesday. Still, prices are trading within a range between $67 - $72/73, and whilst prices action remains choppy o the daily chart there are some opportunities to trade the range on lower timeframes.
A triple bottom has formed on the daily along with a 2bar bullish reversal (bullish piercing line). String volumes accompanied the rally from the $67.50 area to show demand around those lows and the OBV (on balance volume) broke above its previous swig high, which hints at a breakout for prices.
Prices are drifting higher at the open, but we’d consider bullish setups above or around the daily pivot point or 10/20 EMAs if prices pullback for a potential swing-trade long to $70.A break above which brings the resistance zones around $71 and $72 into focus.

WTI CRUDE OIL Straight buy and sell at the top approach.WTI Crude Oil / USOIL has rebounded again on the 2 month Support Zone.
It is under both the 4hour MA50 and MA200, so still a buy opportunity on the short term.
Buy and target the 1day MA100 and Rising Resistance at 73.50.
Then switch to selling again and target Support Zone at 67.50.
Previous chart:
Follow us, like the idea and leave a comment below!!

WTI CRUDE OIL at the bottom of the Channel Up. Buy.WTI Crude Oil reached the bottom of the 10 day Channel Up.
The RSI (4h) indicates that we may be at a bottom level similar to May 15th.
Trading Plan:
1. Buy on the current market price.
2. Sell at 73.50.
Targets:
1. 73.50 (MA100 1d).
2. 67.00 (Support 1).
Tips:
1. The RSI (4h) gives the strongest buy signal after it crosses under the 30.00 oversold level. Technically that is at 67.00. Use this indication to your advantage for a medium term buy.
Please like, follow and comment!!
Notes:
Past trading plan:

Another bounce for Crude oil from this support? Crude oil is cheap again.
It bounced from this support previously, looking at the daily chart.
Traders await the FED policy meeting and new interest rate announcement. They should pause the hikes for the foreseeable future.
Targeting $71+ and $74+.

WTI sideways opportunity 12June2023WTI OIL
Is there an opportunity?
looking at the market structure in the last few weeks there has been a sideways with a fairly high distance.

XTIUSD BuyAs we have seen in gold that gold has formed a triangle patteren and now if we see at Crude Oil its also forming this wedge and has complete its E wave after completion of ABCD now it will be going Upwards so we will buying this commodity after it breaks 72.89 level and price sustain there then it will be a bullish move to 73.74 price level so we wil be waiting for price action while am posting this idea seems like there is a Bullish engulfing or morubozu is forming On H1 time frame so we will until we get a clear Price action too..

WTI Crude Oil Sell TP = 42.67On the weekly chart, the trend started on March 13, 2022 (linear regression channel).
There is a high probability of profit, since the channel is not yet closed. A possible take profit level is 42.67 ( this is the minimum take profit value, but it has a high percentage of payoff ).
But don't forget about SL = 98 .
Using a trailing stop is also a good idea!
Please leave your feedback, your opinion. I am very interested in it. Thank you!
Good luck!
Regards, WeBelieveInTrading

WTI OIL decline continuation and potential bounce around 69.40.WTI Oil (USOIL) almost hit our 75.00 target with Monday's gap up, as we discussed on our analysis last week (see chart below):
The rejection was made slightly above the 1D MA50 (blue trend-line) and the Higher Highs trend-line. We now expect this pull-back to test the 69.40 Symmetrical Support and rebound. Our new target will be 74.00, at the bottom of the Triangle rejection Zone and below both the 1D MA50 and possibly at the time the 1D MA100 (green trend-line).
-------------------------------------------------------------------------------
** Please LIKE 👍, FOLLOW ✅, SHARE 🙌 and COMMENT ✍ if you enjoy this idea! Also share your ideas and charts in the comments section below! **
-------------------------------------------------------------------------------
💸💸💸💸💸💸
👇 👇 👇 👇 👇 👇
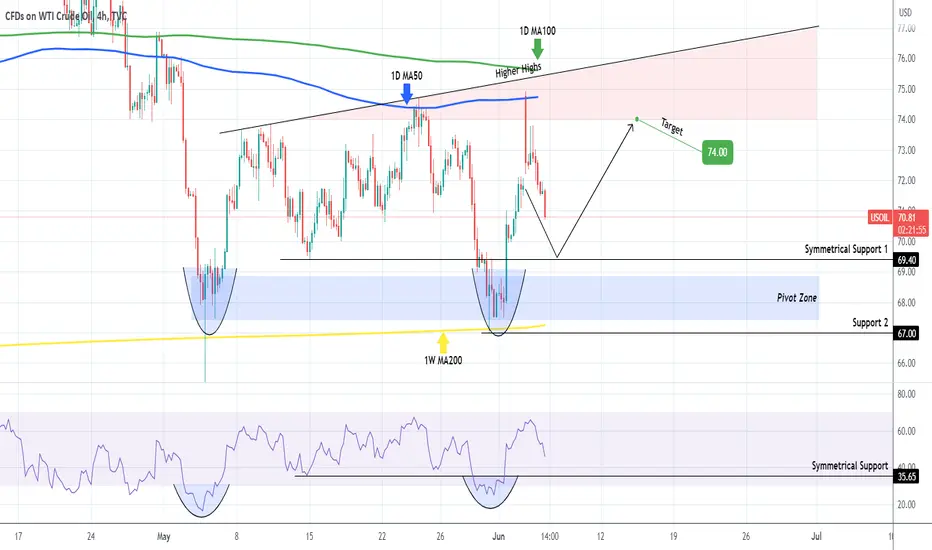
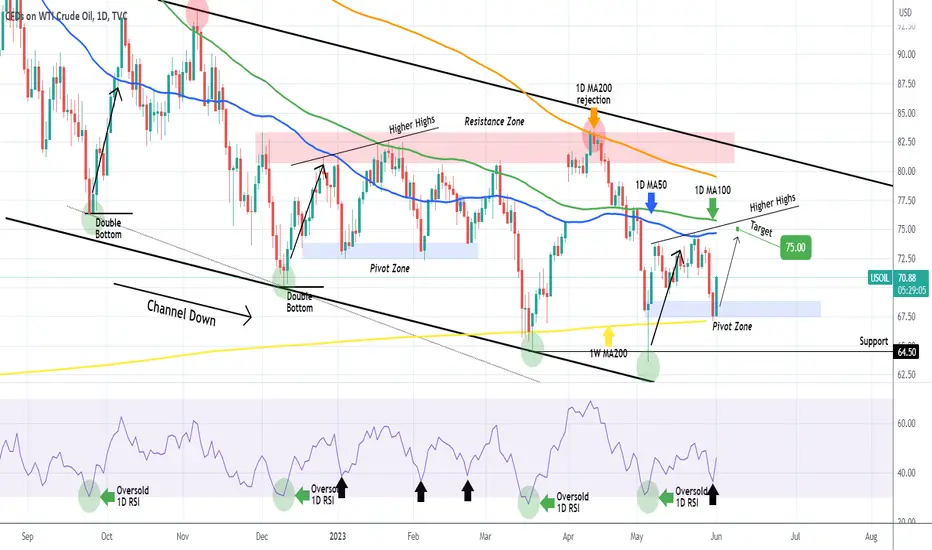
WTI OIL Buy signal targeting the 1D MA100.WTI Oil (USOIL) reversed after hitting our previous target (see chart below) and is now rebounding again:
As you see it bounced off the previous Support Zone of the candle bodies, which we view it as a Pivot Zone similar to the one formed on December 16 2022. On both sequences the 1D RSI rebounded after almost turning oversold (below 30.00) and the current rebound was from the symmetrical 37.50 level.
The technical target is the Higher Highs trend-line and the 1D MA100 (green trend-line), as it did on January 18, which we project to be at 75.00. Keep in mind that since November 04 2022 (almost 7 months) of long-term Channel Down trading, the price almost hit the 1D MA100 before getting rejected.
-------------------------------------------------------------------------------
** Please LIKE 👍, FOLLOW ✅, SHARE 🙌 and COMMENT ✍ if you enjoy this idea! Also share your ideas and charts in the comments section below! **
-------------------------------------------------------------------------------
💸💸💸💸💸💸
👇 👇 👇 👇 👇 👇
USOIL is getting cheapWe recently noted that an interesting opportunity to go long oil could be on the horizon soon. Accordingly, we waited patiently for the price to fall below $70 per barrel. Now, with the price trading near $68.80, we are starting to consider the price attractive to go long. However, we think it is proper not to use all the firepower yet as technicals still point to more downside. Therefore, our plan is to start accumulating in very small batches and unload the stash with the price retracing back above $70. With that said, we would like to set a price target for USOIL at $71.
Technical analysis
Daily time frame = Bearish
Weekly time frame = Bearish
Please feel free to express your ideas and thoughts in the comment section.
DISCLAIMER: This analysis is not intended to encourage any buying or selling of any particular securities. Furthermore, it should not be a basis for taking any trade action by an individual investor. Therefore, your own due diligence is highly advised before entering a trade.

WTI CRUDE OIL Sell continuation at least to 64.50WTI Crude Oil / USOIL is on a strong 1 week selling streak after the rejection on the 1day MA50.
With the MACD on a Sell Cross and the price long broken under the Rising Support, every similar past sequence hit at least Support A.
You can even sell on the current market price and target 64.50.
The long term trend remains heavily bearish inside almost a yearly Channel Down. Every contact with the 1day MA100 is a sell opportunity.
Previous chart:
Follow us, like the idea and leave a comment below!!

Bullish opportunity for oil might be on the horizon soonFor some time now, we held the view that the price of West Texas Intermediate crude oil would remain volatile, trapped within a wide range between $70 and $82. Then more recently, we stated that the oil price was likely to break below $70 as the U.S. administration sought to unload more crude oil from its Strategic Petroleum Reserves. Today, we would like to highlight (again) how the United States has continued to play a carefully calculated game in the oil market for the past two years.
Between 7th January 2022 and 6th January 2023, the U.S. administration drained its crude oil in Strategic Petroleum Reserves (SPR) by approximately 221,8 million barrels (by 37% in the respected period), selling a significant portion of the stockpile at a relatively high price. By doing so, the administration put pressure on rising energy costs, which, combined with other factors, helped drive the price of WTI crude oil from nearly $130 per barrel on 8th March 2022 toward the $70 price tag in the first half of 2023.
With the oil prices being down by approximately 45% from their 2022 highs and SPR being drawn by 39% from 7th January 2022 (up to date), the U.S. government is (unsurprisingly) changing its policy concerning Strategic Petroleum Reserves. Last week, U.S. Energy Secretary Jennifer Granholm notified the public that the Energy Department would begin refilling SPR as soon as next month.
We think this process could make a good case for a temporary rebound in the oil price and thus bring an interesting opportunity to go long (though only for a very limited time) if the price falls below $70 again. Until then, however, we will stay on the sidelines and patiently wait. If the price drops below Support 1 at $69.44, we will reassess the situation and (potentially) start looking for attractive entry-level.
Technical analysis
Daily time frame = Neutral/Slightly bearish
Weekly time frame = Neutral/Slightly bearish
Please feel free to express your ideas and thoughts in the comment section.
DISCLAIMER: This analysis is not intended to encourage any buying or selling of any particular securities. Furthermore, it should not be a basis for taking any trade action by an individual investor. Therefore, your own due diligence is highly advised before entering a trade.

WTI OIL aiming for an UPSIDE reversal.WTI net buys has been steadily increasing this past few days -- conveying accumulation at the current discounted price range.
WTI just touched 1.0 FIB LEVEL -- the most discounted price range you can get. Expect some notable bounce from the present levels.
The 70.0 level is a strong solid support which has been tested many times in the last 6 months -- and price keeps bouncing off it.
Weekly higher lows has been created signifying that the present price as the last base before the incoming series of ascend.
Spotted at 72.0
TAYOR
Safeguard capital always.

WTI - Trade Setup Structure: Solid power move to the support zone aligned with the 200 MA Strateg
Trade: Short - A bounce back expected from this level
Risk/Reward: 1:2
Disclaimer: DYOR!
