WTI OIL Inverse Head and Shoulders cementing the bottom.WTI Oil (USOIL) is forming an Inverse Head and Shoulders (IH&S) pattern on the 4H time-frame, which is a technical bottom and bullish reversal formation. The 4H RSI is on a Higher Lows trend-line, indicating an uptrend and already above the 50.00 neutral mark. One last pull-back to the 65.70 Symmetrical Support is possible, before a strong rally targeting the 1D MA50 (blue trend-line). Our target is 74.50.
This is an update to our last week analysis:
-------------------------------------------------------------------------------
** Please LIKE 👍, FOLLOW ✅, SHARE 🙌 and COMMENT ✍ if you enjoy this idea! Also share your ideas and charts in the comments section below! **
-------------------------------------------------------------------------------
💸💸💸💸💸💸
👇 👇 👇 👇 👇 👇
Wtioil


WTI OIL Excellent long-term buy opportunity.WTI Oil (USOIL) got its 1D RSI oversold below 30.00 as the market made a new Low since December 09. The last two times the 1D RSI was that low was on the medium-term (Lower) Lows of December 09 and September 26. This is a strong buy signal as every time the Low was priced, it did so on a consecutive 1D Double Bottom candle, which just did today.
The Pivot Zone is the first level of Resistance, but since the Dec and Sep rebounds both hit the 1D MA50 on the way up, we will target that again, setting a medium-term target at 74.50.
-------------------------------------------------------------------------------
** Please LIKE 👍, FOLLOW ✅, SHARE 🙌 and COMMENT ✍ if you enjoy this idea! Also share your ideas and charts in the comments section below! **
-------------------------------------------------------------------------------
💸💸💸💸💸💸
👇 👇 👇 👇 👇 👇

WTI BEARISH OUTLOOKWTI had fallen for 3 consecutive days in Wednesday. The bank crisis is calling banks to deleverage their positions, pulling back on their exposure on oil and causing the price to fall.
International Energy Agency (IEA) is also reporting that the current situation in the oil market is a situation of oversupply, while Russia is looking for buyers for its oil.
The price of WTI broke the support of the rising wedge pattern and continues to drop. Both MACD and RSI indicators are confirming the pattern as well.
If the current scenario continues, the price might reach levels of 62 or even 54.
In the opposite scenario the price might reach levels of 77.5 and pivot into an uptrend.
Risk Disclosure: Trading Foreign Exchange (Forex) and Contracts of Difference (CFD's) carries a high level of risk. By registering and signing up, any client affirms their understanding of their own personal accountability for all transactions performed within their account and recognizes the risks associated with trading on such markets and on such sites. Furthermore, one understands that the company carries zero influence over transactions, markets, and trading signals, therefore, cannot be held liable nor guarantee any profits or losses.

petrol breakdown analysis dear traders petrol has aggressive down so i expect the price will correct this move
follow my advice and have a good trade

WTI CRUDE OIL: Buy inside the Triangle.WTI Crude Oil turned neutral on the 1D time-frame (RSI = 46.669, MACD = -0.040, ADX = 33.066) as it hit the bottom of the 3 month Triangle. This is a confirmed signal to go long (TP = 79.50) targeting the top of the Triangle.
## If you like our free content follow our profile to get more daily ideas. ##
## Comments and likes are greatly appreciated. ##

Short crude oil when reboundingBecause the market is vigilant about frequent and more substantial interest rate increases by the Federal Reserve, concerns about the global recession have increased, and the global stock market has generally weakened, which has dragged down oil prices.
On the daily chart, oil prices continued to weaken in the short term, and fell back after the rebound in the previous trading day was blocked, suggesting strong selling pressure above.From the technical structure point of view, oil prices have still been in a wide fluctuation trend in recent months, and at the same time, they have also formed a short-term wedge-shaped consolidation trend to make a transitional market before the direction is chosen.The current support and strong support for oil prices are the 74.3 line on the wedge-shaped extension cord and the 72.3 line on the extension cord of the shock box below. The resistance above the short period is at the 76.5 line, and the stronger resistance is at the 77.6 line at the intersection of the short-period moving average and the Bollinger band.
In order to facilitate everyone to continue to follow up on my analysis and sharing, you can like and follow me; in addition, I will share the daily real-time strategy in the channel. If you can't follow up in real time, you may make operational errors.You can use the following methods to enter my channel for free to follow the latest news and follow up on market trends in real time.

Will crude oil continue to rebound strongly? Long or short?In the crude oil market, due to the larger-than-expected decline in U.S. crude oil inventories and bullish expectations for Chinese demand, concerns that the Federal Reserve's more aggressive interest rate increases will slow economic growth and weaken oil consumption have limited the rebound in oil prices, so the crude oil market is still uncertain.
Judging from the trend, the current crude oil has rebounded strongly in the short term after fluctuating at a low level, but it is not enough to change the daily shorting situation, indicating that the overall trend of crude oil at a large level is still weak.Although the short-term rebound is shown on the 2-hour level chart, the short-term rebound is quite strong, but the pressure is heavy above, and the short-term continuity is a problem. It may continue slightly, but it is difficult to say how much room there is to continue without breaking the low range for the time being.Short-term may be accompanied by resistance loops, the market has returned to operate within the weak range.
In terms of strategy, yesterday's thinking was also high-level shorting, but today's thinking is still high-level, supplemented by low-level long-selling.
Crude oil is shorted near 77.8-78, and the first target is near 75.5
In order to facilitate everyone to continue to follow up on my analysis and sharing, you can like and follow me; in addition, I will share the daily real-time strategy in the channel. If you can't follow up in real time, you may make operational errors.You can use the following methods to enter my channel for free to follow the latest news and follow up on market trends in real time.

WTI OIL Sell opportunity halfway through the bearish wave.WTI Oil (USOIL) is on a short-term bearish wave after getting rejected on the Lower Highs trend-line of January 23. As the 4H MA50 (blue trend-line) is about to form a Golden Cross with the 4H MA200 (orange trend-line), we are opening a new short-term sell targeting 74.50, right above the Higher Lows trend-line. As you see every 4H Golden Cross has been a respectable sell entry, all of which aimed ad the Higher Lows trend-line.
-------------------------------------------------------------------------------
** Please LIKE 👍, FOLLOW ✅, SHARE 🙌 and COMMENT ✍ if you enjoy this idea! Also share your ideas and charts in the comments section below! **
-------------------------------------------------------------------------------
💸💸💸💸💸💸
👇 👇 👇 👇 👇 👇

USOIL WTI cautiously bullishWith the 4% drop on Tuesday, it appears that USOIL is likely to experience some moderate fluctuations over the next few trading sessions. While there are a number of factors that could impact price action, it seems that the market is currently in a relatively stable state despite the dump.
I would like to outline three potential scenarios:
USOIL could see some gains early today as the falling wedge looks set for reversal.
There may also be some resistance at $77.40, which could limit the extent of any upward movement. with a potential retest of $76.06
Watch out for a potential retest of previous low ($76.07) before finding upwards momentum.
Overall, and right now, I think it is difficult to predict exactly how USOIL will perform today and tomorrow but I'm cautiously bullish plus it's Friday!
Trade safely and don't take my word for it!
❤️📈🔥

Oil prices have stopped falling, and the bulls are back?Crude oil was suppressed by fundamentals and high pressure. Yesterday, the daily line fell all the way, and finally the daily line closed the negative line. Crude oil currently continues to maintain a wide range of oscillations on the daily line. The 4-hour level trend is also after a continuous decline. The current deviation rate is slightly too large, and the technical patterns on the small-cycle trend are also beginning to be gradually repaired, and there is a high probability that there will be some room for rebound and repair in the short-term trend.On the news side, short-term attention will be paid to Powell's further remarks and EIA data within the day.
Operationally, crude oil is recommended to be short at 78.3, below the target of 76.6.
In order to facilitate you to continue to follow up on my analysis and sharing, you can like and follow me. In addition, you can enter my channel for free in the following ways to follow real-time views and operational strategies.
TVC:USOIL TVC:GOLD FOREXCOM:XAUUSD

USOIL stuck between $70 and $82A month ago, we noted that USOIL would likely stay stuck within the wide range between $70 and $82. We outlined several developments that pointed to a neutral trend and said that even if the price fell below $70, we would expect it to be shortlived due to the U.S. administration seeking to refill its Strategic Petroleum Reserves (SPR) near that price tag. A week later, the U.S. announced it would release 26 million barrels of crude oil into the market (in line with its mandate). However, based on the publicly available data, the Strategic Petroleum Reserves have remained unchanged since the start of 2023, at 371.58 million barrels. That indicates U.S. officials are waiting for a higher oil price at which they could unload their reserves at a profit. With the price of USOIL approaching $80 per barrel, this event might not be that far away. Our view has not changed; we still expect the oil price to stay choppy within the wide range for an unforeseeable future.
Illustration 1.01
Illustration 1.01 displays the daily chart of USOIL within the wide range and two simple moving averages. Previously, we said that the flattening of these moving averages indicated a neutral trend.
Technical analysis
Daily time frame = Neutral
Weekly time frame = Neutral
Please feel free to express your ideas and thoughts in the comment section.
DISCLAIMER: This analysis is not intended to encourage any buying or selling of any particular securities. Furthermore, it should not be a basis for taking any trade action by an individual investor. Therefore, your own due diligence is highly advised before entering a trade.

USOUSD Daily: 22/02/2023: Will buyers push the price up?
As you can see, the price is in the bearish structure and we expect the price to see lower levels. I am bearish till the price is below the weekly resistance.
But for now, we can see that price move in the trading range for a while and it means there is huge liquidity on both sides of this range.
In addition, we are under 50% of the previous bearish wave so we are in discount and searching for a buy setup.
In that case, from here or low time frame demand zone with low time frame confirmation we can go long.
our first target can be the supply zone and then 50% Fibo level and finally, above 83.31 we can close our position.
💡Wait for the update!
🗓️22/02/2023
🔎 DYOR
💌It is my honor to share your comments with me💌

WTI: It all comes down to the green… 💵🌿It all comes down to the green . This saying is especially true for WTI as it has yet to dive into the green zone between $70.12 and $35.77. To get this done, the course should push further off the upper side of the turquoise trend channel and drop below the support at $70.08. This should grant WTI direct access to the green zone, where it should finish wave 2 in green before heading northwards again. However, a 32% chance remains that WTI could turn upwards and climb above the resistance at $82.64, in which case the course would develop wave alt.(b) in blue above the upper resistance line at $93.74 first before resuming the descent.

WTI OIL One last upside target. This is the signal to sell.We are updating our WTI Oil (USOIL) outlook on last week's buy signal:
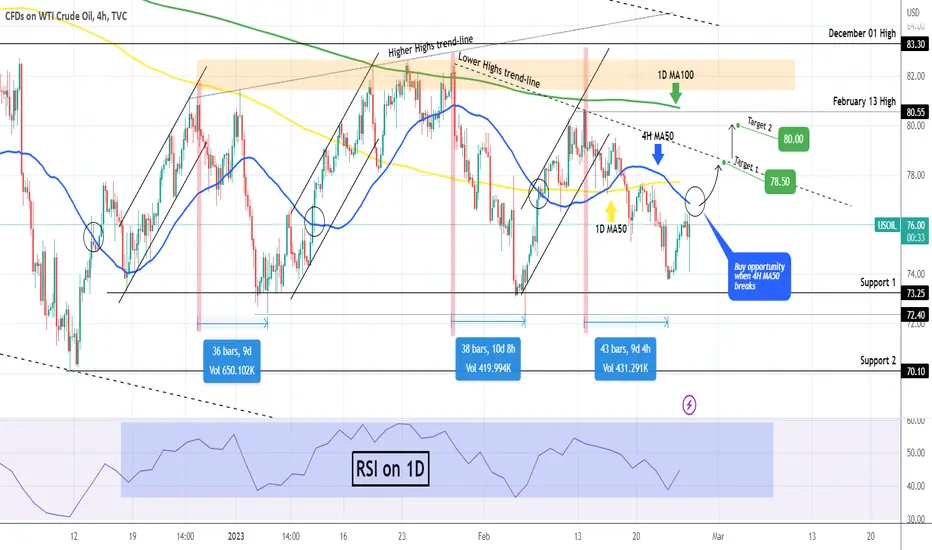
Target 1 (78.50) has been hit as the price reached the Lower Highs trend-line that started on the January 27 High. If a 4H candle closes above this trend-line, you can extend buying towards Target 2 (80.00), which is where the 1D MA100 (green trend-line) is, posing as the Resistance.
We will open sells when the 4H RSI makes a Lower High. This has worked 100% on all three previous Highs of the December - February range.
-------------------------------------------------------------------------------
** Please LIKE 👍, FOLLOW ✅, SHARE 🙌 and COMMENT ✍ if you enjoy this idea! Also share your ideas and charts in the comments section below! **
-------------------------------------------------------------------------------
💸💸💸💸💸💸
👇 👇 👇 👇 👇 👇

WTI OIL Rally is halfway there. Still a buy.WTI Crude Oil is now supported on the MA50 (4h).
The Channel Up that started on Support Zone (1) is similar to all previous 4 Channels that started on that level.
Price got rejected on the Mid level structure, indicating that we are only halfway there.
Trading Plan:
1. Buy on the current market price.
Targets:
1. 80.50 (under Resistance Zone 1).
Tips:
1. The Declining Resistance shows that since November, there have been 2 such Cycles and we are about to completed the 2nd.
2. MACD (4h) right over its neutral level, an additional factor indicating that the Channel Up is halfway there.
Please like, follow and comment!!
Notes:
This is an extension of this trading plan:

WTI OILWTI Oil, a benchmark for crude oil prices, has been gradually rising recently, indicating an uptrend in the market. By analyzing the available charts, it is possible to identify entry points for traders to buy at the same time as identifying an exit point.
To further refine the strategy, traders can use different technical indicators to help them make informed decisions. One potential approach involves looking for a little pullback on the middle trendline, which can serve as a testing ground for a "BUY" signal.
Overall, this strategy can be effective for traders looking to capitalize on the current trend in the WTI Oil market. By carefully monitoring the charts and utilizing appropriate indicators, traders can identify optimal entry and exit points to maximize their profits.

WTI OIL Two break-out buy signals11 days ago we took the best possible sell entry we could have as we shorted the exact top, calling for the best sell opportunity since December:
Right now the price is on a strong rebound, slightly higher than Support 1 (73.25) but with the 1D RSI on a confirmed reversal within its range. If you missed the bottom buy opportunity, wait for a 4H candle closing above the 4H MA50 (blue trend-line) as this was a confirmed buy opportunity on all previous three occasions (circles). First target at 78.50 and if the price closes above the Lower Highs (dashed) trend-line, we will re-buy targeting 80.00.
-------------------------------------------------------------------------------
** Please LIKE 👍, FOLLOW ✅, SHARE 🙌 and COMMENT ✍ if you enjoy this idea! Also share your ideas and charts in the comments section below! **
-------------------------------------------------------------------------------
💸💸💸💸💸💸
👇 👇 👇 👇 👇 👇
AW WTI Crude Oil - Learn The Waves To Never Miss This...This is just an update to show you how you could of already been in what will be a very profitable trade.
Linked below in related ideas is the video that told you to get in at the levels mentioned in this video.
I make these video to show you how learning the waves will make you an amazing trader.
You will catch moves that some people only dream of in hindsight.
All the hard work was put into making the AriasWave methodology over many years.
We will see just how insanely profitable this trade is once we hit those lows.
How will we know when the low is in? ...I will be tracking all these moves as we progress through the coming recession.
This recession will be the last recession before the huge bull market that awaits us once it's done.
I will also be posting another idea soon on how to enter this trade on a pull back when I see the right patterns.
Remember to use Disciplined Money Management Principles to ensure longevity as a trader.
If you don't know the long term pattern shouldn't you be doing your research instead of just following the crowd?
Just remember: I am not a financial adviser; I suggest using this only as a guide. Always do your own research.
***AriasWave is not the same as Elliott Wave so your counts may differ to mine if you happen to use it.***

WTI OIL Perfect shortCrude Oil crossed under Support A on Friday but today is rising and hit the 1day MA50 again. We followed a very successful model last time as indicated below for selling high and buying low:
Based on this, today's rise is the countertrend rebound that both of the previous short constructs followed. We believe it will be short lived and serves as a new sell point. We target 73.50.
Follow us, like the idea and leave a comment below!!

OIL shaping upOil spot is looking promising for a short term buy into a short position at the top of the range. ill be looking for a impulse and continuation pattern to get involved long, whereas the short position will need a strong rejection and break down. Risk management and patience are king!

WTI BULLISH OUTLOOKUS YoY CPI came above expectations yesterday, which led to expectations of further push of the prices. Although US Oil cushion reserve came above expectations, OPEC reported declined production of the month of January, and the expectations are for further increase of global demand for the crude oil.
On the 1H graph the price had broke the resistance of the Flag pattern, suggesting a start of a bullish movement, where, if continues, the price might test levels of 79.63
In the opposite scenario the price might fall to levels of 79.03
Both MACD and RSI indicators are confirming the bullish scenario.
Risk Disclosure: Trading Foreign Exchange (Forex) and Contracts of Difference (CFD's) carries a high level of risk. By registering and signing up, any client affirms their understanding of their own personal accountability for all transactions performed within their account and recognizes the risks associated with trading on such markets and on such sites. Furthermore, one understands that the company carries zero influence over transactions, markets, and trading signals, therefore, cannot be held liable nor guarantee any profits or losses.

WTI analysisOil buyers are strong and due to hitting the ceiling of the channel, we don't see a heavy drop and it is a sign for more growth
As long as it is above the box, it is an upward trend
