WTI/USOIL SELLWTI/USOIL SELL, This is what I am looking at, this could be a long term sell if get more downside confirmations.
Wtioil

USOIL Head and shoulder formation. Potential sell The USOIL is forming the right Shoulder of an Head and Shoulder formation. This is a reversal sign and we expect the price to drop once the shoulder is completed.
Watch out for the breaking of trend line to enter a sell position.
There are 3 potential targets with the first one more conservative and the second and third more aggressive.

Technical analysis update: WTI oil (17th January 2022)WTI oil continues to march higher and we continue to maintain a bullish outlook on oil. Our view is supported by a combination of bullish technical and fundamental factors. Currently, we will observe whether USOIL will manage to break above the major resistance at 85.39 USD which will further bolster the bullish case for WTI oil. We would like to set a new short-term price target for USOIL to 85 USD per barrel. Our long-term price target is 90 USD per barrel.
Technical analysis - daily time frame
RSI is very bullish and due to perform crossover above 70 points (into overbought zone). We expect such a phenomenon to be accompanied by further rise in price. However, after completion of crossover we think it is likely that price will retrace lower before continuing towards a price tag of 90 USD per barrel. MACD and Stochastic are also bullish. DM+ and DM- signal bullish trend. Additionally, ADX exhibits growth which suggests that the prevailing bullish trend is gaining strength. Overall, the daily time frame is bullish.
Technical analysis - weekly time frame
RSI is bullish. Same applies to MACD and Stochastic. DM+ and DM- performed bullish crossover recently. ADX undergoes reset as it declines. Overall, the weekly time frame is bullish.
Support and resistance
Major resistance sits at 85.39 USD while major support lies at 61.76 USD. Support 1 sits at 80.81 USD and Support 2 at 78.28 USD.
Please feel free to express your own ideas and thoughts in the comment section.
DISCLAIMER: This analysis is not intended to encourage any buying or selling of any particular securities. Furthermore, it should not serve as a basis for taking any trade action by an individual investor. Your own due diligence is highly advised before entering trade.

USOIL - BEARISH MOVE 📉the usoil price is in the weekly resistance level 🔥
i predict a bearish move 📉
i'm waiting for breakout🧐
TARGET: 75.351 🎯
if you enjoyed this IDEA, leave a LIKE, SUBSCRIBE or COMMENT!

Oil Analysis Updated - Key Levels AnalysedIn this video we look at the current price levels for Oil and put together some multi-timeframe analysis to argue about a short / medium term sell off from these levels.

WTI OIL Potential Market Top. Time to sell again? Risk involved.Those who follow me for a long time here and on Reddit know how bullish I've been on WTI since the rescue packages arrived in 2020. Since March 08 2021, though a new and very well structured Megaphone pattern has emerged that has allowed us to trade both directions with high efficiency. Most recently, since November 30 to be exact, I've started with buy trades on the expected rally to the Higher Highs trend-line of this Megaphone:
All targets during that leg have been accomplished and now WTI Oil is getting very close to the top of the pattern. Notice that during the previous rally of late August - late October 2021, this Top was projected by the Ichimoku squeeze. This squeeze is only 1 week away, so technically it is a valid strategy to start selling again. Now of course selling a long-term bullish market is a counter-trend move and involves higher risk than dip buying, so approach this strategy in accordance to your risk tolerance.
Technically, targeting the 0.5 Fibonacci retracement level or at least the 1D MA100 (green trend-line) is a viable option.
--------------------------------------------------------------------------------------------------------
** Please support this idea with your likes and comments, it is the best way to keep it relevant and support me. **
--------------------------------------------------------------------------------------------------------

Short Oil to $75?In order for the uptrend to remain intact, price would need to hold above the $83 level as support. However, because the moving averages on the ichimoku are really spread apart, it tells me price needs to snap back to equilibrium before a continuation of the uptrend.
I think it's likely that price move back to the $75 range before a continuation of an upside move.

Crude Oil - H4 - Shorts for a 1200 pips target Crude Oil - H4 - shorts at cmp 85.30 with target 73.50 and stops above 87. Lets ride

wti crude oil currently running down sell and hold the Wii crude oil global update as well as down fall is erected ...........

USOILThinking we are going to 1st test $86-$88 B4 a sub wave 4 starts and then completes around $78. After that sub wave 4 should end and sub wave 5 should start of the greater wave 5 which ends over $100 plus mid 2022

CRUDE OILWe can see the formation of a head and shoulders pattern on oil. We expect the decline, targeting the level of 70 as the first target and 55 as the second target. 53 The third target, the stop loss will be at the level 92, For a safe entry, wait for the trend line to break, the entry area when the price formed the double top

OIL WTI Short Looking for short position, around FIbo levels at 127,2% retracement, supported by FE100, AB=CD.

formed a head and shoulder pattern in 1 hr time frame formed a head and shoulder pattern in 1 hr time frame
good resistance in head and shoulder area
expecting it to fall towards the first target
trendline also supporting the fall towards the target
happy trading

Technical analysis update: WTI oil (3rd January 2022)WTI oil rose over 20% since its low at 61.46 USD on 2nd December 2021. We previously noted that weakness in the general stock market posed a threat for further rise of the price of USOIL in the short-term. However, since then the general stock market seems to stabilize. Because of that we regained our bullish view; additionally, we would like to set a short-term price target for USOIL to 77 USD.
Technical analysis - daily time frame
RSI continues to develop bullish structure. Stochastic is also bullish and MACD performed a bullish crossover above 0 points which further bolsters the bullish case for USOIL. DM+ and DM- show mixed conditions; and ADX declined substantially which suggests that the prevailing trend lost strength.
Technical analysis - weekly time frame
RSI points to the upside which is bullish. Stochastic is bullish too and MACD started to flatten (still in the bullish zone). We will observe MACD in the following weeks and we will watch out whether it manages to stay within the bullish zone and reverse back to the upside. DM+ and DM- show bearish conditions while ADX continues to decline. Though, ADX's value is a little bit higher than the value of ADX on a daily time frame.
Illustration 1.01
Picture above shows the weekly chart of USOIL. It also shows setup for head and shoulders being formed. We will observe whether this pattern will continue to develop further. However, at the moment, we believe this pattern will get distorted and price will continue higher.
Support and resistance
Following support and resistance levels are derived from the peaks and troughs in price of USOIL. Short-term support sits at 73.30 USD and short-term resistance lies at 77.41 USD. Next closest resistance appears at 79.20 USD and then at 81.78 USD. Major resistance lies at 85.39 USD. Major support level can be found at 61.76 USD.
DISCLAIMER: This analysis is not intended to encourage any buying or selling of any particular securities. Furthermore, it should not serve as a basis for taking any trade action by an individual investor. Your own due diligence is highly advised before entering trade.

OIL Analysis. Buy and Sell POIs marked
Will look for a Sell or a buy in the marked POIs. No direct entries.
Risk 1% and aiming for 10% on this trade. No indicators used. Pure price action. Like to keep my chart clean. Simply trading structure, nothing else!!
All trades closed on the same day. Entries are taken on 1 min or lower timeframes. Stop loss is moved to cost after structure break. Don't chase the trades, wait for the next opportunity.
Also, please view price action on 1 min chart if you're following my entries. It will make sense. Trading view doesn't allow to post entries on charts smaller than 15 minutes.
Mostly trade 12-5pm UK time NY session. Sometimes London Session. Don't like the idea of watching charts the whole day.

OIL: Huge Head & ShouldersWow! Could this be the right shoulders forming on OIL?
The remaining imbalance is being filled and we are creeping up into the main supply, if we see rejections, we could have a bearish move all the way down into the equal lows.
Traders, if you have your own opinion about this idea, write in the comments section, I always reply.
RISK DISCLAIMER:
Trading Crypto, Futures, Forex, CFDs, and Stocks involves a risk of loss.
Please consider carefully if such trading is appropriate for you.
Past performance is not indicative of future results.
Always limit your leverage and use a tight stop loss.
--------------------------------------------------------------------------------------------------------
Please like, subscribe, and share this idea with others!
--------------------------------------------------------------------------------------------------------

go long in wti usd started forming a support in trend line and tryig to hold in trend line,
good place to consider buy

LONG WTIUSDLong WTIUSD, Trending up, flag Pattern,
Entry - MACD Cross
Exit - MACD Cross
Stoploss - 200EMA

WTI OIL The important 1D MA50 testWell I've been tracking and trading the pattern you see on this chart for over a month and the very last formations have played out particularly well:
Right now WTI is ahead of the first important test of this uptrend, the 1D MA50 (blue trend-line) which is currently posing as a Resistance. If that breaks, we have a strong case of a bullish continuation. However, this the current wave is repeating that of August - September quite closely, the (yellow) Lower Highs trend-line will be critical as well, and what I am particularly looking as confirmation is a rejection there, hold on the 1D MA50 and the red Ichimoku area and then a strong bullish break-out. The RSI is so far on course for its Symmetrical Resistance of those Lower Highs. If that breaks, our next target will be $85.00.
--------------------------------------------------------------------------------------------------------
** Please support this idea with your likes and comments, it is the best way to keep it relevant and support me. **
--------------------------------------------------------------------------------------------------------

USD/CAD Technical Analysis, WTI CAD Fundamental OverviewUSDCAD has reached a 1 year high @1.2965. Breaking through the 1.2960 resistance could lead USDCAD to push towards 1.3020.
Canada Core Retail Sales came out under expectations (1.3% vs 1.6%), reinforcing with fundamentals the technical analysis.
Omicron is now the dominant COVID strain in US, with new cases soaring in Canada as well. Tighter measures have been put in place on Monday, as Quebec shuts down schools, bars, gyms.
WTI price is still under pressure despite the recent rebound, likely a reaction to the new wave of omicron virus is hitting US and Europe, with the new restrictions from countries (still not in place in certain large markets, but are being studied) may reduce the demand of WTI and put heavy pressure on its price.
CAD is one of the major commodity currencies which is highly correlated with WTI’s price, so lower price on WTI will push USDCAD trend to go higher as weaker CAD is expected.
Any opinions, news, research, analyses, prices, other information, or links to third-party sites contained on this website are provided on an "as-is" basis, are intended only to be informative, is not an advice nor a recommendation, nor research, or a record of our trading prices, or an offer of, or solicitation for a transaction in any financial instrument and thus should not be treated as such. The information provided does not involve any specific investment objectives, financial situation and needs of any specific person who may receive it. Please be aware, that past performance is not a reliable indicator of future performance and/or results. Past Performance or Forward-looking scenarios based upon the reasonable beliefs of the third-party provider are not a guarantee of future performance. Actual results may differ materially from those anticipated in forward-looking or past performance statements. easyMarkets makes no representation or warranty and assumes no liability as to the accuracy or completeness of the information provided, nor any loss arising from any investment based on a recommendation, forecast or any information supplied by any third-party

USOIL Price TargetIf you haven`s shorted the top here:
Then you should know that USOIL seems to be heading to its major support at 60.40usd.

in coming week : oil going to fibo 61% still we advice buy near 70$ and buystop on friday high around 72 and wait minimum to fibo 61% around 77
alert= if low break,oil can crash to 50$ so put sl in low
good luck
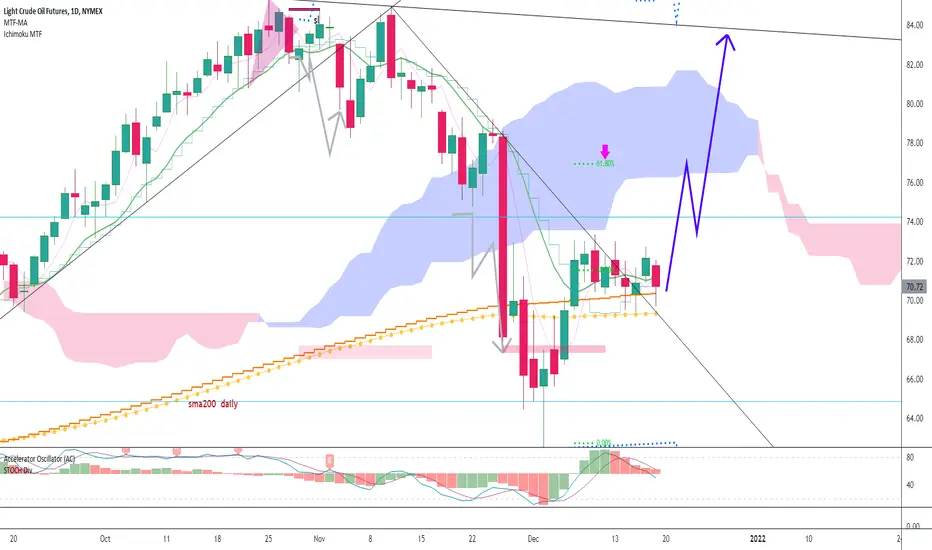
WTI OIL Consolidation almost over. Buy the break-out.This is an update to a pattern on WTI that I've been working on since August:
As you see, the price did eventually rebound and right now is consolidating within the 1D MA200 (orange trend-line) being the Support and the 1D MA100 (green trend-line) being the Resistance. This is similar to the August 25 - September 10 consolidation, looking like another accumulation phase before a major rally.
Be ready to buy the break-out and target 76.30 on the short-term, which where the 1D MA50 (blue trend-line) may act as a Resistance. After the (yellow) Lower Highs trend-line breaks, our attention shifts to the long-term target of $85.00.
--------------------------------------------------------------------------------------------------------
** Please support this idea with your likes and comments, it is the best way to keep it relevant and support me. **
--------------------------------------------------------------------------------------------------------
