Usoil short trade idea It's looking for good short trade. Price near at strong resistance $76.XX. Goodluck
Wtioil

Technical analysis update: WTI oil (27th September 2021)USOIl reached our short-term price target overnight. We continue to be bullish on WTI oil. Because of that we would like to change medium-term price target of 77.50 USD to short-term price target. Similarly, we would like to change long-term price target of 80 USD to medium-term price target. We would also like to set new long term price target to 90 USD per barrel.
Technical analysis
RSI continues to evolve its bullish structure. We will observe RSI closely in the following days and we will look for crossover into overbought territory (above 70 points). We expect this phenomenon to be accompanied by strong upside price action. Stochastic is also bullish as it oscillates in the upper area. In addition to that MACD is bullish too. ADX contains low value which suggests that trend is very weak at the moment. Despite that we remain bullish on USOIL and we expect bullish trend to resume soon.
Support and resistance
Short-term support sits at 73.11 USD. Major support level appears at 61.58 USD while major resistance level appears at 76.95 USD.
Here is our previous thought from 15th September 2021:
Here we did set short-term price target to 75 USD which was reached today overnight. We also layed out bullish case for USOIL.
Here is our previous thought from 3rd September 2021:
Here we did set short-term price target of 72.50 USD which was subsequently reached in two weeks.
Disclaimer: This analysis is not intended to encourage any buying or selling of any particular securities. Furthermore, it should not serve as basis for taking any trade action by individual investor. Your own due dilligence is highly advised before entering trade.

WTI. H&S looks pretty wry, but yet it looks like H&SShort at 73.75
Stop goes above last cluster high (77.5)
If it plays like H&S should play (IF!), I would take my profit at 43.75

WTI OIL Buy levels the MA50/200. Potential $90 move if 77 breaksOn my most recent WTI Oil idea two weeks ago, I highlighted the importance of the Inverse Head and Shoulders (IH&S) pattern that emerged on the 1D time-frame and why the 1D MA50 (blue trend-line) was the 1st buy candidate of the current bullish leg:
As you see the 1D MA50 worked perfectly as a buy entry and the upper Resistance targets have been hit. However since the price was rejected just below the 77.00 Resistance, it is possible to see another 1D MA50 test, which again will be our first buy entry. Second and final will be the 1D MA200 (orange trend-line) if the Pivot Zone fails to support.
If however we close a 1D candle above the 77.00 Resistance then it will be a bullish break-out of the Inverse Head and Shoulders, in a similar way as the previous IH&S that broke upwards on May 28 2021. The break-out extended as high as the 2.0 Fibonacci extension. If the same sequence is followed, then the 2.0 is currently at 92.24. In that case our long-term target will be $90.
** Please support this idea with your likes and comments, it is the best way to keep it relevant and support me. **
--------------------------------------------------------------------------------------------------------
!! Donations via TradingView coins also help me a great deal at posting more free trading content and signals here !!
🎉 👍 Shout-out to TradingShot's 💰 top TradingView Coin donor 💰 this week ==> Vergnes
--------------------------------------------------------------------------------------------------------

WTI Oil can correct to 70 zoneYesterday, after a short-lived spike above 76, WTI reversed strongly confirming this zone as strong resistance
A deeper correction can follow from this point and we can look to sell rallies under 76
A daily close above resistance would negate this scenario

Technical analysis update: WTI oil (15th September 2021)USOIL reached our short term price target of 72.50 USD today. We still remain bullish on USOIL. Because of that we would like to set new short term price target for USOIL to 75 USD per barrel. Our medium price target is 77.50 USD and long term price target is 80 USD.
Technical analysis
MACD is very bullish as it performed crossover above 0 points and entered a bullish zone (as we previously predicted). This strongly bolsters bullish case for USOIL. In addition to that RSI and Stochastic are also bullish. However, ADX contains low value suggesting neutral trend is present at the moment. Price of USOIL currently trades too far from its 20-days SMA which raises (immediate/short-term) concerns about retracement towards the SMA. Despite that we continue to be bullish on WTI oil (in big picture) and we expect higher price. Short term support sits around 70.50 USD while medium term support sits around 65 USD. Then major support appears around 61.50 USD and closest resistance at 74.21 USD while major resitance sits at 76.95 USD.
Our prior thoughts from a week ago:
Here we noted that we were closely watching MACD for crossover above 0 points. We also noted that we were looking for breakout above short term resistance.
Disclaimer: This analysis is not intended to encourage any buying or selling of any particular securities. Furthermore, it should not serve as basis for taking any trade action by individual investor. Your own due dilligence is highly advised before entering trade.

Technical analysis update: USOIL (22nd September 2021)In recent days USOIL has been holding up relatively well in comparison to the general market. It currently trades around 71.30 USD. We forecast that positive developments in the airlines and the travel industry will drive demand higher over the next 6 months. Our short term price target remains 75 USD per barrel while our medium term price target is 77.50 USD. Our long term price target is 80 USD per barrel.
Technical analysis
RSI is bullish. MACD is also bullish. Stochastic oscillates in the bullish zone, however, it strives for reversal. ADX contains low value which suggests that trend is neutral. Despite that we remain bullish on USOIL and we expect resumption of bullish trend in close future.
RSI daily timeframe:
MACD daily timeframe:
Stochastic daily timeframe:
Support and resistance
Short term support sits around 70.50 USD. Another strong support appears around 65 USD while major support sits around 61.58 USD. Short term resistance sits at 73.11 USD. Medium term resistance sits at 74.21 USD and major resistance at 76.95 USD.
Disclaimer: This analysis is not intended to encourage any buying or selling of any particular securities. Furthermore, it should not serve as basis for taking any trade action by individual investor. Your own due dilligence is highly advised before entering trade.

Wait for the signal to buy Oil when retest appearsH1 time frame.
Structure: Uptrend.
The price rallied after breaking the double bottom reversal pattern on the 30 minute time frame and breaking the Key level of the correction at 71.50.
Waiting for the price to return to this area with a retest signal confirming the uptrend is back, you can find buying opportunities.
Profit target is zone 74.000.
-----------------------------------------------------------------------------------------------
Wish you all have a good trading day!

WTI CRUDE OILIt wants to break the uptrend but it hasn't happened yet. If it can go above the resistance zone, the buy position will continue.

Wait for a buy signal with OILH4 time frame.
Structure: The bullish structure is confirmed.
The price returned to the 70.00 support zone.
Here, wait for bullish setups on the 1-hour timeframe to buy.
The profit target is the 74.00 zone.
-----------------------------------------------------------------------------------------------
Wish you all have a good trading day!

WTI OIL Inverse Head and ShouldersLast time I made a post on WTI Oil the price was still struggling to get past both a very strong Lower Highs trend-line and the 1D MA50 (blue trend-line on the left chart):
Well the price managed to break and close above both and rallied. The rejection though near the 74.15 Resistance has formed an Inverse Head and Shoulders (IH&S). Look how the Pivot Zone mentioned on the previous analysis is almost perfectly matched as the Shoulder line. Naturally, we should be expecting an initial pull-back and since the IH&S is a bullish reversal pattern, break above the 74.15 afterwards.
However we need to consider an earlier potential Support and that's the 1D MA50 which, as mentioned, was previously the Resistance since August 03. That fits well the pattern on the right side (which is on the 4H time-frame) which is a Channel Up whose Higher Lows trend-line limit is currently roughly where the 1D MA50 is.
Short-term target if the Pivot Zone holds is the 74.15 Resistance (1). Long-term target is the 77.00 Resistance (2). A candle close below the Pivot Zone temporarily sets this back to the 1D MA200 (orange trend-line on the left chart).
** Please support this idea with your likes and comments, it is the best way to keep it relevant and support me. **
--------------------------------------------------------------------------------------------------------
!! Donations via TradingView coins also help me a great deal at posting more free trading content and signals here !!
🎉 👍 Shout-out to TradingShot's 💰 top TradingView Coin donor 💰 this week ==> Vergnes
--------------------------------------------------------------------------------------------------------

Bearish broadening wedge on USOIL! WTI technical analysis!Hello my beauties.
It seems that the price of oil, while climbing, has created a bearish broadening wedge (or megaphone).
The completion zone for this pattern is the green area.
I'll wait for any wign of weakness and initiate a short position to the completion zone.
If you find this idea to be helpful like, follow, and drop a comment below if you'd want me to analyse a different pair.
Consider supporting me if you think I am providing you with value.
Peace.
Luca, TrickleDownFX

Technical analysis update: WTI oil (2nd September 2021)USOIL continues to trade just slightly below its short term resistance at 69.60 USD per barrel. In terms of technicals RSI is flattening but still bullish. MACD and Stochastic are also bullish. However, ADX is low which suggests no trend or very weak trend. We remain bullish on WTI oil. We expect WTI oil to surpass its short term resistance and restart its previous bullish trend. Our short term price target remains 70 USD. Our medium term price target is 77.50 USD and long term price target 80 USD.
Disclaimer: This analysis is not intended to encourage buying or selling of any particular securities. Furthermore, it should not serve as basis for taking any trade action by individual investor. Your own due dilligence is highly advised before entering trade.

Technical analysis update: WTI oil (3rd September 2021)Our short term price target of 70 USD was reached yesterday. USOIL currently trades around 70.30 USD. We remain bullish on WTI oil. Our medium term price target is 77.50 USD and our long term price target is 80 USD. We would like to set new short term price target for USOIL to 72.50 USD.
Technical analysis
RSI and Stochastic are bullish. MACD has bullish direction and we will observe it closely in the following days. We will look for crossover above 0 points (to the bullish zone). We expect this phenomenon to further bolster bullish case for the WTI oil. Previous short term resistance (at 69.60 USD) now acts as short term support. Medium term resistance is at 74.21 USD. Major resistance sits at 76.95 USD and major support sits at 61.58 USD.
Depiction above is another interesting setup for USOIL when a line is drawn from the peak of 76.95 USD and extended through the peak of 74.21 USD.
Latest news in the oil market
1.OPEC continues to keep its supply boost agreement in place signaling healthy oil market. News media report that OPEC+ is expected to raise its 2022 oil demand growth forecast to 4.2M bbl/day from its previous outlook of 3.28M bbl/day.
2. EIA reports that the U.S. crude oil inventories fell more than expected last week. U.S. crude stockpiles fell by 7.2M barrels to 425.4M barrels. This is despite domestic production continues to climb to a 15-month-high.
3. Yesterday Javad Owji (Iran’s new Oil Minister) met with top official from the China national Petroleum Corporation (CNPC) to discuss cooperation and expansion of bilateral relations.
Disclaimer: This analysis is not intended to encourage buying or selling of any particular securities. Furthermore, it should not serve as basis for taking any trade action by individual investor. Your own due dilligence is highly advised before entering trade.

Technical analysis update: USOIL (7th September 2021)USOIL gave up some of its gains from the last week. Currently it trades just below upper bound of downward moving channel. We continue to monitor USOIL closely while we look for any strength and potential breakout above the upper bound of a channel. We think this would be bullish developement for USOIL and it would be followed by another breakout above the short term resistance. We remain bullish on WTI oil. Our short term price target is 72.50 USD and our medium term price target is 77.50 USD. Our long term price target is 80 USD.
Technical analysis
RSI is flattening. MACD has bullish direction but it remains in the bearish territory. We continue to observe MACD closely while we watch out for crossover above 0 points (to the bullish zone). We previously noted that we expect such developement to further bolster bullish case for USOIL. Immediate support/resistance sits at 69.60 USD. The short term resistance is around 70.50 USD while medium resistance is at 74.21 USD. Long term resistance is at 76.95 USD. Another important price level is at 65 USD. This level now acts as strong support. Then finally major support level sits at 61.58 USD.
Weekly chart:
Monthly chart:
Prior developements from 3rd September 2021:
Disclaimer: This analysis is not intended to encourage buying or selling of any particular securities. Furthermore, it should not serve as basis for taking any trade action by individual investor. Your own due dilligence is highly advised before entering trade.

Uptrend Returns to Oil?H4 time frame.
Structure: Downtrend.
The current price is still trading in the range of the 70.00 resistance zone .
Oil price is having upward moves to break the resistance level of 70.00 but there is no confirmation yet.
Along with that, the uptrend is decreasing, showing clear divergence signals.
In the bullish case, a clear rise above the 71.00 level is needed and there are confirmation retest signals.
In the case of a downtrend, it is necessary to wait for the price to break the Key level and confirm the downtrend is back.
-----------------------------------------------------------------------------------------------
Wish you all have a good trading day!

Technical analysis update: USOIL (13th September 2021)USOIL continues to trade around its short-term resistance near 70.50 USD price level. We continue to be bullish on USOIL. Our short term price target is 72.50 USD. Our medium term price target is 77.50 USD and long term price target is 80 USD.
Technical Analysis
ADX exhibits low value suggesting that trend is neutral or very weak. Although, RSI and Stochastic are very bullish. MACD is also very bullish. Indeed, it is performing crossover above 0 points (that we predicted in our previous idea). We expect this phenomenon to result in resumption of the bullish trend and subsequent price rise. Important support levels appear near 65 USD and then at 61.78 USD. Contrary to that, closest resistance sits at 74.21 USD and then at 76.95 USD. We currently remain bullish on price of WTI oil.
Disclaimer: This analysis is not intended to encourage any buying or selling of any particular securities. Furthermore, it should not serve as basis for taking any trade action by individual investor. Your own due dilligence is highly advised before entering trade.


A reversal pattern appeared at an important zone with OILH4 time frame.
Structure: Downtrend.
After the price rose to the important Key level of 70.00, there is now a head and shoulders - reversal pattern.
Now waiting for the price to clearly break this reversal pattern or break the Key level up move at the price of 67.000, we can find selling opportunities.
The profit target is the 62.000 zone.
-----------------------------------------------------------------------------------------------
Wish you all have a good trading day!

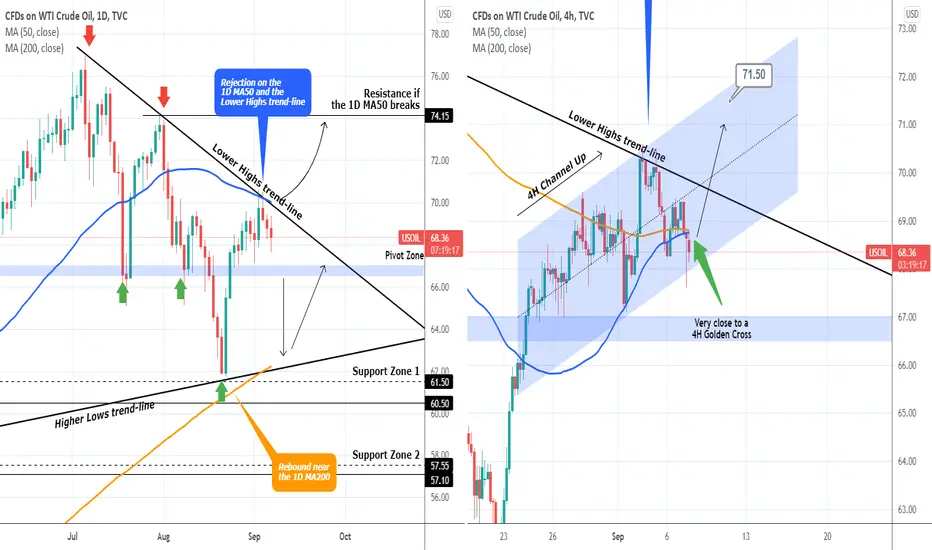
WTI OIL analysis on the 1D and 4H time-framesLast time I analyzed WTI Oil on August 24, I made it clear that it was trading within a long-term Triangle and until it broke, its price action would be sideways:
I stressed out the importance of the 1D MA50 (blue trend-line) and the Lower Highs trend-line of that Triangle. Well as you see on the chart, WTI Oil got rejected exactly on that Resistance level twice and has been pulling-back since. Until the price closes a 1D candle above the 1D MA50, the bias are towards the Pivot Zone. A 1D closing below it, sees the 1D MA200 (orange trend-line) as target, which last time held (August 20-23). That is on the left chart which is on the 1D time-frame.
On the 4H time-frame (right chart), a Channel Up has been formed, which naturally is limited by the Lower Highs trend-line (and 1D MA50) of the Triangle. The previous 4H candle, even though it broke below the Channel Up, it managed to close inside it, so as long as we close within the pattern, the short-term target is 71.50. On the long-term, as shown on the 1D chart, it is the 74.15 Resistance.
** Please support this idea with your likes and comments, it is the best way to keep it relevant and support me. **
--------------------------------------------------------------------------------------------------------
!! Donations via TradingView coins also help me a great deal at posting more free trading content and signals here !!
🎉 👍 Shout-out to TradingShot's 💰 top TradingView Coin donor 💰 this week ==> GJMRealEstate
--------------------------------------------------------------------------------------------------------
WTI USOIL Short setupHello Traders,
this is my idea for TVC:USOIL .
Post your idea/analysis below for discussion.
Thank you all for your support.
For more accurate setups, stop loss, take profits and mentoring services, FX signals, Crypto, Indices and Stocks PM me.

Waiting for the opportunity to sell with USOILH2 time frame.
HIgher time frame downtrend structure, price tends to rise to Key level 70.00 then price breaks the trendline.
Price formed a double top reversal pattern with a divergence signal.
However, the bullish structure remains and there is no bearish confirmation yet.
Wait for the price to drop below the price of 67.00 and have a bearish confirmation to find a selling opportunity.
Profit target after price confirmation is 62.00.
-----------------------------------------------------------------------------------------------
Wish you all have a good trading day!

Analysis of the downtrend of WTI OIL and targetsOil prices are constantly falling due to the deterioration of the corona !
After breaking its daily trend line, which was formed in March 2020, the price has again emptied the volume in a negative direction and is coming down !
.
.
After opening the market, if the price breaks 61.60, you can enter the sell position with the targets of 60.40, 58.00 n 55.00
