WTICOUSDhe West Texas Intermediate Crude Oil market has broken higher during the course of the trading session on Thursday as we broke above the $70 level. That is an area that I have been talking about for a while, and the fact that we broke above there is a very good sign and it is likely that we could go looking towards the $74 level. The $74 level is an area where we have sold off drastically in the past, and as a result it looks like we are going to continue to see that as important.
On the other hand, we could turn back around and go looking towards the 50 day EMA underneath, which is near the $60.75 level. That is an area that I think could offer quite a bit of support, and therefore think it is only a matter of time before the buyers would come back into that area. At this point in time, the $67 level is an area that has been support during the previous session, as well as many other days. As long as we can stay above the $67 level then it is likely that we will continue to go higher. However, breaking down below that level would open up a completely different scenario.
If we were to break down below the $67 level, then it is likely that the market would fall towards the $65 level, possibly even the 200 day EMA after that. When I look at this chart, that could very well be what happens next, but once we get past the jobs number will have a quite a bit more in the way of clarity, so therefore it is worth paying attention to how things end up at the end of the session. I feel at this point time we are at the precipice of some type of bigger move, so it is interesting to see how the market plays out at the end of the day.
The size of the candlestick is relatively impressive, although I do not necessarily think that it is an explosive move to the upside. If we can break above the top of the candlestick, then it is likely that we go much higher. Ultimately, this is a market that looks like we are going to see volatility coming soon. In that scenario, the end of the day on Friday is crucial.
Wtioil
Oil price overview simple and powerful analysisComing drop as shown in the drawing
Reflective candle on a daily frame
near a downtrend
And a retest of the previous uptrend
Down time also
If the uptrends break out, the scenario fails, but now good selling areas

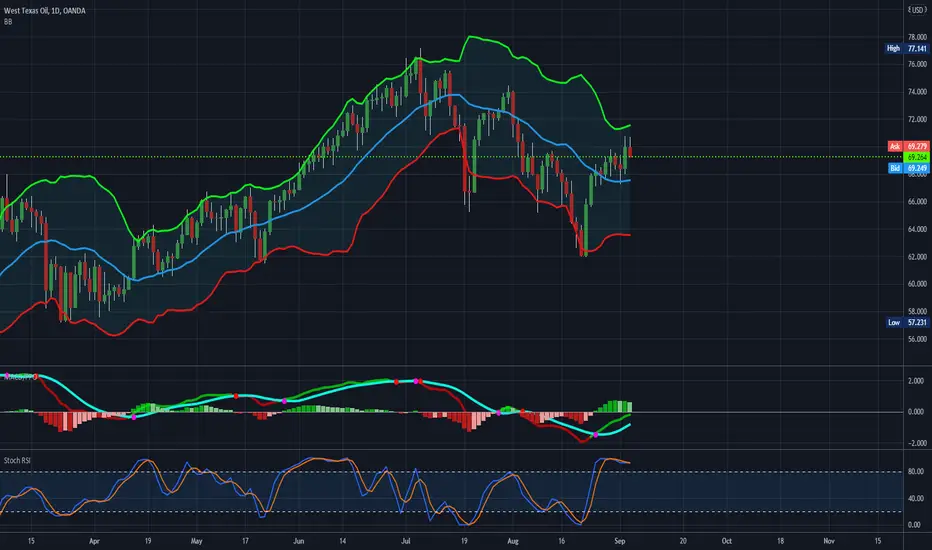
Technical analysis update: WTI oil (30th August 2021)During the night USOIL peaked exactly at short-term resistance sitting at 69.60 USD. We will closely observe this short-term resistance in the following days. We will look for strength in the oil price and we will observe whether USOIL has an abillity to surpass this price level. In terms of technicals, stochastic is bullish. RSI is bullish but shows signs of flattening. MACD is also bullish. However, MACD is still in the bearish area. We remain bullish on WTI oil. Our price short term price target is 70 USD. Our medium term price target is 77.50 USD and our long term price target is 80 USD.
Prior developments from 26th August 2021:
Here we noted that if price of USOIL managed to hold above 65 USD it would be bullish.
Disclaimer: This analysis is not intended to encourage buying or selling of any particular securities. Furthermore, it should not serve as basis for taking any trade action by individual investor. Your own due dilligence is highly advised before entering trade.

Technical analysis update: USOIL (26th August 2021)West Texas Intermediate oil continues to march higher. Yesterday it traded as high as 68.51 USD. RSI continues to rise since 20th August 2021. Although, yesterday it started to flatten little bit. MACD's averages crossed and point to the bullish direction now. However, we need to note that MACD is still in the bearish zone. Stochastic is bullish. We will observe price of USOIL in the following days for any weakness. Current level of the most importance is 65 USD and 70 USD. In our opinion if USOIL manages to hold above 65 USD pricetag then price will continue its rise. We are currently bullish.
Recent thoughts from 24th August 2021:
Disclaimer: This analysis is not intended to encourage buying or selling of any particular securities. Furthermore, it should not serve as basis for taking any trade action by individual investor. Your own due dilligence is highly advised before entering trade.

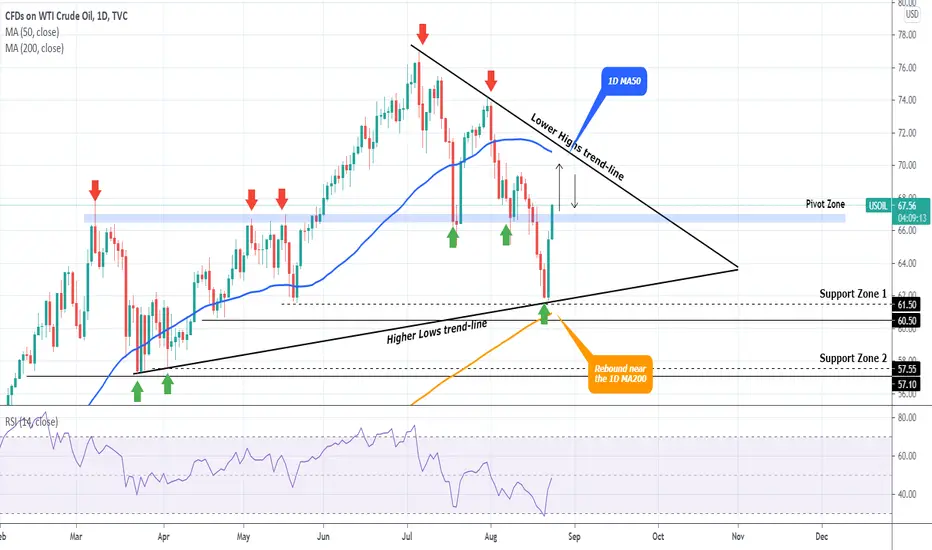
WTI OIL aiming at the 1D MA50Pattern: Triangle on 1D.
Signal: Buy as the price (a) made a strong rebound on the Higher Lows trend-line, (b) near the 1D MA200 (orange trend-line) and (c) broke above the Pivot Zone.
Target: The 1D MA50 (blue trend-line).
** Please support this idea with your likes and comments, it is the best way to keep it relevant and support me. **
--------------------------------------------------------------------------------------------------------
!! Donations via TradingView coins also help me a great deal at posting more free trading content and signals here !!
🎉 👍 Shout-out to TradingShot's 💰 top TradingView Coin donor 💰 this week ==> nevada999
--------------------------------------------------------------------------------------------------------

Support areas to enter the purchaseMost prominent areas to enter the oil long by performing an algorithmic sequence in the event that the last buying area breaks, the long entries will be lost. It is still too early for this statement but we must see how the price is drawn.

WTI OIL Double bottom at $65?WTI Oil has been trading within a Channel Up on the 1D time-frame since March. Despite the relative weakness we saw in July and so far in August, yesterday the price held on the 65.00 level , which if it holds will be a Double Bottom event.
This is not a formation that WTI Crude Oil is unfamiliar with, as on April 05 it made the very same Double Bottom while being on a corrective wave under the pressure of Lower Highs. Once those broke, the price went on to post Higher Highs within the 1.618 - 1.786 Fibonacci extensions. With the RSI on a Higher Lows much like in April, we expect to see new Highs once the Lower Highs trend-line breaks. Until then you may target the 1D MA50 (blue trend-line).
** Please support this idea with your likes and comments, it is the best way to keep it relevant and support me. **
--------------------------------------------------------------------------------------------------------
!! Donations via TradingView coins also help me a great deal at posting more free trading content and signals here !!
🎉 👍 Shout-out to TradingShot's 💰 top TradingView Coin donor 💰 this week ==> nevada999

Oil bullish projection !!We continue to search for oil longs to a new high and then look for sell zones. Not a lot of purchase volume!

WTI OIL Golden Cross 1W. One last top before major correction?Last week the Golden Cross (when the MA50 crosses over the MA200) on the 1W time-frame for WTI Oil went unnoticed. Last time we had a 1W Golden Cross was way back in April 2018. This raises an interesting fractal comparison.
As you see the price action when the Golden Cross happens is within a Channel Up both now then in 2018. Interestingly enough, when the Channel Up pattern started on both occasions, the RSI started printing Lower Highs, meaning it was on a Bearish Divergence. In 2018 that ultimately led to a blow-off top. Both sequences hit the $77.00 as their Highs. Does that fractal comparison indicate that WTI has one last dead-cat bounce to make before a major correction? What do you think?
** Please support this idea with your likes and comments, it is the best way to keep it relevant and support me. **
--------------------------------------------------------------------------------------------------------
!! Donations via TradingView coins also help me a great deal at posting more free trading content and signals here !!
🎉 👍 Shout-out to TradingShot's 💰 top TradingView Coin donor 💰 this week ==> sikret
--------------------------------------------------------------------------------------------------------

Technical analysis update: USOIL (5th August 2021)USOIL experiences selling pressure after its short rebound above 70 USD per barrel. Currently, price trades around Support 1. Next important level to watch is Support 2 at 65.11 USD. At the moment we expect this price level to hold. ADX is low which suggest neutral trend and thus sideways moving price action. MACD, RSI and Stochastic are all bearish on daily timeframe. Despite that we remain optimistic on future price of oil. Our medium term price target remains 77.50 USD and our long term price target remains 80 USD.
Here is hourly timeframe:
Disclaimer: This analysis is not intended to encourage buying or selling of any particular securities. Furthermore, it should not serve as basis for taking any trade action by individual investor. Your own due dilligence is highly advised before entering trade.

very simple analysis but effectiveSimply follow the prices with this analysis
If the price manages to cross the upper trend line, it will go to new highs
If the price manages to cross the lower trend line, it will go to the support shown in the graph


Technical analysis update: USOIL (27th July 2021)WTI oil continues to trade around 72 USD per barrel. Recently OPEC deal cleared out uncertainty about future supply boosts in the oil market. Despite initial selloff as reaction to the announcement of a deal we view this agreement among OPEC as bullish developement for medium and long term price of oil. Rising vaccination rates are leading to higher mobility in the U.S. and Europe. Higher mobility and less lockdowns subsequently hint to higher demand for oil in the near future. Earlier this year OPEC announced that it expects oil demand to rise by 6 million bpd this year. In addition to that IEA announced that it expects oil demand to rise by 5.4 million bpd this year and by another 3.1 million bpd next year. Though, pre-pandemic levels of demand (approximately at 100.6 million bpd) are expected to be reached by end of 2022. This points to the fact that oil market recovery is still in the progress and has plenty of room to continue. RSI and MACD are flattening out and becoming neutral. Stochastics is bullish. ADX contains low value suggesting weak or no trend. Our medium term price target is 77.50 USD per barrel and our long term price target for oil is 80 USD per barrel.
Developements from 20th July 2021:
Here we stated that price was very attractive for taking entry on long side of the market (price traded at 66.57 USD at time of publication). Then price rebounded back above 70 USD per barrel and continued further above 72 USD per barrel.
Disclaimer: This analysis is not intended to encourage buying or selling of any particular securities. Furthermore, it should not serve as basis for taking any trade action by individual investor. Your own due dilligence is highly advised before entering trade.

WTI OIL needs to break this Lower Highs trend-linePattern: Channel Up on 1D.
Signal: Buy if the Lower Highs trend-line breaks or if the MACD forms a Bullish Cross.
Target: 80.00 (below the 1.5 Fibonacci extension).
** Please support this idea with your likes and comments, it is the best way to keep it relevant and support me. **
--------------------------------------------------------------------------------------------------------
!! Donations via TradingView coins also help me a great deal at posting more free trading content and signals here !!
🎉 👍 Shout-out to TradingShot's 💰 top TradingView Coin donor 💰 this week ==> CryptoCreatin
--------------------------------------------------------------------------------------------------------

Technical analysis update: WTI oil (22nd July 2021)On 20th July 2021 USOIL halted its decline at 65.11 USD per barrel. Price traveled back to its short term simple moving average. Simultaneously, RSI reversed above 30 points, not piercing oversold line. This phenomenon tends to accompany strong trends of higher degree. In regards to oil it suggests that bullish trend of higher degree remains intact. MACD is flattening out. We think there are high odds of that correction ceased already. Our medium term price target remains 77.50 USD and our long term price target remains 80 USD per barrel.
Developements from 20th July 2021:
Here we announced that OPEC deal would be bullish in medium and long term for price of oil. This is mainly due to clearing out uncertainties about future supply boosts to the market. We also hinted at possibility of WTI oil going towards 65 USD under selling pressure. We also stated that any price below 67 USD per barrel would be attractive entry point for taking long position.
Prior developements from 5th July 2021:
Here we stated that we remain bullish despite increasing odds of correction. We set medium price target to 77.50 USD and long term price target to 80 USD.
More prior developements from 1st June 2021:
Here we correctly predicted move above resistance and subsequently reached our short term price target of 70 USD.
Disclaimer: This analysis is not intended to encourage buying or selling of any particular securities. Furthermore, it should not serve as basis for taking any trade action by individual investor. Your own due dilligence is highly advised before entering trade.

CL1 Short to 0.618 fibIRAQ IS SEEKING HIGHER OPEC+ PRODUCTION BASELINE: DELEGATE
UAE ENERGY MINISTRY SAYS NO AGREEMENT HAS BEEN REACHED YET WITH OPEC+ ON SUPPLY DEAL, DELIBERATIONS CONTINUE
With the OPEC agreement in a state of deliberation, and compliance a real question, the market is needing to price in some bearish risk potential. Especially given the recent extension that we've had. I believe that there is a real market deficit still, but this bearish risk is also very real.
I would be comfortable entering a short CL1 position until around $70, and reassessing before flipping long.
Of course, any significant news can change this view... all eyes on are OPEC

WTI OIL Buy SignalPattern: Channel Up on 1D.
Signal: Buy as the price (a) reached the Higher Lows trend-line of the Channel Up, (b) entered the Ichimoku Cloud and (c) the RSI hit its 1 year Support line.
Target: 77.80 (the previous Higher High).
Previous WTI OIL signal:
** Please support this idea with your likes and comments, it is the best way to keep it relevant and support me. **
--------------------------------------------------------------------------------------------------------
!! Donations via TradingView coins also help me a great deal at posting more free trading content and signals here !!
🎉 👍 Shout-out to TradingShot's 💰 top TradingView Coin donor 💰 this week ==> ProjectSyndicate

Technical analysis update: WTI oil (16th July 2021)WTI oil continues to experience selling pressure due to the stalemate within OPEC deal . However, anonymous sources hinted that some form of agreement has been struck between Saudi Arabia and UAE. If true, this would be bullish developement for price of oil. Before the selloff started we stated that selling would cease around 70 USD per barrel. Then price found its support at 70.79 USD and reversed back to the upside. Currently price fluctuates between 70 USD and 77 USD. MACD, RSI and Stochastics are all bearish. However, RSI shows first signs of flattening. Despite bearish technicals we remain bullish. We expect OPEC to reach agreement and view this as catalyst for move up. Our medium term price target remains 77.50 USD and our long term price target remains 80 USD per barrel.
Thoughts from 5th July 2021:
Here we warned investors about overbought condition in WTI oil. We also stated that odds of correction are increasingly growing.
More thoughts from 1st June 2021:
Here we predicted move above resistance and reached our price target of 70 USD.
Disclaimer: This analysis is not intended to encourage buying or selling of any particular securities. Furthermore, it should not serve as basis for taking any trade action by individual investor. Your own due dilligence is highly advised before entering trade.

WTI OIL, H4 - inverted HSH and harmonic patternInverted head and shoulders pattern suggests further uptrend. Target could be 88.6 of Fibo where is resistance level and harmonic pattern

CRUDE OIL - 73,54 Is Now ResistanceOur updated chart on WTI CRUDE OIL shows that the corerctyion is probably incomplete and the oirce under it's previous support/ now Resistance at 73.54
According to Reuters , Crude futures slipped on Monday as concerns over slowing global growth outweighed the prospect of tightening supply after talks among key producers to raise output in coming months stalled.
In the meantime, U.S. energy firms added oil and natural gas rigs for a second week in a row as oil prices recently rose to their highest since Oct. 2018, prompting some drillers to return to the well pad. Clearly the intention of the US is to control prices, with CPI tomorrow going to be crucial data for what happens next with the US dollar.
On the other hand, last week, the Organization of the Petroleum Exporting Countries and their allies, a group known as OPEC+, failed to reach an agreement to increase output from August while Saudi Arabia , the world's top crude oil exporter, will supply full contractual volumes of August-loading crude to at least five Asian countries but has turned down two of the buyers' requests for extra barrels....
In other words, the price is expected to keep being volatile but our charts suggest a short position unless it breaches over this crucial new resistance (73,54$).
the FXPROFESSOR


WTI OIL Getting closer to a buyPattern: Channel Up on 1D.
Signal: Buy when contact is made with the 1D MA50 (blue trend-line) or the RSI enters the long-term buy zone.
Target: 79.50 (top of the Channel).
** Please support this idea with your likes and comments, it is the best way to keep it relevant and support me. **
--------------------------------------------------------------------------------------------------------
!! Donations via TradingView coins also help me a great deal at posting more free trading content and signals here !!
🎉 👍 Shout-out to TradingShot's 💰 top TradingView Coin donor 💰 this week ==> ridethepig
--------------------------------------------------------------------------------------------------------
